
Webinar: Exposures to particles and volatile organic compounds across multiple transportation modes
Our CEO & Founder, Nick Molden presented a webinar on Exposures to particles and volatile organic compounds across multiple transportation modes on 14th December 2022. To watch the webinar and download the presentation please see below.
Our CEO & Founder, Nick Molden presented a webinar on Exposures to particles and volatile organic compounds across multiple transportation modes on 14th December 2022. To watch the webinar and download the presentation please see below.
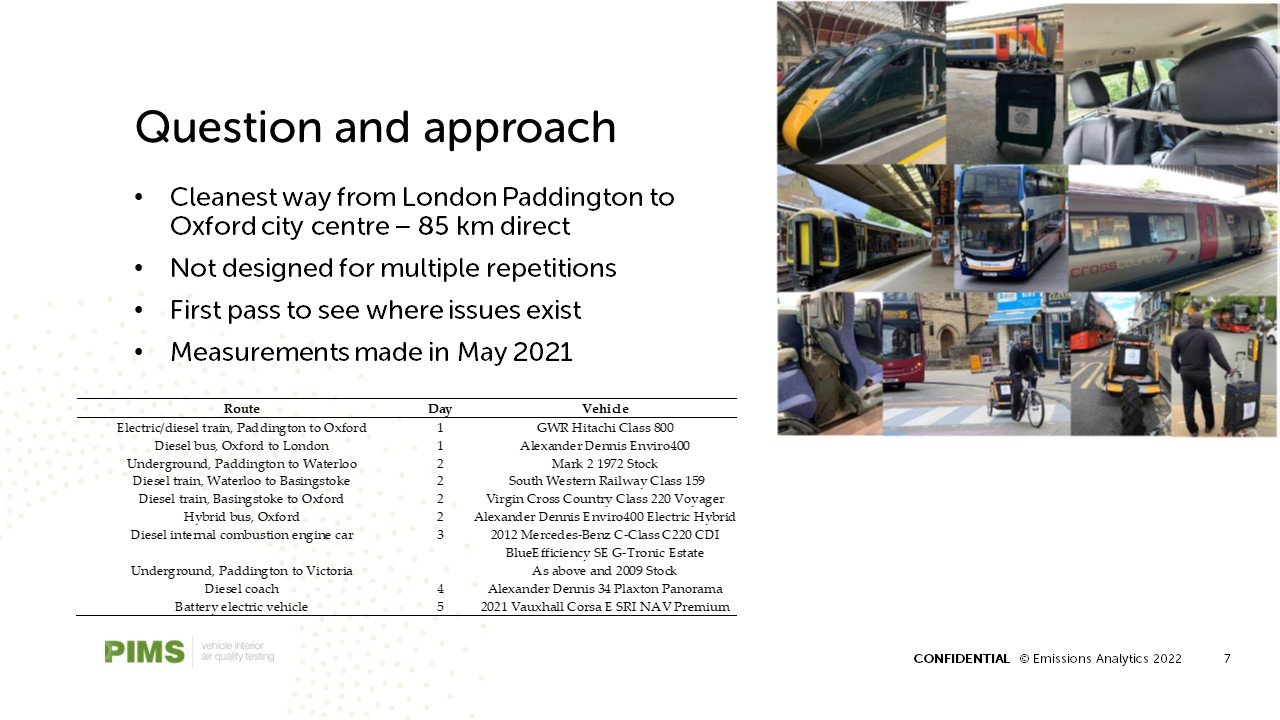
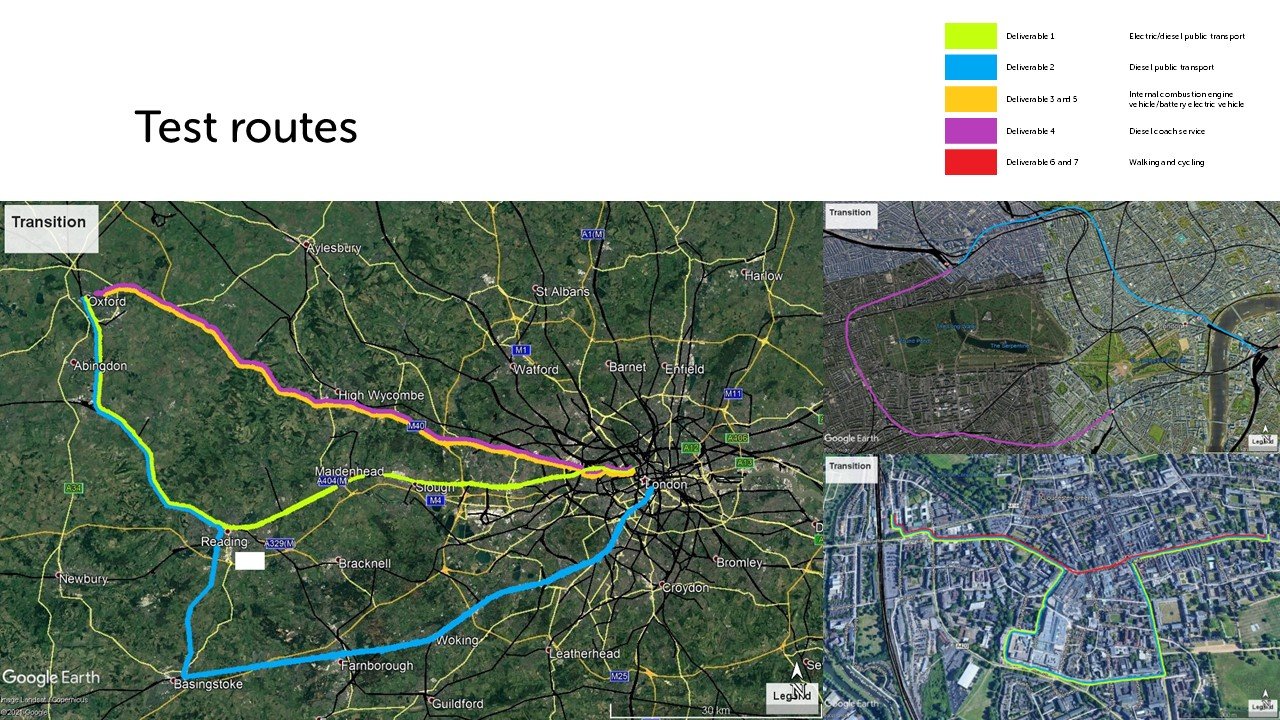
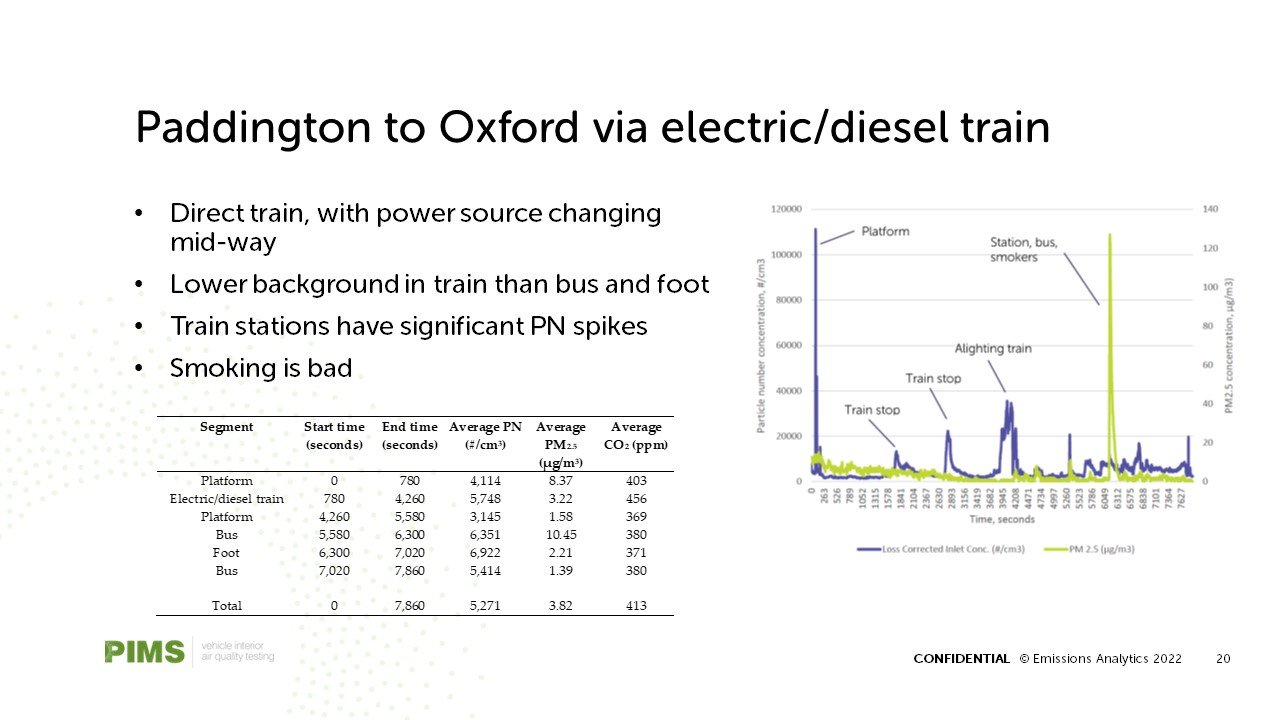
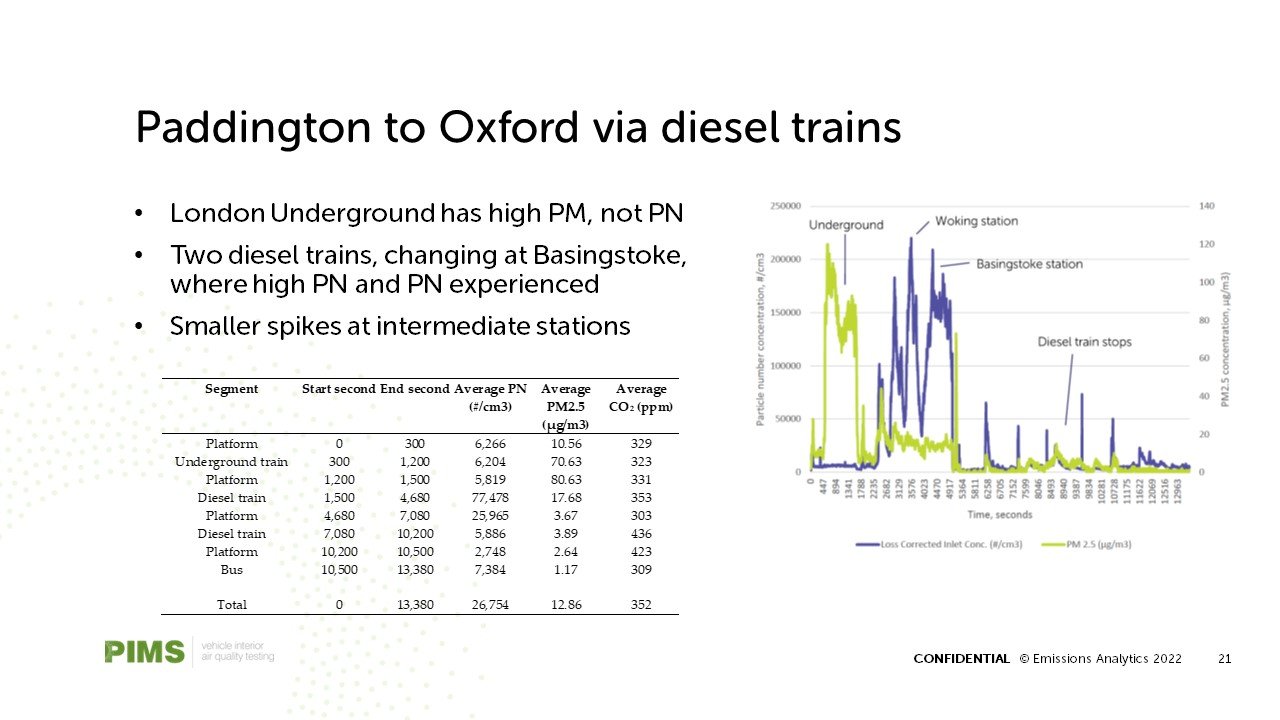
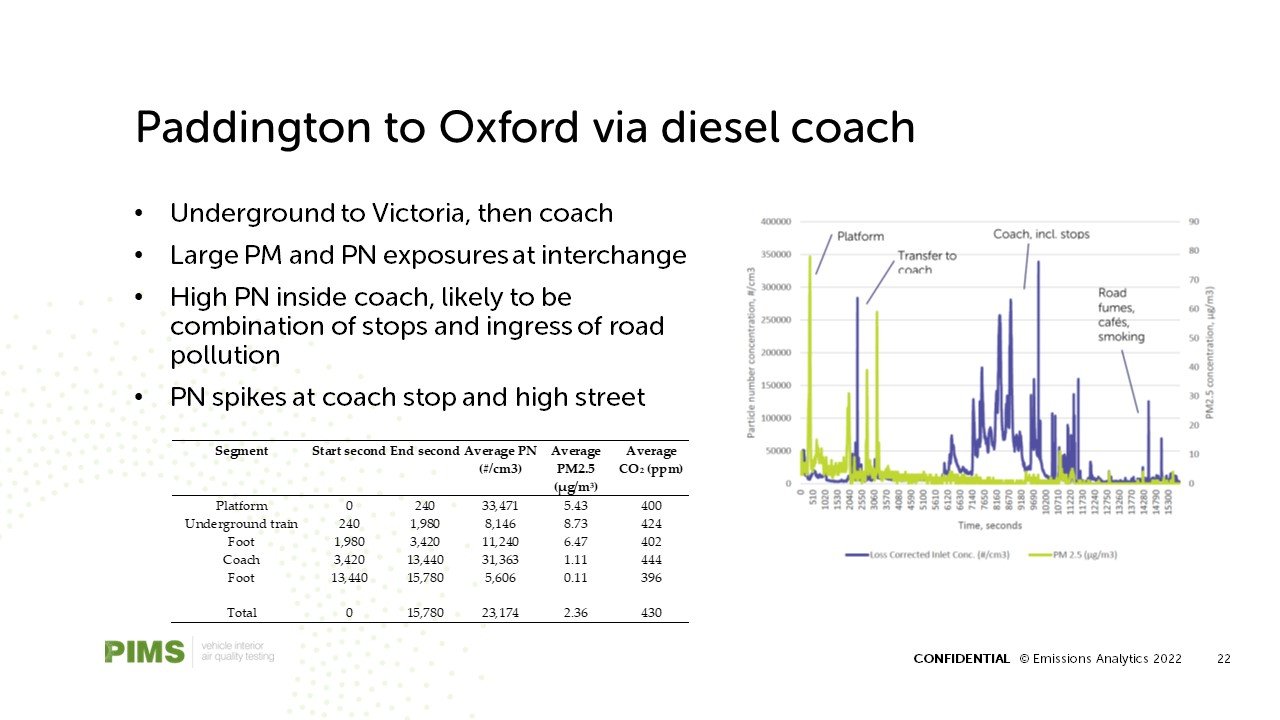
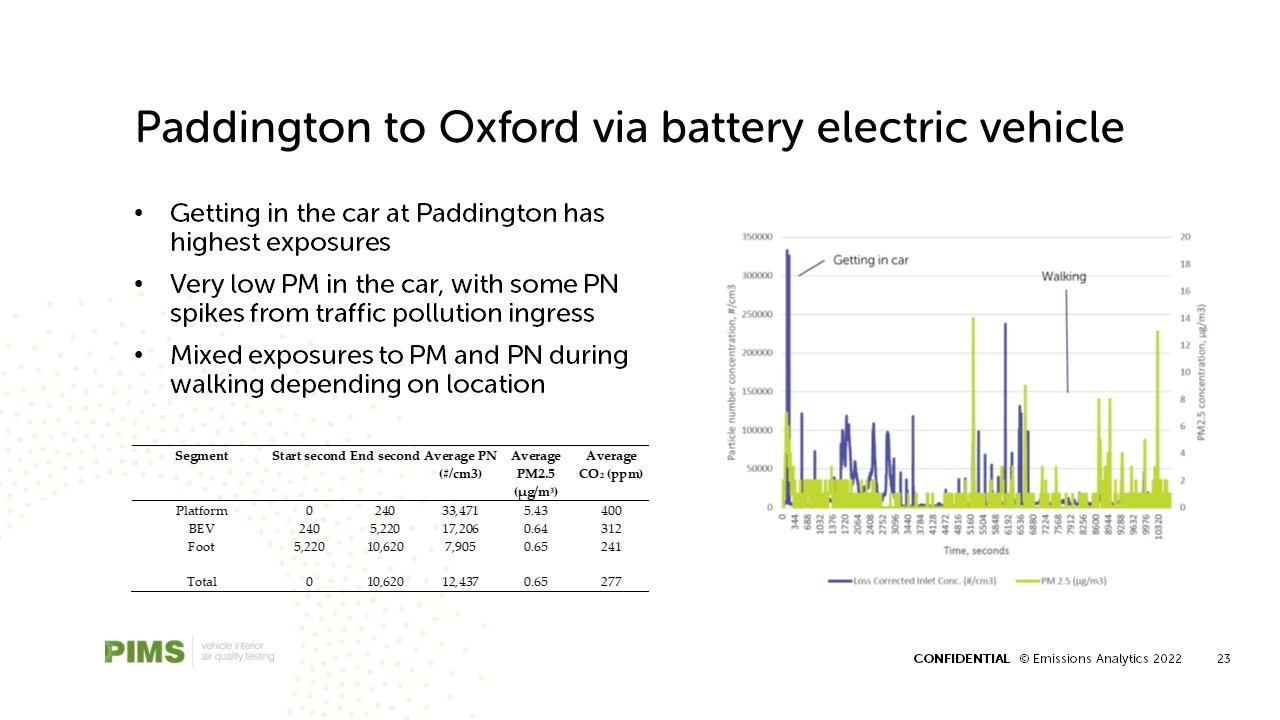
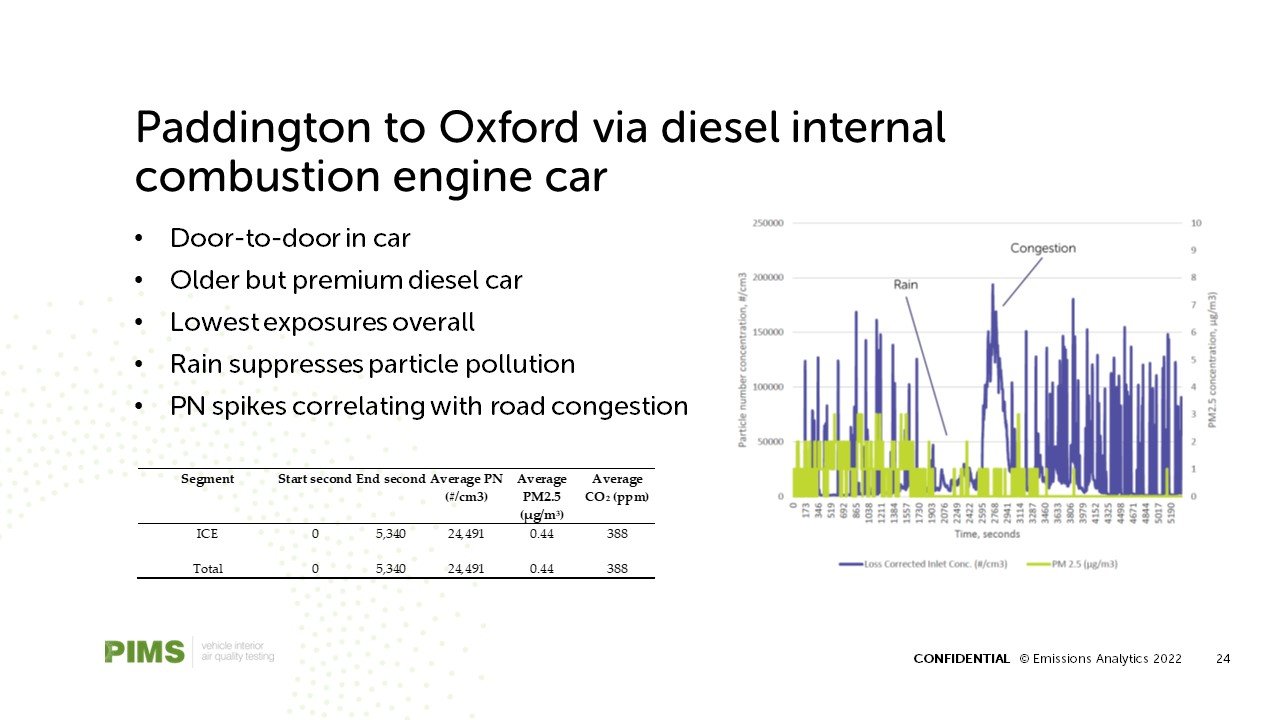
The webinar covered what’s is cleanest way to get from London Paddington to the centre of Oxford? Not in terms of tailpipe emissions, but rather in terms of the traveller’s own exposure to the air quality inside the mode of transport. Emissions Analytics studied this in a project for the TRANSITION Network in the UK, and this webinar will present the findings.
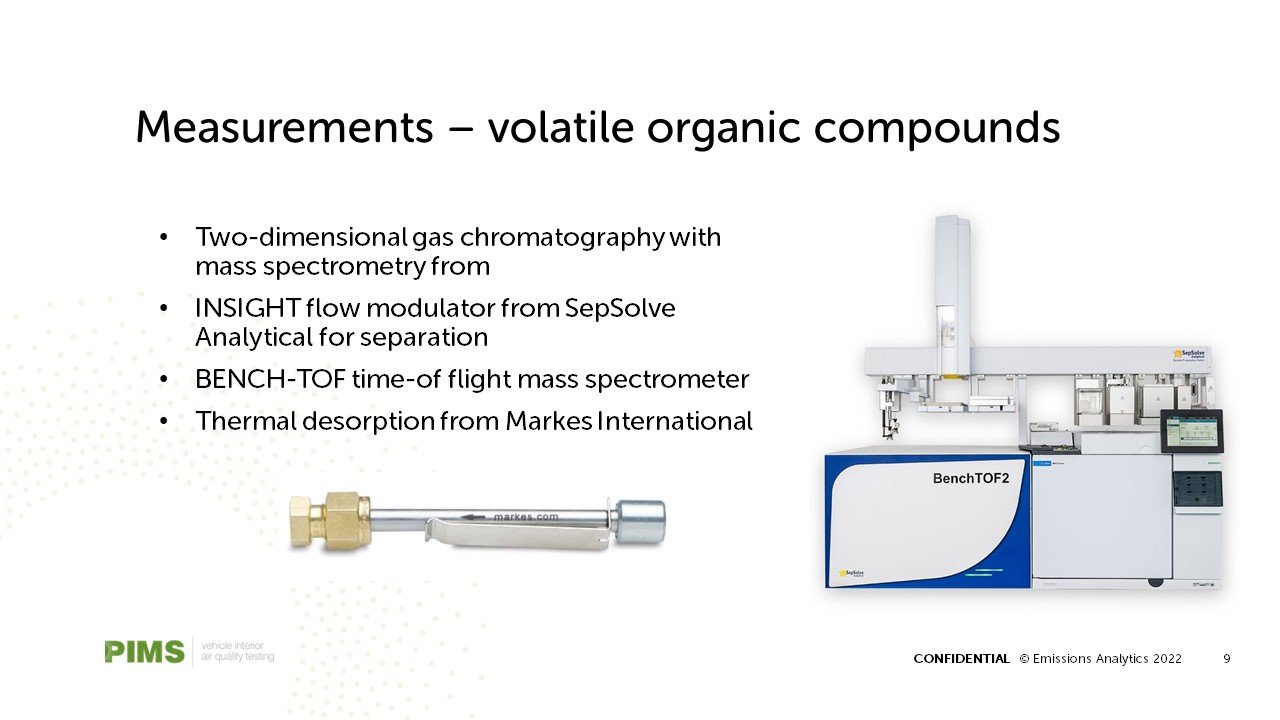
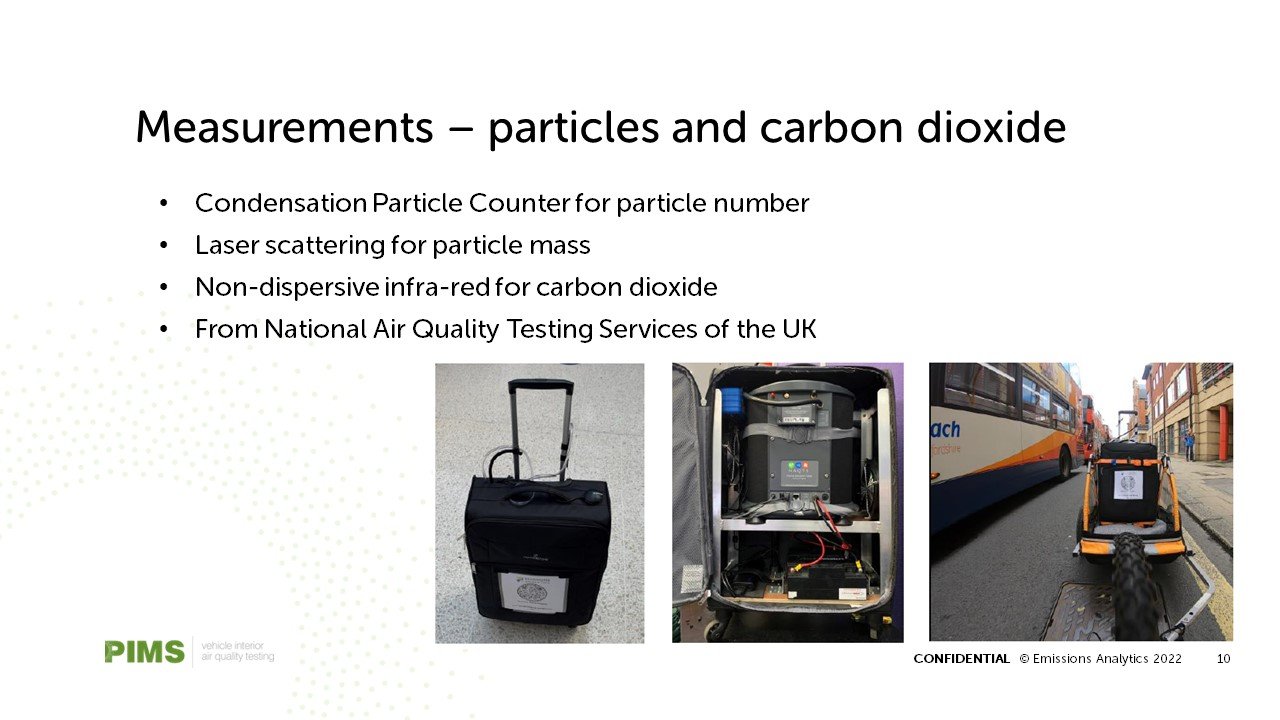
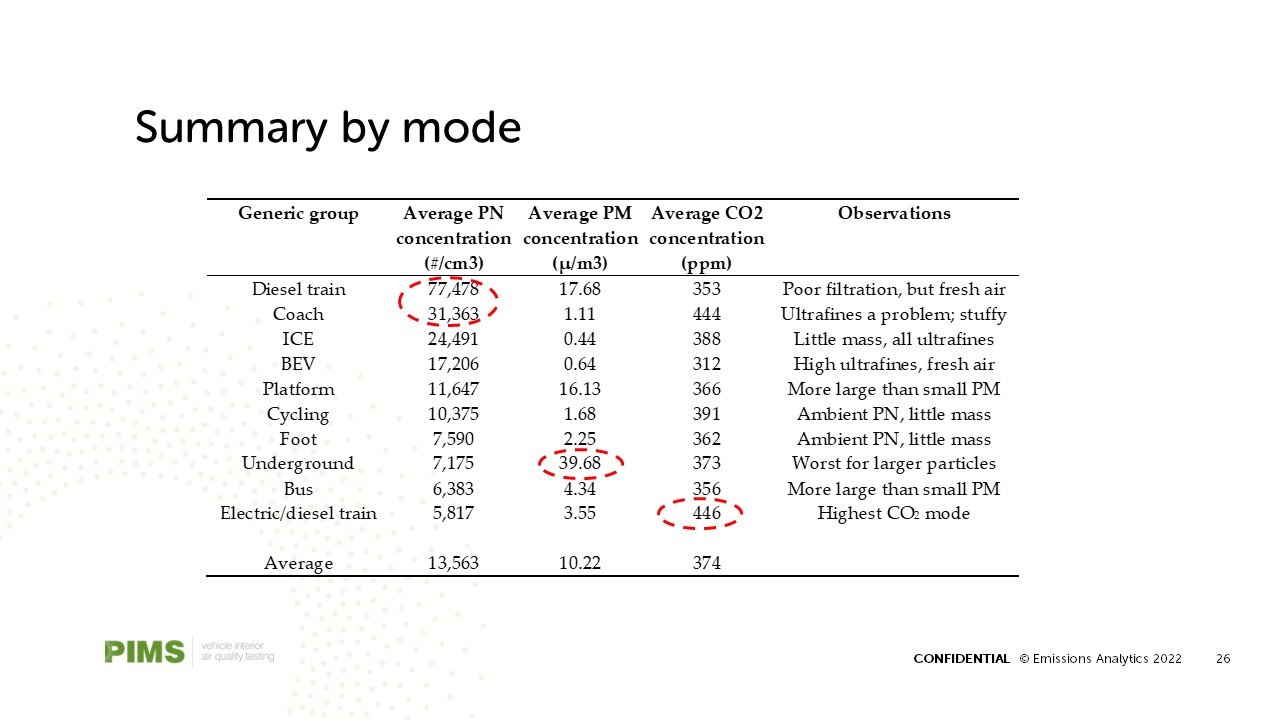
Personal exposures were tested in real-world conditions across nine different transport modes on journeys, covering active travel, public transport and private cars. Such exposures are relevant to questions of traveller comfort, safety in the context of airborne diseases such as Covid-19 and a growing awareness of health, safety and productivity effects of interior air quality. Pollutants measured were particle number, particle mass, carbon dioxide and speciated volatile organic compounds, using devices carried on or with the traveller.
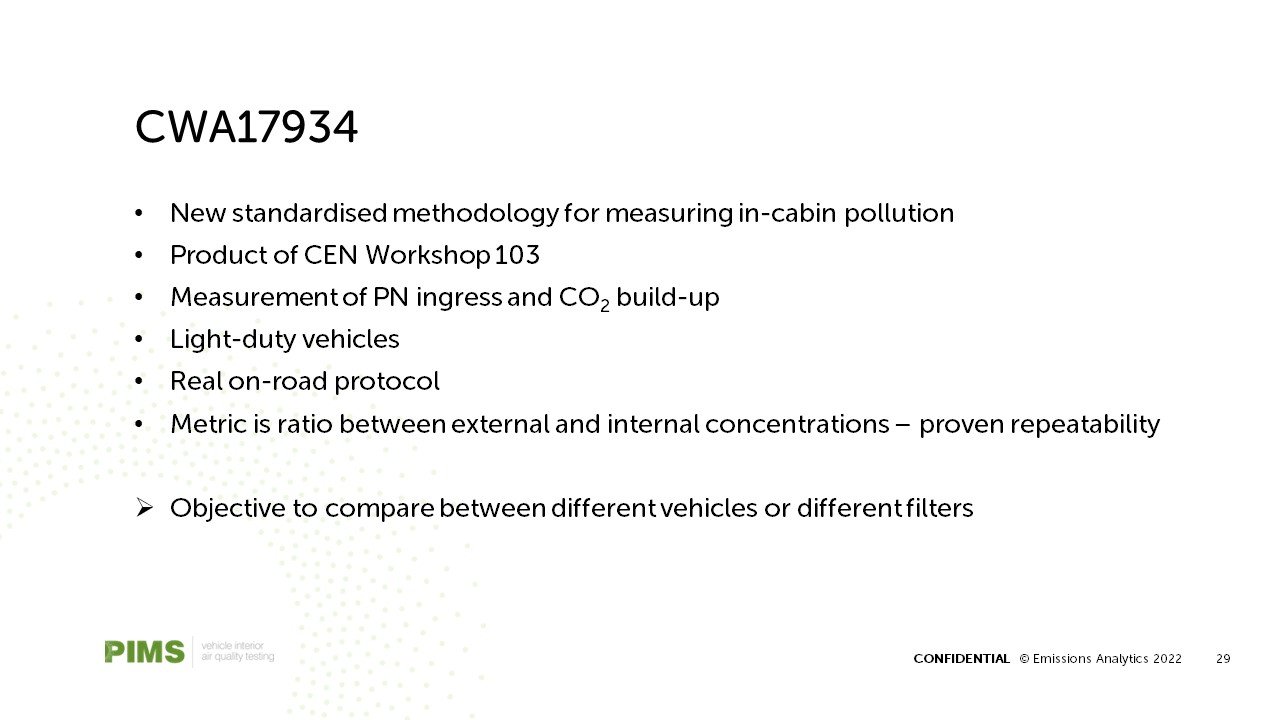
The results will reveal the most and least polluted methods of transport, and the likely sources of the pollution. Further, the dynamic nature of pollution will also be shown, to quantify when total exposures are mostly driven by short, larger spikes rather than persistent lower levels. The findings are intended to feed into the growing body of work around vehicle interior air quality, including the new CEN standardised methodology, CWA17934.


The circular economy
Reusing, recycling, repairing and sharing are defining hallmarks of a circular economy idea that is being promoted worldwide, but especially in Europe.
Zero-emission vehicles are zero-emission because they are
Reusing, recycling, repairing and sharing are defining hallmarks of a circular economy idea that is being promoted worldwide, but especially in Europe. It is not surprising that Europe leads the way, not through altruism, but for good economic reasons, as many key materials for a growing economy become scarce or expensive. Europe lacks deposits of many of them, but also makes it uneconomic to extract or refine them for industrial use.
But while resource reuse is logically and economically plausible, other aspects of environmental policy are circular in a less attractive way. Especially since Dieselgate, arguments between different shades of opinion as to the future of battery electric vehicles (BEVs) and internal combustion engines (ICEs) have become so raw, antagonised by ad hominem attacks. Yet, there are rarely disagreements between the sides on the underlying facts

Everyone knows that carbon dioxide (CO2) emissions are affecting the climate;
And that no vehicle is truly zero emission;
That BEVs are highly energy efficient, but batteries have low energy density;
That ICEs have poor efficiency, but compensate with high energy density fuels;
That BEVs reduce lifetime CO2 by ~50%, but this varies greatly by location;
That full, non-plug-in hybrids reduce CO2 by up to 30%, but that isn’t enough;
That battery and motor materials are scarce and often located in risky places;
That processing materials take lots of energy and creates local pollution;
That renewable electricity is mostly intermittent, increasing its real cost; and
That all vehicles create pollution, whether tyre wear or in their construction.
So, if there is a broad based of factual agreement, why the emotionalised debate?
We would propose that reason is that transport policy is suffering a bout of “a priorism.” This is typically defined as the systematic refusal to count anything as evidence against the truth of a purportedly empirical statement. Put another way, the argumentation for electrical vehicles is, like a green economy, circular. By defining BEVs as zero-emission in the European fleet average carbon dioxide (CO2) regulations, the answer is being assumed in the question. Therefore, BEVs cannot – despite any evidence to the contrary – be anything other than zero-emission. Even though, by common consent, they aren’t really.
It’s a form of cognitive dissonance – the mental anguish that arises when two beliefs contradict one another. BEV advocates know rationally that there are emissions from the manufacture of their vehicles, yet maintain that they are zero emission, because that is how the regulation defines them. Such internal conflict leads to anxiety and, from there, calm, rational discussion become difficult. As a psychiatrist explained: “If competing values, beliefs, attitudes, etc are not resolved or integrated, it greatly inhibits the ability of groups to have constructive dialogue, making it difficult, if not impossible, to arrive at a satisfactory compromise.” With the heavy emotional investment in beliefs on all sides, positions have become entrenched.
Why go on about this? Firstly, decarbonisation is an extremely important issue now, with global temperatures rising. Second, we need be sure that products that promise CO2 reduction do deliver in practice. Third, selfishly, Emissions Analytics aims to bring about a better understanding of real-world emissions through independent testing, to inform better policy and decision-making. While we are snagged on a logical fallacy, however, no amount of real-world testing is going to help move the debate forward. As Just Stop Oil protestors are literally stuck, we are stuck in an argumentative loop.

Defining BEVs as zero-emission was no accident by authorities. A further deliberate act has been not to designate other technologies such as renewable or synthetic fuels as zero-emission in any circumstances. Even if an innovative liquid fuel were created by green electricity and sequestering CO2 from the air, it would still create CO2 when burnt in the vehicle, and so would, officially, be as bad as the equivalent fossil fuel. By ignoring upstream emissions, BEVs get a double benefit: the upstream negative emissions of alternative fuels are ignored just as the upstream positive emissions of BEVs are.
To the argument that incorporating anything outside the official certification test in emissions targets is too difficult, consider the credit given to ‘eco-innovations’. Under the current European certification regime, eco-innovations are novel technologies that produce real-world CO2 reductions beyond what is measured on the certification cycle.
Each eco-innovation must prove its efficacy through a test programme, following technical guidelines from the European Commission. There are also various qualifying rules, such that the benefit should be at least 1 g/km, the technology should contribute only to the safety or performance rather than the comfort of the vehicle, and must not depend on driver behaviour. In short, the European Commission has designed and legislated for a system that complements the core CO2 targets, where real-world benefit can be proven. Under the eco-innovation rules, the maximum benefit a vehicle could be given was 7 g/km in its type approval CO2. Synthetic fuels, theoretically, could achieve up to 100% reduction in CO2, yet there is no equivalent system to recognise their value. The best we have so far is that the Commission has been mandated to prepare a report on the possibilities by 2026. These fuels are, it should be noted, being pushed through the renewable fuels directives, which does foster the industry to some extent, but it does not help manufacturers meet their fleet CO2 targets, so makes no difference to the incentives to produce and sell BEVs.
Therefore, we can conclude that the absence of a mechanism to credit or punish upstream emissions is a choice by governments and regulators. So long as this is the case, there is no technology that can compete with BEVs except hydrogen. In fact, a hydrogen fuel cell vehicle powered by ‘grey’ hydrogen – hydrogen created from natural gas using steam methane reformation without capturing the greenhouse gases made in the process – would be counted as zero-emission, while a synthetic fuel created with clean electricity and sequestering CO2 from the air would be as bad as a fossil fuel, despite the former being very dirty and the latter clean. This is clearly not an effective or honest route to maximum CO2 reduction, but that is the choice being made.
It is important to strike a note of caution about alternative fuels, however. Creating synthetic fuels is highly energy intensive and so cannot be scaled to make a sufficiently big difference until we have plentiful, cheap low-carbon electricity. Fuels made from renewable feedstocks such a used cooking oil to create replacement diesel such as hydrogenated vegetable oil (HVO) are subject to limited supply of the feedstock, as well as the conversion also requiring energy.
The optimal approach would be to offer an allowance for these fuels in the fleet-average targets, but subject to two important tests. First, provenance would need to be verified to make sure what was being sold was genuine – with the pressure on feedstocks, fraud is a real possibility. Second, the chemical composition of the feedstocks may lead to new or increased tailpipe emissions. This is where Emissions Analytics has been developing cutting-edge techniques using two-dimensional gas chromatography and time-of-flight mass spectrometry. This allows the almost complete chemical profiling of both the fuels and the exhaust gases produced.

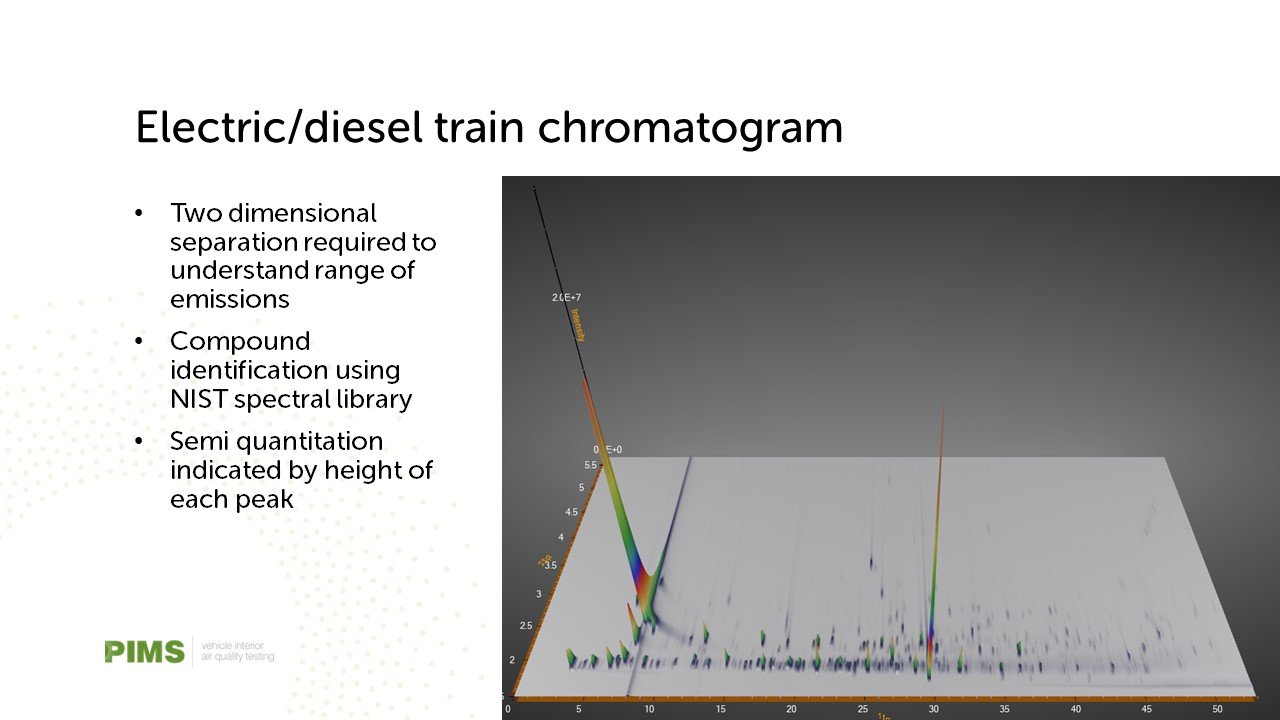
A fuel fingerprint is shown in the chromatogram above. In short, the plot depicts hundreds of distinct organic compounds, separated in two dimensions, approximately to the molecule size and electrical charge. The intensity of the colour represents the prevalence of the compound. Taking HVO, as an example, any fuel sample can be compared to a reference HVO fingerprint. In a recent project, four different HVO products were purchased in the marketplace and subjected to this fingerprinting. Three of these matched well, with an average of 342 organic compounds, of which just 0.1% were aromatics (often carcinogenic) and 0.8% oxygenated (containing oxygen atoms). One of the fuels deviated significantly, with 522 compounds, of which 13.2% were aromatics and 14% oxygenated. The dissonant sample was shown to match standard B7 diesel closely, which led to the conclusion that standard diesel with little or no HVO added was being passed off as HVO to customers.
Burnt in the engine, these fuels of different chemical composition may well lead to different exhaust emissions, and some of those emissions might not be regulated. For example, when E10 gasoline was introduced, the concern was that the oxygenates from the added ethanol would lead to more acetaldehyde emissions, which are not directly covered by the Euro regulations. Emissions Analytics’ on-road testing can measure individual species of volatile organic compounds (VOCs) at the tailpipe, for example its EQUA programme shows that the average formaldehyde emissions from standard diesel is 0.32 mg/km.
As this demonstrates, it is possible to validate the low-emission credentials of these fuels, and so there is no reason not to incorporate them into the CO2 target system and Euro 7 pollutant emissions limits. The latter would require only a small step beyond the current proposal in order specifically to target species such as formaldehyde and acetaldehyde from light-duty vehicles.
While the European Commission considers its 2026 renewable fuels report, BEVs will continue to enjoy a legislated advantage. In many respects they are excellent products: quiet torque and cheaper operation, especially for city dwellers. Their market share will likely continue to grow, and would probably even continue to grow without the current lavish subsidies, as some car buyers value them highly. They do not, however, suit many real-world needs, or suit them as well as ICE vehicles; and they are definitely not zero-emission, whether for lifecycle CO2 or tyre wear emissions. Yet, when governments perform their Net Zero calculus, there is only one powertrain realistically available as the solution. BEVs will always win. But that is not a surprise – the answer was in the question.
Until the question is corrected, we will continue to live in an anxiety-inducing state of cognitive dissonance. Maybe this suits certain interested parties, as the different sides slug it out, with no prospect of changing the result. But maybe a more effective, healthier, happier approach would be to consider properly the real-world emissions of the various decarbonisation options and to unleash competition and innovation. A corollary of that would be that we would realise that there are no zero-emission options currently, and there will never be until the grid is decarbonised and expanded. Instead, we could have a sensible discussion about accelerating wind, solar, nuclear and any other available, scalable alternatives, to clean the grid as soon as possible.

Until then, we can perhaps best summarise this situation by cannibalising Henry Ford’s statement that a customer, “…can have a car painted any colour that he [sic] wants so long as it is black.” So long as key materials are scarce and expensive and the electricity grid remains dirty in most places, a multi-lane, multi-technology, multi-fuel approach would be more robust. We need every conceivable innovation to reduce greenhouse gas emissions. But what the current fleet targets mean is that you can have any car you like, as long as it’s fully electric.

Deft landing, captain
Euro 7 has finally arrived - As the saying goes, a ‘good’ landing is one from which you can walk away, but a ‘great’ landing is one after which they can use the plane again. Euro 7 has not just landed safely, but the craft that is the European system of emissions regulation remains viable. It required a deft touch. The industry says it is too tough and environmental campaigners say it is too weak in equal measure, which perhaps reflects the achievement.
Euro 7 has finally arrived
As the saying goes, a ‘good’ landing is one from which you can walk away, but a ‘great’ landing is one after which they can use the plane again. Euro 7 has not just landed safely, but the craft that is the European system of emissions regulation remains viable. It required a deft touch. The industry says it is too tough and environmental campaigners say it is too weak in equal measure, which perhaps reflects the achievement.
It could have so easily have been otherwise. Of course, there will be arguments around the pollutants included, boundary conditions and limit values – and some reservations will be expressed below. Where it could have gone badly wrong is if these pollutant regulations had been hijacked as an ersatz greenhouse gas emissions regulation. It is not the role of the Euro regulations to take a position on carbon dioxide (CO2) or other climate change gases, but rather to ensure that whatever is on the road does not emit excessive air pollutants. Equally, it could have erred by taking a line disproportionate to the costs and benefits of air pollutant reduction, with the intention of making particular technologies – in this case, internal combustion engine (ICE) and hybrid vehicles – uneconomic. There must always be a proportionality in pollution abatement to achieve the optimal outcome.

Looking at the big picture, it is important to be clear where most air pollution from road transport now comes from. It is mainly from old cars, not new ones. Euro 7 can only affect the cars of the future, not fix the issues of regulatory failure and industry behaviour of the past, as illuminated by Dieselgate. It would be a highly sub-optimal approach to make new cars disproportionately clean to offset the disproportionate excesses of the past. This would seriously impair the new car market leading to owners keeping the older, dirtier cars on the road longer. Where pollution does arise from new cars, it is not from diesels. Not only do nitrogen oxide (NOx) emissions across all diesels from the introduction of the on-road Real Driving Emissions (RDE) regulation average just 43 mg/km on Emissions Analytics’ independent real-world testing, many are now well below 20 mg/km. This is two-thirds below the new limit proposed for Euro 7. Further, the market share of diesel passenger cars is below 10% in many countries, even counting mild hybrids, so the aggregate effect of diesels is small. Rather, gasoline vehicles make up around two-thirds of new car sales in most developed countries, a proportion of which have elevated ultrafine particle and volatile organic compound (VOC) emissions, which will be addressed to some extent by Euro 7.
Tackling pollution from older vehicles, which has such an important bearing on overall emissions, has two main strands. Where it is right for Euro 7 to play a role is in the durability requirements on the car manufacturer, which Euro 7 extends to up to 200,000 km and 10 years from new for each vehicle. During this period, vehicles must meet the emissions limit at certification, with some allowances for deterioration. To be effective, surveillance and remediation must be actively applied. In parallel with this, countries run local ‘periodic technical inspection’ programmes to check vehicles in the field. Enhanced programmes have been introduced in countries such as the Netherlands. Using particle number counters at inspection centres can spot compromised particle filters effectively. Similar test could also be applied to NOx emissions to detect issues with Selective Catalytic Reduction (SCR) – aka AdBlue or DEF – systems. So, Euro 7 is tightening the durability requirements, and must ensure proper surveillance, but it cannot be expected to police all cars on the roads in every country.
Setting aside issues of the geriatric decline of vehicles, there remain two big contributors to air quality problems. First, almost all ICE vehicles before 2009 had no particle filter and therefore still contribute to ambient PM2.5 exceedances. As they continue to age, this problem is likely to get worse through component degradation, only offset as those vehicles finally depart the car parc in growing numbers. The second, more vexatious, problem is those light-duty diesel vehicles from 2009 to 2019 which had real-world NOx emissions multiple times the limit value. For example, the average NOx emissions for pre-RDE Euro 6 vehicles is 418 mg/km, or 5.2 times the 80 mg/km limit (but recall that the 43 mg/km for the later Euro 6s!). Despite software recalls on certain models since Dieselgate, the problem remains widespread as almost all manufacturers generated exceedances. Euro 7 cannot play a role in the second problem as it is an outstanding legal one, but it could have made the first problem worse by impairing the new car market and the natural updating of the vehicle parc.
So, Euro 7 has deftly avoided being drawn into areas it was not designed for. Not only does that avoid the distortions that would have arisen, but it leaves the integrity of the system intact – notwithstanding the flesh wound of pre-RDE Euro 6. It has also made the overdue leap towards technology neutrality, as it should always have had, to avoid behavioural distortion. This means that Euro 7 will be seen as a serious and relevant regulation internationally, and it has also set the stage for future regulatory stages for electric vehicles with the inclusion of the template for limit values for brake and tyre wear emissions. The introduction timetable should also be noted: despite the delays in announcing the Euro 7 proposals, the introduction will be relatively swift, which is valuable to draw a close to the sickly mutant that is Euro 6.
Turning back to the specific questions of the pollutants included, boundary conditions and limit values, we can offer a perspective from Emissions Analytics’ testing. Quite rightly, an N2O limit is excluded from the passenger car proposals as our real-world testing on both gasoline and diesel vehicles has shown it to be a relatively small problem. The widening of the boundary conditions – for example to require compliance in a wider range of conditions, such as up to ambient temperatures of 45 degrees Celsius – goes hand-in-hand with the tightened limit values. In short, both are tightened a couple of turns, but for most manufacturers these should not present a big hurdle. On most pollutants, the latest vehicles are well below the proposed limits, whether it is the diesel NOx emissions stated earlier, of the average real-world carbon monoxide (CO) emissions of 158 mg/km on new gasoline vehicles compared to the Euro 7 limit of 500 mg/km. The proposed ammonia (NH3) limit of 20 mg/km should be easily met as our testing shows results typically in the 5-15 mg/km range already. The widened boundary conditions add to the challenge, but evidence is that existing exhaust treatment in the form of particulate filters, SCR systems and oxidation catalysts can be calibrated to handle.

Does this mean, therefore, that Euro 7 will unfold smoothly? In the short run, it probably will, but it sets the scene for the coming battles which will be primarily around ultrafine or nanoparticles, and VOCs from multiple sources on vehicles. Euro 7 expands the measurement of tailpipe particles including those with a diameter as low as 10 nm, compared to 23 nm previously. As a result, this will bring in tiny, semi-volatile particles that have previously been hard to measure repeatably. On VOCs, the passenger car regulation includes a limit for non-methane hydrocarbons (NMHC) and well as total hydrocarbons (THC). The heavy-duty regulation goes further as includes formaldehyde (CH2O), a known carcinogen.
A tension in the Euro 7 proposal is that, while more tailpipe nanoparticles are being brought in scope, for brake and tyre wear emissions only a mass-based standard is being proposed. This will mean that nanoparticles from brakes and tyres will effectively be ignored, as they are large in number but almost mass-less. For the same reasons that tailpipe nanoparticles are being carefully regulated, so should those from brakes and tyres. However, the inclusion of brake and tyre wear at all is a significant step forward – a starting rather than end point.
Euro 7 should also be more specific on the VOCs that it intends to regulate. First, VOCs are a wider set than just the hydrocarbons currently covered. Second, VOCs form an unbounded set of compounds with significantly different environmental and health effects. These effects including the primary health effects from direct exposure, as well as the propensity of them to form both ground-level ozone and second organic aerosol particles – both significant air pollutants. Grouping them together may make measurement is easier, but much less effective. As Emissions Analytics has previously shown, it is now possible to measure a wider range of these VOC species in real-world conditions. Beyond the tailpipe, attention must also be paid to the VOCs that off-gas from vehicle tyres and what VOCs may leach out into water and soil as tyre particles settle. Whatever the source, models have been developed to estimate the “ozone formation potential” (OFP) and “secondary organic aerosol” yield (SOA Yield) from emitted VOCs. In a recent paper by Wang et al, ten different VOCs were studied inurban Shanghai. For OFP, the range was from 1.09 to 15.11, where these values were the ratio between the ppb of ozone produced fromthe same ppb of the VOC. The highest OFP was from ethene and the lowest 1-butene. For SOA Yield, the range was from 0.05 to 4.01, measured in µg/m3, with the highest being toluene and the lowest 1,2,4-trimethylbenzene. Therefore, the ratio of effect from the highest to lowest within just these ten compounds was 14 for OFP and 80 for SOA. This is why the speciation of VOC measurement is vital for air quality control, rather than relying solely on the aggregated NMHC or non-methane organic gas (NMOG) values.
Finally, it is only one more step then to consider the pollutants accumulating inside vehicles, as we have discussed in previous newsletters. Here, again, it is primarily a question of nanoparticles and VOCs – the former entering from pollution outside, and the latter off-gassing from interior materials. To standardise measurement of particle ingress, the Comité Européen de Normalisation (CEN) has recently published a new method, CWA1793, which was initiated by the AIR Alliance and to which Emissions Analytics contributed test data.

In summary, Euro 7 has neatly tightened the regulations where necessary, tidied up most of the problems of Euro 6 and set the platform for future emissions regulation from vehicles, rightly taking a more holistic approach. Applied well, it could ensure fair competition between types of powertrain, stimulate a healthy new car market to freshen the parc, and avoid storing up unintended consequences of electrification. It makes initial, but important, steps towards a greater focus on nanoparticles and VOCs. Whether that leaves ICE vehicles as a generic class with any future will rightly be determined not by Euro 7 but by the fleet-average CO2 targets and primarily legislation around permitted vehicle types. Maybe Euro 7 will deliver an important message to those other legislators: define the environmental objective and not the means, and let the automotive market weave its magic.

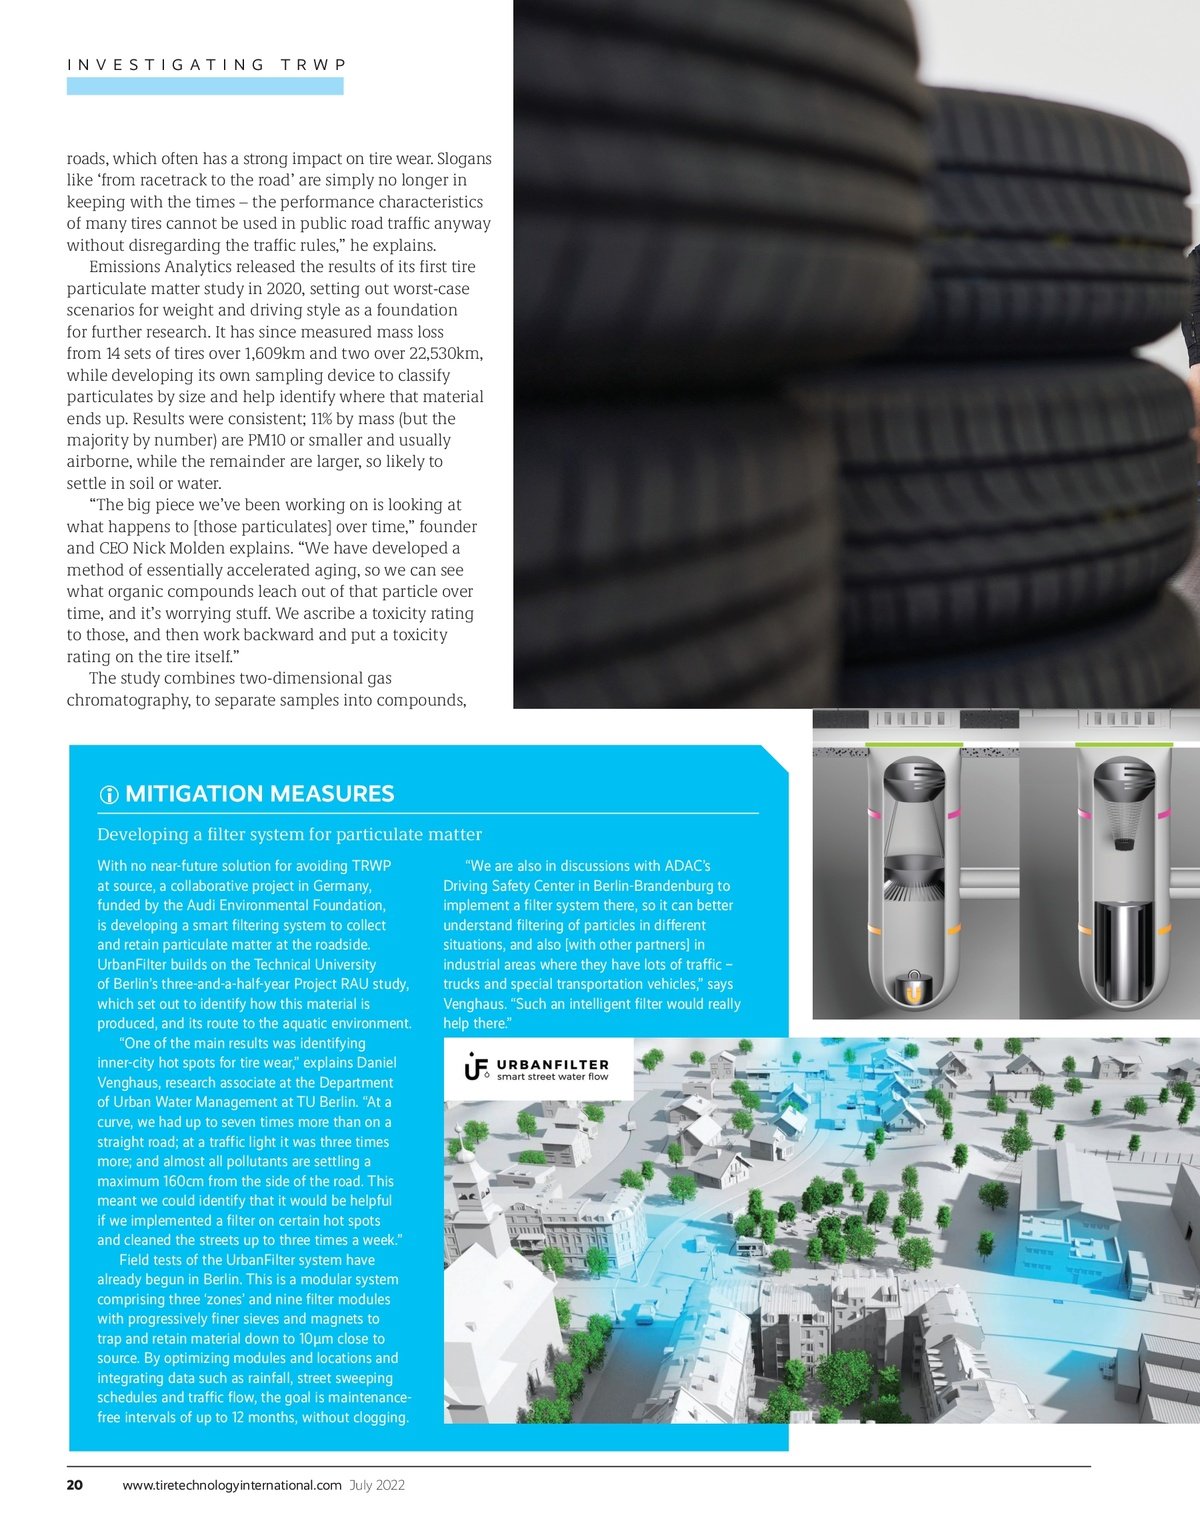
Following the tyre tracks… Where do tyre emissions go?
We know, from earlier research, that tyres emit lots of particles, both coarser and the more potentially dangerous ultrafines. To put this in context, the levels are less than from exhausts of many older diesel vehicles without filters, but orders of magnitude greater than from the exhausts of modern internal combustion engine vehicles with the latest filters. But, where do these particles go, and can they be found in the environment?
We know, from earlier research, that tyres emit lots of particles, both coarser and the more potentially dangerous ultrafines. To put this in context, the levels are less than from exhausts of many older diesel vehicles without filters, but orders of magnitude greater than from the exhausts of modern internal combustion engine vehicles with the latest filters. But, where do these particles go, and can they be found in the environment?

As a consequence of the size distribution of particles in tyre wear, as set out in our earlier newsletter, it is reasonable to believe that the particles go to air, soil and water. Some tyre particles will be directly deposited on the road verge or in rivers near roads, but the smaller ones will settle further away after a period of time. The tyre particles contain on average over 400 organic compounds, plus a range of metals. Together, this makes for a complex product that is emitted into the environment in many different ways.
Compare this with tailpipe emissions. While there are many volatile organic compounds in exhaust fumes, the pollution is dominated by carbon dioxide (CO2) and nitrogen oxides in modern vehicles, with some carbon monoxide and ultrafine particles. Therefore, the environmental impact is dominated by a small number of compounds almost all of which are suspended in air for an extended period.
The differences between tyre and tailpipe emissions presents an interesting paradox: as tyres are more complex, they may leave a more easily identifiable fingerprint in the environment. If we take an air sample and observe some CO2, it is impossible to ascribe that to a source, whether vehicular or from human exhalation. Even with NOx, it is impossible to say whether that comes from a car, truck, home heating or an industrial source. In contrast, if we find some benzene‚ 1‚2‚4-trimethyl- in river water, for example, there is a fair chance it originated from tyres. Seeing multiple compounds in the environment that we know can come from tyres only increases that confidence. The very complex nature of tyres means such a fingerprint can be left. In contrast, for tailpipe emissions, we have to fall back on constructing ‘inventories’ – look-up tables containing average values – to characterise what emissions come from different types of vehicle, derived from testing those vehicles, and often combined with activity data.
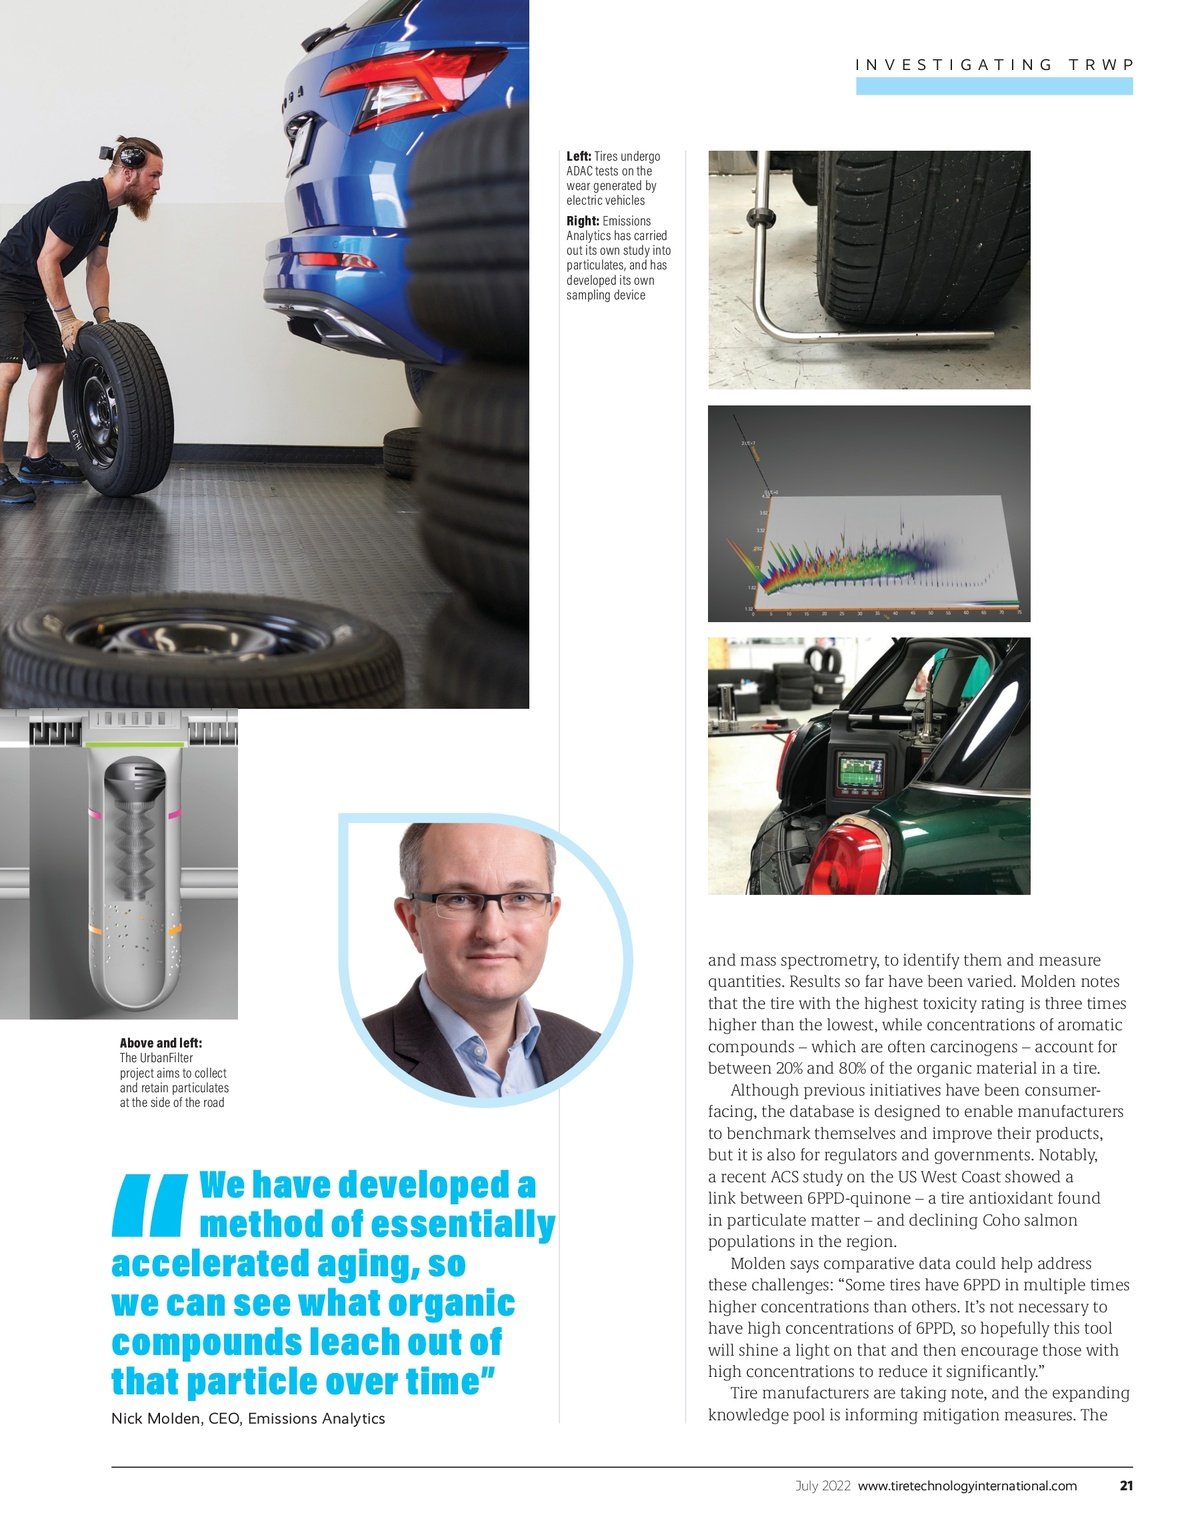
Although it took many years of work, researchers in the US were eventually able to link the death of significant numbers of coho salmon, and latterly also trout, to the chemical preservative 6PPD in tyres. This was covered in our earlier newsletter, 'Fishy'. Therefore, it is complex, but possible, to determine the original source of pollutants or causes deleterious effects observed in the environment. How can this approach be generalised?
Emissions Analytics has compiled a database of organic compound profiles of hundreds of different tyre models, drawn from over 40 different brands. To achieve this, we have developed a highly optimised analytical pyrolysis method to understand as closely as possible the compounds in the original tyre. This method uses a two-dimensional chromatography system to separate the compounds, which are then identified and quantified using a time-of-flight mass spectrometer. From this, the chemical fingerprint of an ‘average’ tyre can be determined by taking the mean concentration of each compound across all the tyres analysed.
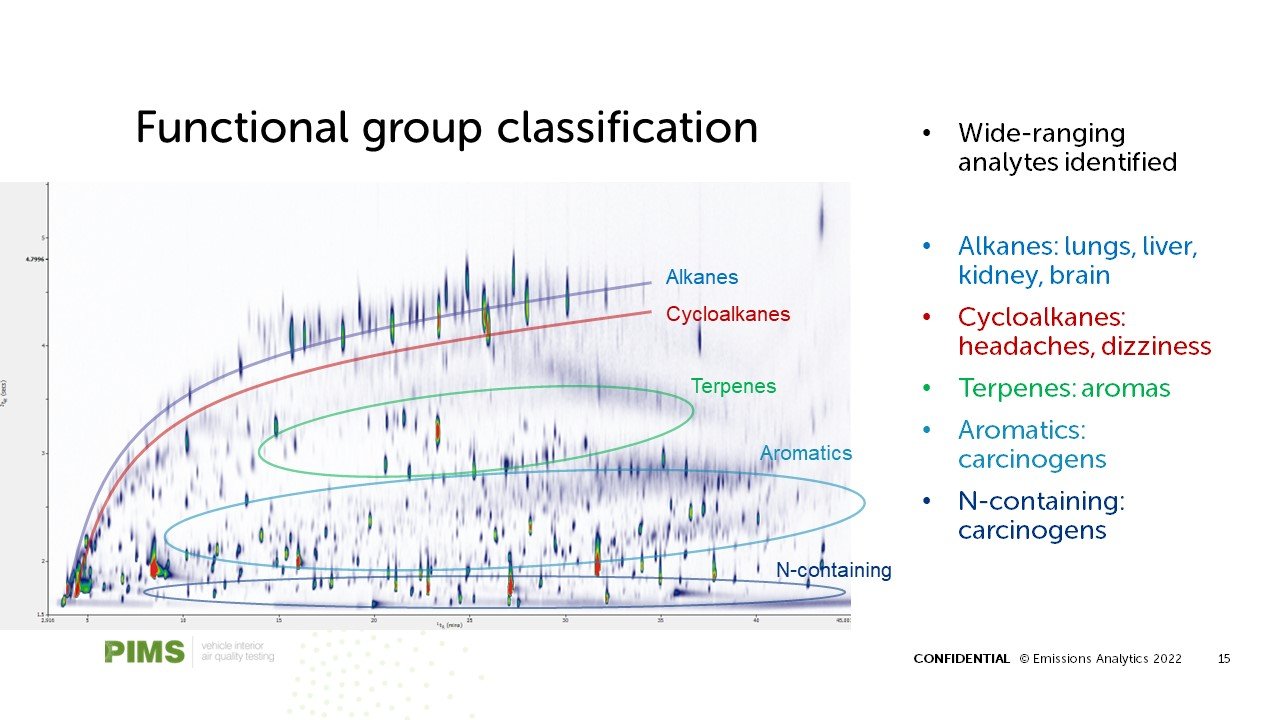
Taking a real sample, we can see how this fingerprinting might work. A water sample was taken from an undisclosed body of water that was believed potentially to contain contaminants or leachates from tyres. It was analysed by ‘solid-phase microextraction’, which essentially involves dipping a thin fibre into the water, which extracts the compounds within. A blank sample of water should show no organic compounds on the chromatogram. Analysis of the sample in fact identified 115 organic compounds, many at the parts-per-billion level. The chromatogram is below, which shows compounds across a wide area and, consequently, many different functional groups.

From this we can conclude that there is very likely to be contamination in this water sample. However, how confident can we be that it comes from tyres?
To assess this, we can aggregate the individual compounds represented by the peaks on the chromatogram into functional groups based on their chemical properties: acids, alcohols, aldehydes, and so on. From an environmental and health perspective, the aromatics group is the most concerning as they are often carcinogenic. The esters and terpenes functional groups represent the least concerning compounds, and are most commonly fragrances and flavours. To estimate the prevalence of each group, the area under the peak on each compound is taken, and expressed as a percentage of the total peak area across the whole chromatogram. This gives a chemical profile of the water sample. This can then be compared with the concentrations of chemicals in the Emissions Analytics’ database, averaged across all the tyres tested, in nanograms of target chemical per milligram of sample. The chart below then compares these measures of prevalence between the water sample and the reference database.

The most striking element is the peak of aromatics, which gives good evidence that it is chemicals from tyres that are present in the water. The biggest difference is in the terpenes, principally limonene, which are generally not water soluble and therefore float, so are likely to have been under-sampled. As well as the similar aromatic peaks, there are similar absences of acids and esters between the two samples. The presence of some compounds from the aldehyde and alkane groups suggests the presence of a low level of non-tyre pollution as well in this water sample. Overall, this is a simplified version of what is possible, as more granular functional groups, and even individual compounds, can be used in the fingerprinting.
The same essential approach can be applied to identify tyre wear compounds in soil. Previous research typically identified a small number of organic ‘tracer’ compounds and then used one-dimensional gas chromatography and mass spectrometry (GC-MS) to measure those tracers in the environmental sample. In a recent paper in Chemosphere, ‘Determination of tire wear markers in soil samples and their distribution in roadside soil’, styrene-butadiene rubber (SBR) was used as the tracer, together with thermal desorption and GC-MS, to quantify the distribution of tyre wear at different distances from the roadside. In a further paper in Critical Reviews in Environmental Science and Technology from 2022, ‘Tire wear particles: An emerging threat to soil health’, the use of traditional tracers such as 2-(4-morpholinyl) benzothiazole and hydrogenated resin acids was mentioned, but indicated the need for new and better markers that do not easily leach into water, and are resistant to heat and light exposure. The approach to fingerprinting water samples using two-dimensional gas chromatography and a fingerprinting database may provide that way forward.

Less has been done so far on looking for ultrafine tyre particles in air. Almost by definition, there will be low mass concentrations of tyre particles in air, due to their small size. This is likely to underestimate the potential health effects of such particles, due to their large relative surface area, and the potential for transporting other pollutants, such as VOCs, deep into the human body. This remains, however, work in progress without definitive conclusions. For now, Emissions Analytics is collecting particles as they are shed from tyres in real driving environments. Inevitably, such collection gathers some proportion of non-tyre particles, such as from brakes, road wear and resuspension. The same essential fingerprinting process is being used to estimate what that proportion of non-tyre ‘interference’ in a sample is.
In short, while tyres are highly complex products, containing hundreds of different chemical compounds, the latest analytical techniques present the opportunity for more sophisticated fingerprinting techniques compared to traditional tracer analysis. The tyre tracks can now be followed to understand the ultimate fate of tyre wear in the air, soil and water, and indirectly the effect on human and animal health.

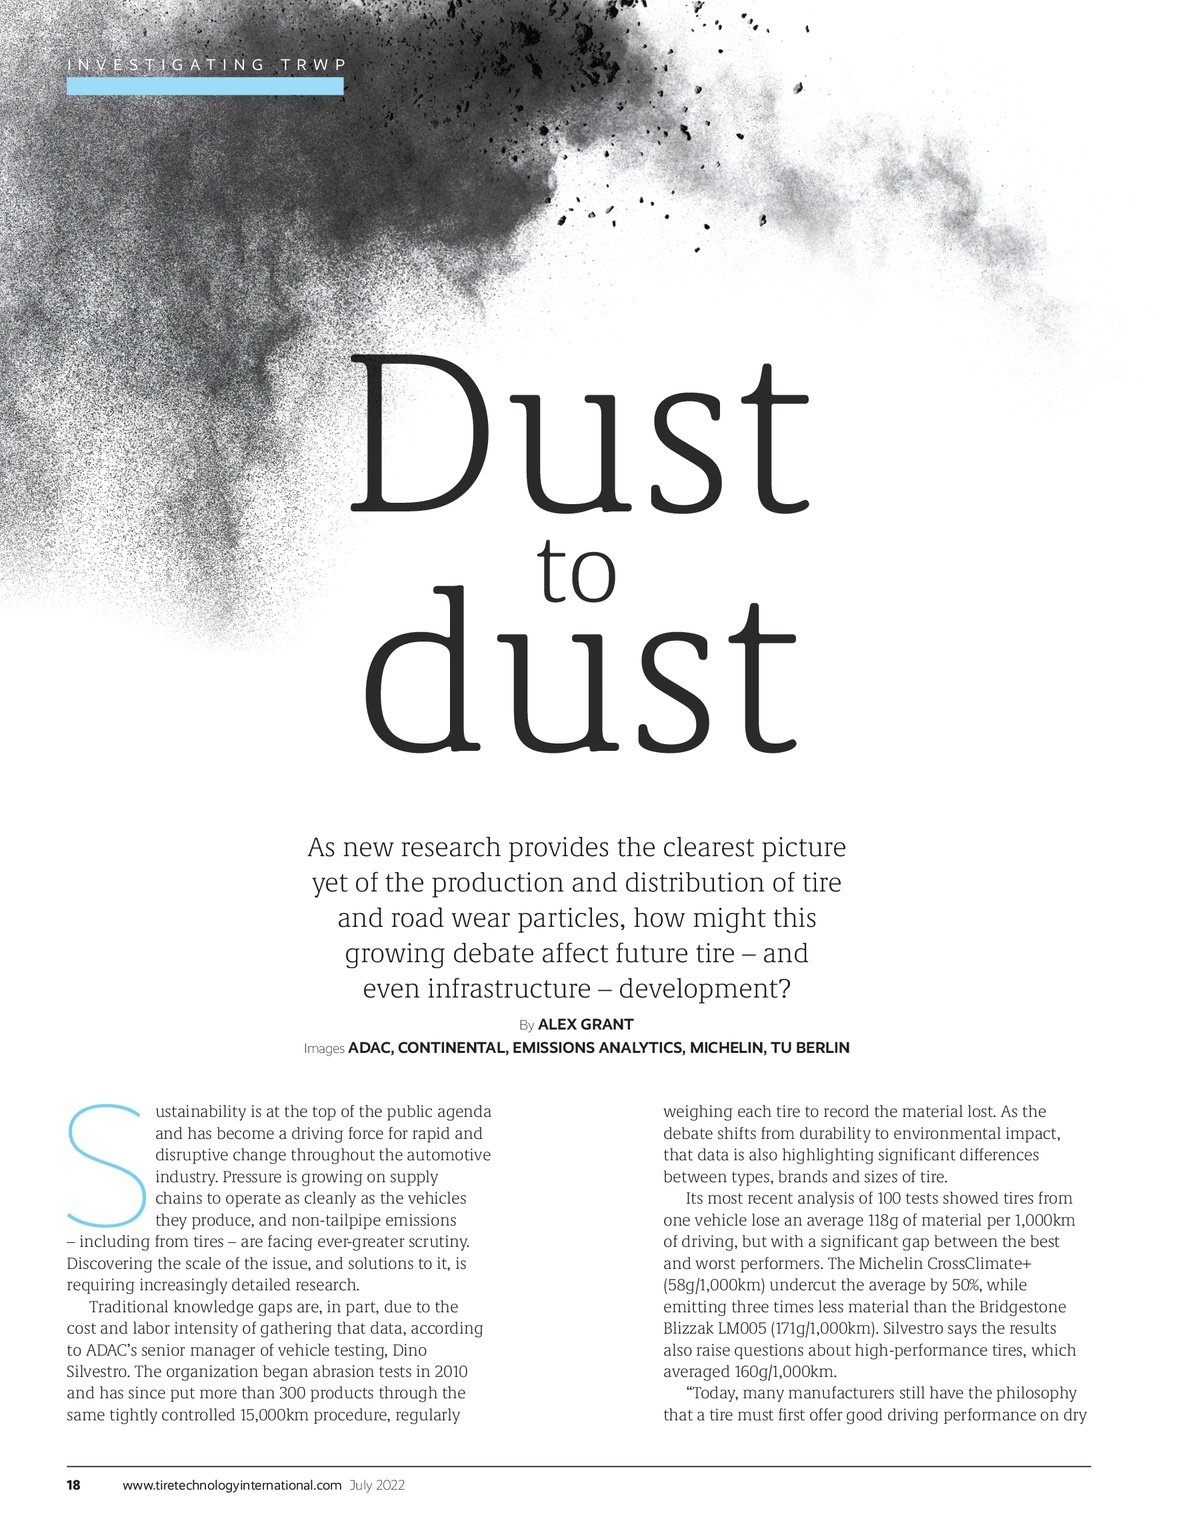
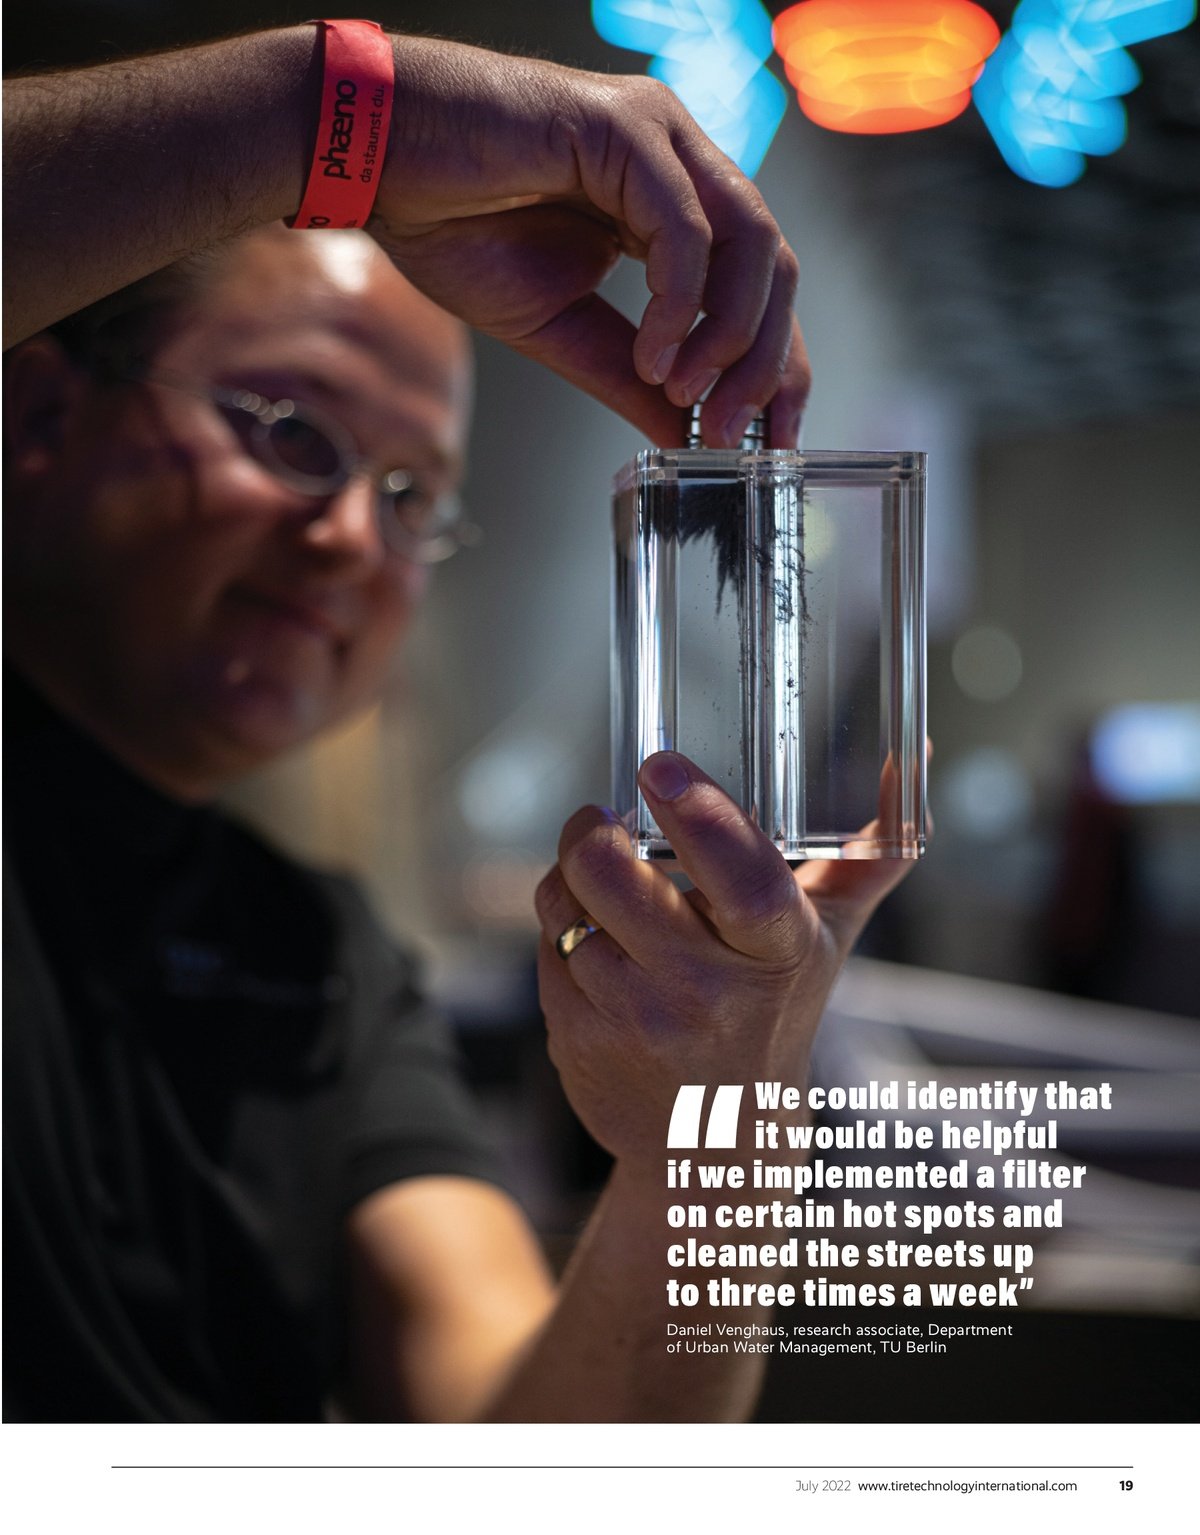
Emissions Analytics featured in Tire Technology International
Emissions Analytics featured in Tire Technology International
Nick Molden interviews with Tire Technology on Emissions Analytics new tyre wear research.
Click the link below to view the edition or scroll below for the interview.


The light duty vehicle to nowhere
The evidence clearly points to using full hybrid electric vehicles (FHEVs) as the best route to rapid, low-risk decarbonisation of cars and vans for the next decade. FHEVs cannot deliver the biggest aggregate reduction in principle, but with scarce battery resources and higher manufacturing carbon dioxide (CO2) emissions of battery electric vehicles (BEV), FHEVs can deliver more CO2 reduction now, and potentially for some time to come.
When will the battery electric vehicle consensus break?
As regular readers of Emissions Analytics’ newsletter will know, the evidence clearly points to using full hybrid electric vehicles (FHEVs) as the best route to rapid, low-risk decarbonisation of cars and vans for the next decade. FHEVs cannot deliver the biggest aggregate reduction in principle, but with scarce battery resources and higher manufacturing carbon dioxide (CO2) emissions of battery electric vehicles (BEV), FHEVs can deliver more CO2 reduction now, and potentially for some time to come. As the evidence for this is strong, yet the argument is losing traction, we wanted to explore the paradox.

Perhaps the answer is that – for now – BEVs work for everyone. The buyers are early-adopters, excited by the prospect of an iPad-on-wheels. Industry is embracing the opportunities for disruptive innovation, competitive advantage and reputational gains, encouraged along by the incentive to avoid fleet average CO2 fines. Environmental groups, broadly, are taking the position that fewer private vehicles are desirable, but, to the extent they are needed, at least BEVs are 'zero emission.’ Governments are appreciating an apparently simple policy position to reduce climate change, solve air quality and extinguish the smell of Dieselgate in one go.
Reviewing the facts, let us look at the data, all from Emissions Analytics’ independent testing and modelling:

References:
1. Super Size EV Automotive's obesity crisis
2. Schrödinger’s Car
3. Cutting pollution and improving public health
4. The septillion particle problem (literally)
5. Gaining traction, losing tread Pollution from tire wear now 1,850 times worse than exhaust emissions
These figures are based on facts today for the developed world, rather than future scenarios and projections, except for a forward trajectory of decarbonisation of the electricity grid, which is a highly likely trend despite Europe reopening coal power stations for this winter. The conclusion can only be that it is a mixed scorecard: BEVs cut CO2 emissions by 19% compared to FHEVs (and by more than half compared to traditional ICE) at the price of being bigger, heavier and more expensive, plus some elevated non-exhaust emissions such as tyre wear. Even though they are non-zero, hybrid emissions are all substantially under the regulatory limits. Furthermore, the table does not include the utility limitations of BEVs, and the increasing danger to other cars in accidents, owing to the mass.
Ordinarily, such a mixed scorecard would lead to a mixed market of BEVs, FHEVs and internal combustion engine (ICE) vehicles, where the needs and means of different buyers are matched to the available products. If pollution externalities were also internalised through appropriate taxation, that market could also reach an efficient equilibrium. Currently, however, policy is simply seeking to ban alternatives to BEVs based on a false ‘zero emissions’ promise.
The issue is not just that the emissions reductions of BEVs are not as big as billed, but that most people will not be able to afford BEVs at these prices. In 2022, prices have gone up owing to inflationary pressure on battery materials. The suggested BEV:ICE price parity point of $100 per kWh was meant to have been reached by now, but has been put back to mid-decade at least. More widely, average real incomes in the developed world are under pressure. So, this policy is likely to price people out of cars. Maybe this is the point?
One hypothesis to consider is that policy makers are fully signed up to the argument that private transportation is the main source of environmental ills, and therefore must be curtailed. Groups such as the European Institute of Innovation and Technology Urban Mobility Initiative say, “We want to see a massive shift. We want fewer cars”. While this may be beneficial in congested and networked cities, it is harder to argue elsewhere. For those against cars on principle, not only could higher purchase prices be welcome, but also range anxiety, usually billed as a negative, may actually be a good thing if it reduces vehicle miles driven, helped out by insufficient charging infrastructure. FHEVs do not fit the mould because they are not zero emission, have no range anxiety, and they are hardly more expensive that traditional ICE vehicles, so do not discourage private driving.
Taking the policy argument further, reducing private transportation may also ameliorate problems of congestion, and the associated pressure to spend on road expansion. Increasing public transport usage would go some way to resolving the economics of buses and trains, which have always been a challenge outside of dense urban centres, and which were rendered dire as a result of Covid. In this way, some governments are attracted by anti-car arguments of certain interest groups.

In support of this hypothesis, consider the proposed Euro 7 emissions regulations. Why is so much effort and priority being put into a regulation for making pretty clean tailpipes a bit cleaner? It is inevitable that the effects of the regulation will be to make ICE vehicles more expensive, and close the price gap with BEVs. Even setting aside hybridisation, if we were serious about getting rapid emissions reductions, the unequivocal number one policy objective would be to get older ICE vehicles replaced with the latest ICE models, which have much lower emissions. Making new vehicles more expensive impedes this process.
The alternative hypothesis is that cheaper BEVs will come to the market to maintain mass private mobility. Such cars, with lower price premia over equivalent ICE vehicles, are already coming to market, such as the MG range. Other manufacturers, such as Volvo, are making rapid shifts towards all-electric ranges, while new entrants such as BYD are arriving. What is common between many of these is that they are Chinese owned – MG by SAIC and Volvo by Geely. China’s current powerful position in mining and refining battery and electric motor materials, together with its lower labour costs and state subsidies, allows it to price vehicles at a level that rivals cannot match in the market. This competitive advantage is then being used to expand along the value chain into finished car manufacturing and assembly, branding and sales. By the time developed countries have built their mining and refining infrastructures, China is likely to have captured a significant proportion of worldwide automotive economic value, finally usurping Europe, the US and Japan’s historical leadership in engine and hybrid technology. It is even quite likely that most of this infrastructure will never be built, as the competitiveness of China in part rests on its willingness to pollute air, soil and water through its manufacturing more than would be acceptable elsewhere. In this case, visibility of and control over the supply chain and, by extension, product lifecycle CO2 emissions would be restricted, so targeting it meaningfully would be difficult.
So, when it comes to the choice between curtailing private mobility and ceding significant economic value to the Chinese, the current BEV consensus may start to fall apart. Even then, some will prosper. Premium European manufacturers may be able to make more profit, even on lower sales volumes, by going up-market with highly innovative eco-flagships. Those of significant personal means or without the need to travel for work, may find the lower level of economic activity and congestion attractive. Governments may be happy if air quality targets are met. But the general population, reliant on private transportation for day-to-day life, may find themselves colliding with their governments. What feels like a win-win BEV policy now, may rapidly turn into a lose-lose for Europe.
Looking at the latest new car sales figures in the UK, there is evidence of what the revealed preference of the car-buying public might be. The share of FHEVs has risen to 11.6% over the last six months compared to 9.9% in the previous period, while the BEV proportion fell to 14.1% from 16.4%, despite on-going retail subsidies and hidden subsidies through emissions regulations. However, the trend is quite variable, and this is more likely to be just a pause, with all the investment by manufacturers into BEVs and the large pipeline of products about the hit the market.
Ultimately, there is only one way really to solve the greenhouse gas emissions problem: nuclear energy as substantial baseload electricity on top of which cheap and clean, but intermittent, wind and solar power can prosper. When you have a world economy and society built on the plentiful energy of fossil fuels, the only way to transition away is to an alternative plentiful fuel supply. As we need to do it as quickly as possible, we can only use existing nuclear fission technology, although this includes innovations such as small modular reactors. If we do this, many options become possible, that can compete in the market against one another: green hydrogen, synthetic liquid fuels, ammonia, methanol, battery vehicles, and so on.

While we scale up the nuclear energy industry, which will take a few decades, it may be simpler and more effective to taxi gasoline and diesel more, to compensate for as much of the environmental externality as possible, consistent with preserving widespread private mobility. Pushing for BEVs is an expensive way to discourage travel, with a huge deadweight cost of forcing a largely unnecessary change in powertrain. It also sets up future geopolitical grief, as powerful fossil fuel interests are swapped for powerful mining and refining interests. However, for a while, governments will like the policy because it paints a simple, compelling net-zero story – until their electors realise the actual costs and consequences.
Emissions Analytics will continue to bring independent data to inform this evaluation, updating it as new information arises. We are neither pro nor anti bicycles, walking, horses, skateboards, flying, biofuels or Hummers in themselves. What we are in favour of is actually reducing emissions, rather than virtuous noise. Yes, there is a value to policies that are simple to communicate, but not if they do not work.

Smellovision - Engineering odours in cars
Passenger cars are intricately designed products. Their impact on the environment is similarly intricate and complex. We are now moving decisively beyond the age when the dominant impact was exhausting burnt fossil fuel directly to the air.
Passenger cars are intricately designed products. Their impact on the environment is similarly intricate and complex. We are now moving decisively beyond the age when the dominant impact was exhausting burnt fossil fuel directly to the air. For modern internal combustion engine (ICE) vehicles, tailpipe emissions have been dramatically reduced even where fossil fuels are still combusted. Further reductions are potentially within reach with synthetic fuels and increased hybridisation.
In contrast, other emissions are increasing – not just relatively, but absolutely. Vehicles are becoming bigger and heavier, leading to greater manufacturing emissions, in-use tyre wear emissions and end-of-life disposal or recycling costs. Possibly the least understood trend among car buyers is how environmental concerns are impacting the air quality in the vehicle cabin as new and innovative materials, treatments, glues and fragrances are deployed. While tailpipe pollution entering the cabin has been studied by Emissions Analytics and others, the interaction of the volatile organic compounds (VOCs) from these new interior materials is complex. However, doing so is important, as these VOC can hang around in the confined space of the vehicle cabin to be inhaled, and can have impacts on aspects from comfort to human health.

The most obvious manifestation of this problem is bad smells in cars. While Western car buyers tend to like the ‘new car smell’, Asian buyers are less keen. Removing this new car smell has, therefore, been the focus of regulations in Japan, Korea and other countries. The reason for this is that due to different physical sensitivities to certain VOCs commonly found in car materials. But it is not just about the new car smell, as hundreds of VOCs are present in the cabin and they interact in unpredictable ways, which can generate unexpected ‘off odours’. As traditional materials are swapped for new ‘eco’ or other alternatives, or seat covers are treated with less toxic chemicals, or the vehicle is constructed with more glues rather than rivets, the challenge and risks of bad smells grows. Further, deliberate science is put by manufacturers into creating desirable, on-brand, odours.
Emissions Analytics is actively developing new methods to design, describe and manage the olfactory contours of vehicles on sale today, and to understand the interaction with the ventilation system to create maximum consumer comfort and minimise any health impacts. To achieve this, we have taken controlled samples of the air inside a wide range of vehicle cabins and then subjecting the samples to two-dimensional gas chromatography and time-of-flight mass spectrometry analysis to profile the VOCs present in depth. Our laboratory has been provided by Markes International and SepSolve Analytical. This method is significant as it allows almost complete separation of the VOCs present, unlike more basic methods that cannot separate the higher molecular weight compounds, which are often the most potentially deleterious. Even with good separation, identification of the compounds is a challenge as many are not present in the standard spectral libraries. To resolve this, Emissions Analytics has compiled its own specialist library.

Historically, this sort of odour analysis has been performed by highly trained human ‘noses’. This has the advantage of directly gaining the human experience, with all that complexity and subjectivity. This remains important as just knowing all the chemicals present does not necessarily mean the human experience can be predicted. However, where a bad smell is detected, the analytical method provides a way of diagnosing and resolving the problem in a way that a human cannot necessarily do.
It should also be recognised that off odours do not necessarily correlate with a negative health impact on the human occupants of a vehicle, nor does the absence of any bad smell guarantee there is no impact. Even where a known toxic chemical is found in a vehicle, it may not be at a concentration that causes an actual negative effect. Concentration and exposure time are important added dimensions. The levels of VOC exposures were studied in 2019 of taxi drivers in Barcelona – a group of vehicle users for whom prolonged exposures are an issue. Given these considerations, Emissions Analytics has been actively contributing to the CEN Workshop 103 that aims to standardise a method for measuring vehicle interior air quality, which will be published soon. Being able to measure the freshness of air in the cabin will make possible the estimation of VOC exposures.
Looking at the initial testing from a range of interiors, it becomes clear that the VOC soup differs significantly between different manufacturers and of vehicles of different ages. The table below summarises the findings, including a ‘toxicity potential’ rating. This is calculated by combining the concentrations measured by Emissions Analytics and information from the European Chemicals Agency database of compounds and their hazard statements. The rating is a unit-less measure designed for comparative assessment of vehicles. As can be seen, Vehicle #1 has the highest rating, almost four times the average of the five vehicles, and around 28 times greater than the lowest potential toxicity vehicle, Vehicle #4

With an average of over 800 compounds identified, this demonstrates how rich a mix the air in a car can be, and the complexity of the task to separate, identify and quantify them. The total concentration of organic compounds is split into four functional groups, from alcohol (generally the least problematic) to polycyclic aromatic hydrocarbons (PAHs) and nitro-aromatics (with the highest incidence of carcinogenic effects). The alkane and aromatics groups are generally the most prevalent and are often associated with solvents, glues and plastics used in vehicle construction. Vehicle #1 stands out in these respects, whereas Vehicle #3 – low in other respects – is relatively high in PAHs and nitro-aromatics.
Among these compounds, many are common between vehicles. Across these five cars, the most prevalent ten compounds, with their concentrations and a descriptions, are shown in the table below. These pumped samples were taken after the vehicle had been soaked overnight in controlled temperature conditions. The third compound, octanoic acid‚ 2-propenyl ester, is associated with a pineapple aroma in the vehicle.

Beyond these, the individual characteristics of a vehicle tend to be made of some specific, high-concentration compounds and then a long tail of low-concentrations ones. Taking the toxicity potential score, beyond the top ten common compounds above, the highest rated compound in each vehicle is shown below.

This confirms that Vehicle #1 has a greater potential issue than the other vehicles, but the approach demonstrates that the compounds causing this can be identified and their contribution quantified. In this way, the manufacturer can diagnose the problem and consider how to alter the construction of the vehicle to mitigate. This may require substituting materials or methods, but, in doing so, new interactions of chemical compounds need to be assessed as well.

In summary, with ICE vehicles achieving much lower tailpipe emissions and the increased uptake of hybrid and electric vehicles, the impact of non-exhaust emissions is of growing concern for human health and the environment. This means it is now important to obtain a comprehensive view of all possible sources of VOCs from vehicles, including emissions from materials, such as foam, carpeting and seat covers, as well as those generated through tyre wear.
The recent global push towards a circular economy has also meant that automotive manufacturers are being urged to improve the sustainability of their operations by increasing the use of recycled or renewable materials, such as innovative plant-derived plastics. Robust quality control is essential to ensure these novel products will not produce volatile emissions that could be considered harmful or malodourous. Therefore, is not just about vehicle design to create a particular aesthetic, but also for hazard reduction and risk management.
However, the sample complexity, as well as an ever-expanding list of compounds of concern, makes it a challenge for those responsible for performing sampling and analysis. This has led to a need for innovative new methods to be created for complete emissions characterisation. Emissions Analytics is leading through its new laboratory and contribution to standardising measurement methods, with the aim of reducing the overall environmental emissions of future vehicles.

Fishy
Not since the Chevrolet Corvette Stingray or perhaps, more recently, the Citroen Nemo, have cars and fish been so closely associated. But this time it is not branding, but rather the pollution of one by the other.
Not since the Chevrolet Corvette Stingray or perhaps, more recently, the Citroen Nemo, have cars and fish been so closely associated. But this time it is not branding, but rather the pollution of one by the other. That laws are not being broken should be stated up front, and hopefully this will spare us the term ‘Trout-gate’, but nevertheless we need to consider the rapidly emerging evidence linking tyre wear emissions to serious effects on marine wildlife.
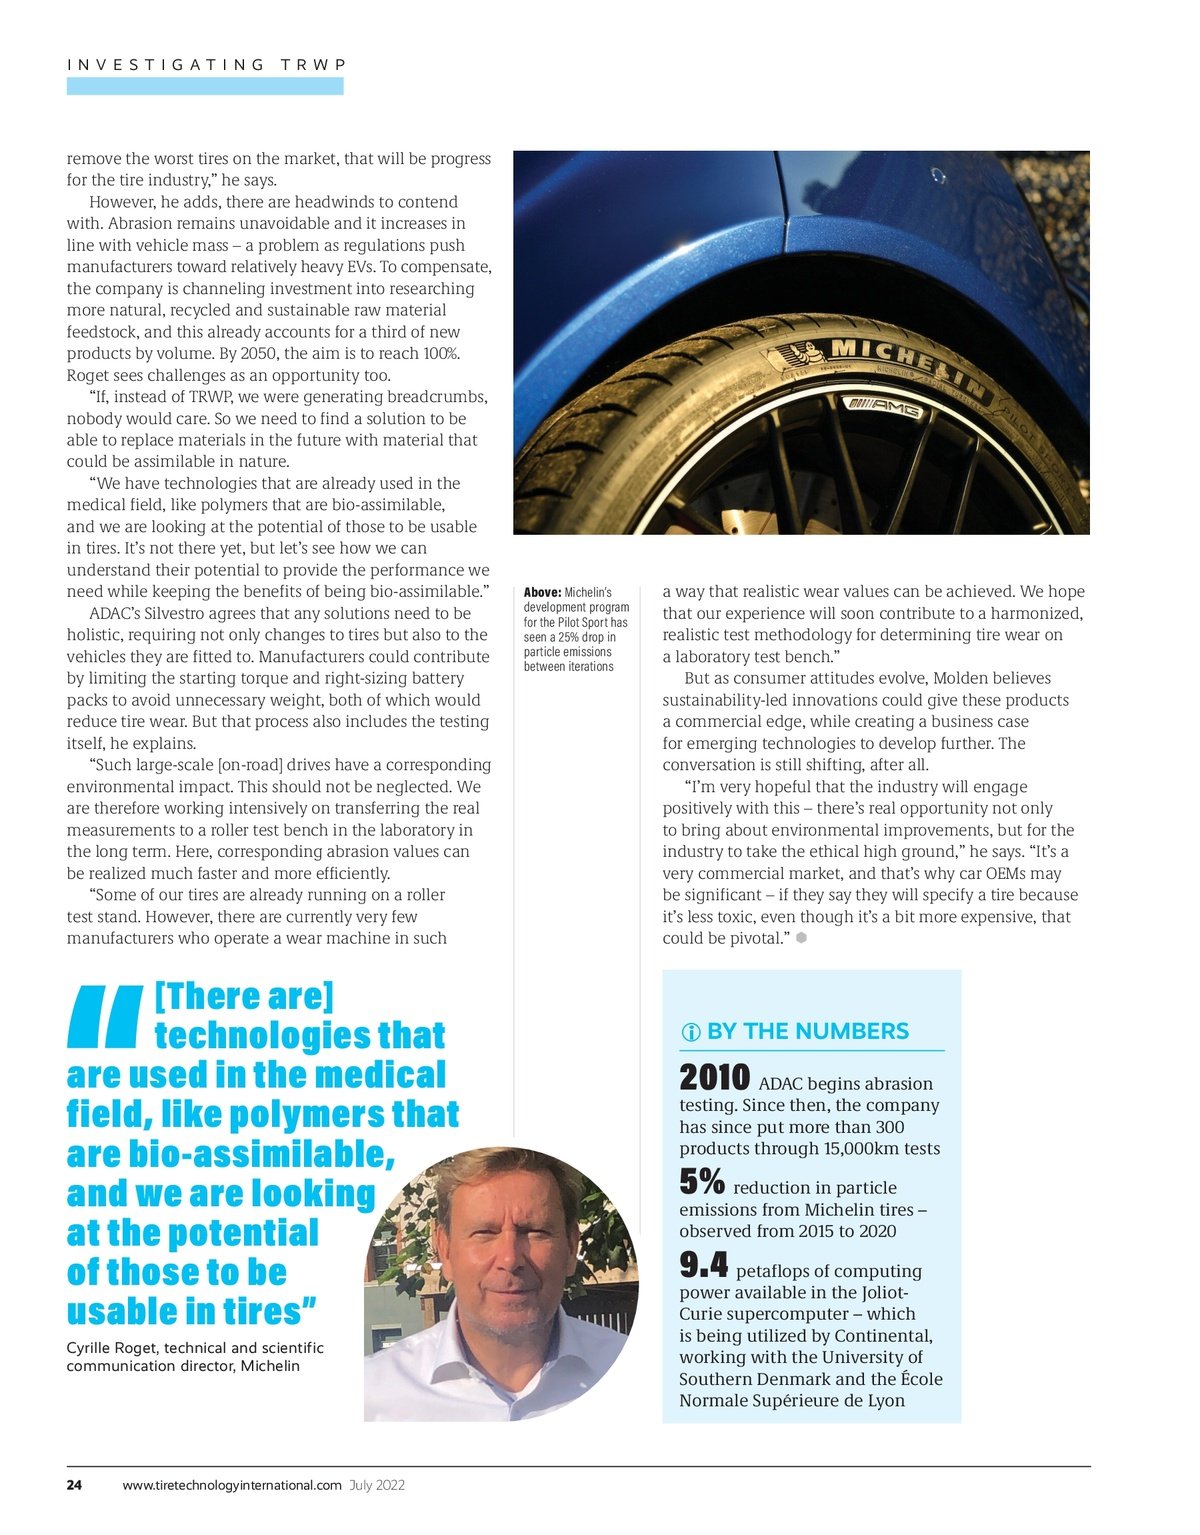
Emissions Analytics, in previous newsletters, has evidenced the magnitude of tyre wear emissions, in both mass and number. Many have rightly asked why, if these emissions are so high, has it not been an issue before – which is a good question. An answer is that, until very recently, tailpipe emissions have been high – especially for nitrogen oxides, of Dieselgate fame – and manufacturers have been pursued by authorities and car owners in many states around the world. There are few rules regarding tyre wear emissions, but it is the move towards battery electric vehicles (BEVs), which are typically around 40% heavier than standard internal combustion engine (ICE) vehicles, and which can lead to significantly higher tyre wear, that has brought the issue into focus.

While that has been going on, academic research has been able to link the effects of a chemical in tyres to certain fish populations. A ground-breaking article in Science in 2020, linked a common preservative in tyres – N-phenyl-N'-(1,3-dimethylbutyl)-p-phenylenediamine, commonly known as 6PPD – to unexplained acute mortality when adult salmon migrate to urban creeks to reproduce. Adding 6PPD to tyres prevents hardening and cracking – which can impair durability and safety in operation. 6PPD reacts with ozone in the air to produce 6PPD-quinone, which is the specific compound measured in waters off the US West Coast. However, it was noted, this is unlikely to be an affect unique to coho salmon, or indeed this geographical location.
A more recent study, published in 2022, looked at species of trout, char and sturgeon, and concluded that 6PPD also has toxic effects on both rainbow and brook trout, while the other species were apparently unaffected. More concerning is the potential reinforcing effects when combined with other ambient chemicals, as analysed in this 2022 paper in Science of the Total Environment. The study looked at the effects on population growth of 6PPD and salt on the Brachionus calyciflorus freshwater herbivore. The presence of salt, which could come from road treatment, was found to amplify the effects of 6PPD on these organisms.

These effects matter not just because of the direct impact on wildlife, but also due to the economic effects. Declining populations of salmon and trout may well have detrimental effects on fishing industries. In 2019, commercial landings of coho salmon in the US totalled approximately 12 million kilograms and were valued at more than $30 million, according to NOAA Fisheries. Around 95% of the US coho salmon harvest comes from Alaska, where the impact of declining fish stocks on the livelihoods of the local population could be significant. Rainbow trout production for food in the US is around 27 million kilograms, with about three quarters coming from Idaho. Revenues generated are typically over $70-90 million per year.
As the academic evidence has accumulated, Emissions Analytics has been building a detailed database of the organic compounds in hundreds of new tyres on the market. The test equipment and method has been described in previous newsletters. As a result, we are now able to start quantifying the potential release of such chemicals, which can then provide a baseline from which policy could target their reduction. Before this can happen, however, it is necessary to evolve the traditional association of vehicle emissions with air quality, to a wider concept of the effect of vehicle emissions on the environment more generally – most importantly on marine and soil environments. This is essential if we are not to underestimate the effects of tyres.
While the most common in tyres, 6PPD is not the only preservative available. Potential other compounds are 7PPD (N-(1,4-dimethylpentyl)-N'-phenyl-p-phenylenediamine) and IPPD (N-Isopropyl-N′-phenyl-1,4-phenylenediamine). Across the more than 200 tyres tested so far, we can see the prevalence of each of these compounds, as set out in the table below.

The concentration is the amount of the compound – on a toluene equivalent basis of quantification – as a proportion of the tyre sample mass, and is measured using two-dimensional gas chromatography and time-of-flight mass spectrometry on samples taken directly from new tyres. Although the method is highly sensitive – picking up compounds at concentrations as low as parts-per-trillion – there is a lower limit of detection and, therefore, where the compounds are reported as not present, the concentration may just be below that lower limit.
These results show that a small minority of tyres currently contain IPPD, whereas almost all contain 6PPD. While it is a reasonable hypothesis that 6PPD and IPPD are substitutes for one another, the correlation between their concentrations in this dataset is weak, apparently because other factors determine each brand’s approach to the use of preservatives.
Drilling down to the individual tyres and their manufacturers, we can see how concentrations and compound mixes vary between the five manufacturers using the smallest amount of IPPD as a proportion of their total use of preservatives, compared to the five using the most, as shown in the table below.

If the average concentration of 6PPD is multiplied by the average lifetime wear rate of a set of tyres of 37 mg/km, that is approximately 33 µg/km of 6PPD released by an average car. When that is applied across the roughly 250 million cars on the roads of Europe and an average distance of about 16,000 km per year, the total 6PPD potentially released annually into the environment is approximately 130 tonnes in Europe.
As a cross-reference for the plausibility of significant 6PPD being released in this way, another study from 2022 assessed the concentration and leachability of 6PPD and 6PPD-quinone in road dust collected in Tokyo, Japan. The widespread presence of these compounds was confirmed by their presence in all the samples collected. Concentrations were higher typically where there was more traffic volume, suggesting a strong dependency, along with a weaker dependency on seasonal conditions.
In the analysis above we have considered the environmental impacts of just two compounds in tyres. On average, across all the tyres tested, 410 organic compounds are identified per tyre, across functional groups such as alkanes, aldehydes, aromatics and polycyclic aromatic hydrocarbons. Therefore, there is significant further research to do to understand the potential effects of the multitude of other compounds in tyres. Furthermore, less than one quarter of the compounds are identified by the standard spectral libraries with a sufficient level of confidence, and consequently there is a significant number of compounds unknown to all except perhaps the tyre manufacturer itself.

Authorities and regulators and now looking at this area actively. The Department of Toxic Substances Control (DTSC) in California is proposing a regulation to list Motor Vehicle Tires containing 6PPD as a ‘Priority Product’. DTSC has determined that there is potential for exposure to 6PPD from these products and for that exposure, “to cause or contribute to significant or widespread adverse impacts.” A public consultation is ongoing. The UNECE together with the EU are now actively working on a standardised method for measuring tyre wear rates, which would be a natural precursor to wider consideration of the chemical composition of tyres beyond the few compounds currently limited under REACH.
In summary, with the growing ability to identify compounds both inherent in tyres and mixed into samples collected in the environment, it is possible that we will progressively find further links between tyre ingredients or derivative compounds and deleterious environmental effects. Emissions Analytics is continuing its work to test a wide range of tyres around the world and resolve the currently unidentified compounds. What we can be certain of today is that tyres – while all looking very similar – are made with recipes that vary significantly between products, and that the total material released each year is large, dwarfing the particulate matter released from the tailpipes of modern combustion engines, which Emissions Analytics also continues to track through its EQUA programme.
Emissions Analytics Featured on BBC Radio 4’s More or Less
Emissions Analytics featured on BBC Radio 4 on our tyre research.
On 22nd June 2022, Emissions Analytics featured on BBC Radio 4’s on our tyre research.
To listen to the research we have conducted on tyre wear please click on the link below and scroll to 19 minutes and 15 seconds.


Super Size EV Automotive's obesity crisis
Leading international vehicle emissions testing company, Emissions Analytics, today launches an innovative tyre database, the product of over two years of testing and evaluation.
The automobile has given society a major benefit in mobility, at the cost of an environmental impact which is now seen as unsustainable. There are now around 1.5 billion cars on roads around the world, coming in many shapes and sizes, and being put to a panoply of uses. While pollutant emissions have to a significant extent been solved on the latest internal combustion engined vehicles in developed economies, this is not true of the main global warming gas, carbon dioxide (CO2). To address this, battery electric vehicles (BEVs) are being pushed by a particularly vocal group of influencers, as if they are a panacea. Joining this call are governments from the world, which may make their takeover inevitable.
But: when the problem is the environment impact of mass mobility, we need to ask ourselves whether encouraging vehicles that are on average 39% heavier, 40% bigger and 44% more expensive to buy than normal gasoline internal combustion engine (ICE) cars is really the immediate answer.

The size issue is not confined to BEVs. Gasoline SUVs, of which there are over 200 million in the world, are 27% heavier than smaller, gasoline hatchbacks, as shown in the graph below. This shows how the kerb weight – i.e. the vehicle empty but with a full tank of fuel – averaged over all new vehicles on sale in Europe has changed over time. In our last newsletter, Gaining Traction, Losing Tread, we set out the issue of tyre wear emissions, which shows that weight matters for environmental pollution. The excess weight of BEVs is likely to lead to 8.6 mg/km of additional tyre particulate mass emissions, and gasoline SUVs an excess over hatchbacks of 5.3 mg/km, both above the total maximum permitted total tailpipe particulate emissions of 4.5 mg/km.

Looking at the trend in average vehicle weight in different categories over the last twelve years, collated from manufacturer data, we can see the clear rising trend for BEVs, as large SUVs have come to dominate a category that started with smaller hatchbacks and saloons. The weight of gasoline SUVs has stayed relatively constant, but market share has shifted in their direction.
Put in a longer historical context, European vehicles became almost 500 kg lighter in the decade after 1997 as small city cars proliferated and, further back, US cars became 400 kg lighter in the five years from the 1973 oil crisis. Therefore, a growing waistline is not predestined.
So, why are vehicles getting bigger and heavier? There are three reinforcing trends. First, consumer preferences appear to be shifting in favour of large, high-riding vehicles, with Europe catching up with earlier trends in the US. Second, more safety equipment and designs have been deployed in response to legislation and consumer pressure. The third factor is regulation, which has, perhaps unintentionally, accelerated the trend. In the US, larger pick-up trucks are exempt from the corporate average fuel economy rules, and there is a ‘footprint’ adjustment that gives easier targets for physically larger vehicles. In Europe, there is a similar adjustment to the CO2 targets, giving easier targets to heavier vehicles. More generally, the deployment of more exhaust after-treatment technology to meet ever-tighter pollutant emissions regulation has required more physical space on the vehicle and higher prices to maintain profit margins. In simple terms, CO2 emissions have been increased to serve consumer preference and air quality gains.
Along with the added weight of BEVs and gasoline SUVs comes greater physical size. The average BEV from the last five years is 44 cm longer, 9 cm wider and 33 cm higher than the average gasoline vehicle. This equates to an excess volume of 40%. This has positives in terms of consumer utility where it leads to greater interior space and better access, but may come with downsides in terms of on-road practicality and safety. According to an estimate from the US, if you are hit by a vehicle 450 kg heavier than yours, the risk of death is 47% greater than if the vehicles were of the same weight.
With this extra size and weight typically comes higher CO2 emissions, whether that is from the manufacture of the vehicle or during usage. Plotting the real-world tailpipe CO2 emissions against weight, from Emissions Analytics’ EQUA test programme of hundreds of vehicles using Portable Emissions Measurement Systems since 2011, we see a positive correlation: each extra 100 kg of vehicle mass adds on average 13.9 g/km to in-use exhaust emissions, as shown in the chart below. This is likely to underestimate the relationship as vehicles have become more fuel efficient, like-for-like, over time. If weight is correlated to the official CO2 values over just the last five years, an extra 100 kg of mass adds 24.6 g/km.

If we add in estimates for upstream CO2 emissions from the vehicle manufacture, fuel refining and electricity production – using Emissions Analytics’ proprietary lifecycle analysis (LCA) model – we can see the total distance-specific emissions over a vehicle lifetime in the table below.
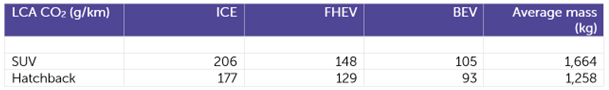
For further details on the model and methods, please refer back to our previous newsletter: Schrödinger’s Car.
The table shows, on these assumptions, that BEVs deliver the largest reduction in CO2 – roughly halving the emissions of the equivalent ICE vehicle. However, if we were to revert to the previously most popular bodystyle, the hatchback, and applied the latest hybridisation, using less than 2 kWh of battery, battery electric SUVs are 19% lower in CO2 emissions, due primarily to the difference in vehicle mass.
But this is not the end of the story, as with greater size and weight also comes higher purchase prices. In 2022, the average list price of BEVs on sale in the UK is £37,003, compared to £25,771 for gasoline ICEs. Full hybrids (FHEVs) – those with the capability of some driving on battery only but without the possibility of external charging – cost on average £25,745, but the hatchback subset of these comes in at just £17,577.
The risk, therefore, is that, without significant taxpayer subsidy, consumers will hold back from buying BEVs. This is perhaps being seen for the first time in the softening market share figures for BEVs in the first quarter of 2022 in the UK and Europe. This in turn may lead to consumers buying new ICE vehicles, but many will be put off by the threat to residual values and utility of looming statutory bans. Instead, many may simply opt to hold onto their existing ICE vehicle or buy second-hand, keeping them on the road longer than normal.
Currently, 14 years is the average lifespan of a vehicle in Europe. If this were to increase due to the high price of BEVs, it would covertly undermine the CO2 reduction of BEVs until all the ICE vehicles were off the road. Taking the UK car parc of around 32.5 million vehicles and a typical number of new car transactions of around 2.1 million per year, we can model three scenarios: reverting to 100% gasoline ICE vehicles, shifting all new cars to BEVs by 2030, and shifting exclusively to FHEVs at the same rate.
Although current new car sales are running at 1.6 million per year due to a combination of the economic environment and supply chain disruption, we have assumed a reversion to the usual level of 2.1 million per year soon. We can assume that a switch to FHEVs would not affect the quantity demanded as the average price is similar to an ICE vehicle. The question is the degree to which, other things being equal, the quantity of BEVs demanded would be affected by their higher relative price. According to recent research from Norway, the price elasticity of demand for BEVs is -1.27, i.e. demand falls by 1.27% for every 1% increase in price. If we further assume that 41% of car buyers are actively considering a BEV in the next five years, this would imply a reduction in sales of up to 480,000 per year due to the price premium. In other words, sales could remain subdued at around 1.6 million per year rather than recovering. Countering this argument would be the valid point that BEVs are cheaper to operate, although consumers tend heavily to discount future benefits.

With a lower level of new car sales, but assuming no reduction in demand for car usage, the average lifespan of a vehicle would likely increase. According to Emissions Analytics’ model, that increase would be from 14 to 17 years on average. On a lifecycle basis through to 2050, the effective fleet average CO2 emission on the base ICE scenario is 223 g/km. On the BEV scenario, this falls to 156 g/km. The FHEV scenario would be 181 g/km, but if these FHEVs were exclusively hatchbacks it would be just 158 g/km on average. These values lead to the cumulative CO2 figures through to 2050 in the chart above. Therefore, given the current realities of BEV pricing, and accepting the compromise in utility from a hatchback, a strategy of hybridisation is just as good as an immediate BEV migration, but with the benefit of needing less taxpayer support.
This analysis of course takes the specifications and prices of current vehicles. The only future forecast used is around the forecast decarbonisation of the electricity grid. If BEVs and SUVs become relatively lighter or cheaper over time, or the CO2 intensity of manufacture or energy production falls, different conclusions would be drawn. Therefore, for BEVs to be the optimal way forward that is often proposed, focus needs to be on addressing these factors affecting CO2, rather than subsidising the uptake right now. Finally, we must also recognise the on-going CO2 reduction benefits of BEVs after 2050 compared to FHEVs, which holds so long as battery durability matches the current lifespan of vehicles, which was discussed in our previous newsletter, Why battery durability matters for decarbonisation.

All in all, for the next decade, is it not better to incentivise smaller, hybridised vehicles as a more efficient, lower-risk and intuitive solution to CO2 emissions? Surely urban environments would be more pleasant with small, light vehicles moving around than the “electric tanks” quoted by Neil Winton in Forbes. Surely, this would also help preserve the affordability of vehicles for a wide population? Should vehicle weight even be regulated, as a good proxy for low emissions and high CO2-reduction efficiency? Such an approach may even be a way to reinvigorate EuroNCAP crash safety ratings that according to some now focus so much on the presence of driver safety aids of debatable efficacy.
It is true that such an approach would be crimping people’s liberty to some extent, by incentivising people to forgo the trappings of big SUVs. However, all directions in environmental improvement require some compromise, and this may be a smaller compromise than the available alternative options. This would be a dramatically different, and potentially much more effective, route to environmental improvement than the combination of fleet average CO2 targets and the proposed Euro 7 emissions regulations that seem destined to super-size the car parc in an unhealthy.

PRESS RELEASE: Emissions Analytics launches new chemical fingerprint tyre database available by subscription
Leading international vehicle emissions testing company, Emissions Analytics, today launches an innovative tyre database, the product of over two years of testing and evaluation.
Leading international vehicle emissions testing company, Emissions Analytics, today launches an innovative tyre database, the product of over two years of testing and evaluation.
Non-exhaust emissions are of growing environmental concern with tyre emissions under significant scrutiny. The EU-Commissioned research paper ‘Plastics in the Marine Environment’ found that tyres were the leading single cause of marine microplastics, amounting to 270 million tonnes per annum. It is crucial that as an industry, we develop our understanding of the nature and magnitude of this challenge.
The product of over two years of testing and evaluation, Emissions Analytics launches EQUA Tyre, an innovative organic compound profiling and benchmarking database, containing test results and raw data from independently-sourced samples from over 40 manufacturers and hundreds of different models of tyre.
Tyres are a complex mix of components and compounds. To be able to separate and identify all the organic compounds, Emissions Analytics utilises two-dimensional gas chromatography coupled with time-of-flight mass spectrometry to yield a unique and detailed chemical fingerprint for each tyre. The test method is designed to simulate the leaching of organic compounds over time from tyres and their wear products.
EQUA Tyre joins the broader stable of EQUA databases, comprising EQUA Tailpipe and EQUA Cabin for over 2,500 vehicles.
Research results show that certain product formulations lead to environmental impacts three times higher than alternative formulations. As a consequence, tyres not only vary significantly in wear rates, but also in chemical composition and environmental effects.
The aim of EQUA Tyre is to bring transparency to an area that has historically been under-researched, and which is now in the spotlight as a result of ever-heavier vehicles and rapidly cleaning tailpipes.
This launch comes at an important time, as the European Union considers the potential new Euro 7 vehicle emissions regulation and whether to incorporate limits for non-exhaust emissions.
The purpose of the EQUA Tyre database is to furnish tyre OEMs and other suppliers, regulatory bodies and non-governmental interested parties with access to a comprehensive, independent assessment of tyre composition.
This potentially points to the best ways to drive reductions in environmental and health impact through incentives to develop improved products. It further offers the opportunity to understand the sources of microplastics being observed in air, water and soil samples.
The resulting data is unique in the global tyre industry and the first major effort towards a comprehensive understanding of tyre composition affecting all matters, from tyre performance to environmental impact.
Access to this unique database will be available on corporate subscription and we are pleased also to offer confidential laboratory testing services to our partners globally.
On the launch of the database, Emissions Analytics’ founder and chief executive officer, Nick Molden, commented: “Tyres are rapidly eclipsing the tailpipe as a major source of emissions from vehicles, but the nature of tyre wear is poorly understood. The new EQUA Tyre database marks a milestone in measurement, and which can offer a foundation for developing solutions.”
If you would like to access to our tyre database, please contact us.


Gaining traction, losing tread Pollution from tire wear now 1,850 times worse than exhaust emissions
By some distance, the research Emissions Analytics published in early 2020 claiming that tire particulate wear emissions were 1,000 times worse than exhaust emissions generated the most feedback of any subject we have tackled so far – feedback that was a mixture of surprise and scepticism
By some distance, the research Emissions Analytics published in early 2020 claiming that tire particulate wear emissions were 1,000 times worse than exhaust emissions generated the most feedback of any subject we have tackled so far – feedback that was a mixture of surprise and scepticism.
Of particular attention was whether such a rate of wear would mean that any tire could be spent within just a few thousand miles with legal driving, however aggressive. Particularly vocal were the battery electric vehicle (BEV) community, sensitive to any suggestion that the added weight of these vehicles might lead to tire wear emissions that might confound the ‘zero emissions’ tag. Such was the reaction, the story was translated into over 40 languages worldwide.

Since that study, which was transparently designed to quantify the worst-case tire emissions under legal driving, Emissions Analytics has been testing and analysing tire wear emissions in more detail across a wider range of driving conditions, and has performed a detailed chemical analysis of hundreds of new tires. Furthermore, we have worked with the National Physical Laboratory in the UK objectively to quantify the uncertainties in our measurements of chemical composition.
The headline conclusion we draw now is that, comparing real-world tailpipe particulate mass emissions to tire wear emissions, both in ‘normal’ driving, the latter is actually around 1,850 times greater than the former. Yes, in normal driving the ratio is almost double the previous figure for aggressive driving.
Quoting such ratios, however, needs careful interpretation. The fundamental trends that drive this ratio are: tailpipe particulate emissions are much lower on new cars, and tire wear emissions increase with vehicle mass and aggressiveness of driving style. Tailpipe emissions are falling over time, as exhaust filters become more efficient and with the prospect of extending the measurement of particulates under the potential future Euro 7 regulation, while tire wear emissions are rising as vehicles become heavier and added power and torque is placed at the driver’s disposal. On current trends, the ratio may well continue to increase.
To measure tire wear mass emissions, Emissions Analytics uses high-precision scales to weigh all four wheels – tires and rims together, without detaching – over at least 1,000 miles on real roads. This is coupled with a proprietary sampling system that collects particles at a fixed point immediately behind each tire, which are, via a sample line, drawn into a real-time detector measuring the size of distribution of particles by mass and number. Typically, this measures particles from 10 microns down to 6 nanometres. This combination allows the real-time signal to be calibrated to the mass loss, and, by using the size distribution, the proportion of the particles likely to be suspended in the air can be estimated. All tire emissions figures quoted here are for the whole vehicle, combining wear from the four tires.
Tailpipe particles are measured, in similar real-world conditions, using a diffusion charger analyser for dynamic mass concentration and a condensing particle counter for number concentration, both coupled with a standard Portable Emissions Measurement System (PEMS) to measure total exhaust flow. As a result, distance-specific mass and number emissions can be derived, which can then be compared to equivalent tire metrics. A summary of the results is shown in the table and chart below.
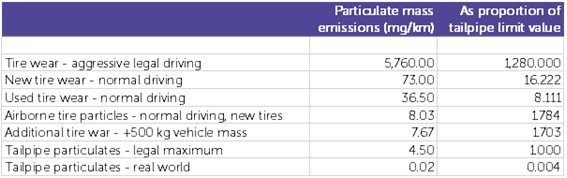
The comparison is best illustrated by way of a bar chart with a logarithmic vertical scale, as shown below.

The aggressive legal driving is the result from 2020, which was derived from a Volkswagen Golf driven at legal road speeds on a track, with fast cornering and maximum permitted payload in the vehicle. The normal driving results were averaged across 14 different brands of tire tested on a Mercedes C-Class driven with average dynamics on the road, with just the driver and no payload in the vehicle. All of these tires were tested from new. A smaller number of tires were then tested over their full lifetime in order to estimate the degree to which wear rates declined over time.
The tailpipe real-world emissions were measured across four gasoline mid-sized sports utility vehicles from 2019 and 2020 model years, driven on a mix of urban and motorway routes. The payload was the driver and test equipment only. For these vehicles, the relevant regulated limit value in Europe – which is the same limit in force for current vehicles – was 4.5 mg/km for mass and 6.0 x 10¹¹ #/km for number.
Quite remarkably, but as testament to the filtration efficiency of the latest gasoline particulate filters (GPFs), tailpipe mass emissions are now as low as 0.02 mg/km. Gasoline vehicles were tested as they represent the majority of new passenger cars sold today. Therefore, the mass wear from new tires is 16 times greater than the maximum permitted from the tailpipe, but 3,650 times greater than actual tailpipe emissions. Taking the full-life average tire emissions, that premium falls to the 1,850 times mentioned earlier. The excess emissions under aggressive driving should alert us to a risk with BEVs: greater vehicle mass and torque delivered can lead to rapidly increasing tire particulate emissions. Half a tonne of battery weight can result in tire emissions that are almost 400 more times greater than real-world tailpipe emissions, everything else being equal. Nevertheless, it is important to say that a gentle BEV driver, with the benefit of regenerative braking, can more than cancel out the tire wear emissions from the additional weight of their vehicle, to achieve lower tire wear than an internal combustion engine vehicle driven badly.
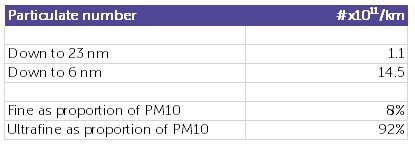
An important difference between tire and tailpipe particle emissions is that most of the former is understood to go straight to soil and water, whereas most of the latter is suspended in air for a period, and therefore negatively affects air quality. This is supported by Emissions Analytics’ results, which suggest around 11% of the mass of tire emissions is smaller than 2.5 microns in diameter (defining the common metric for fine particle dust, PM2.5, which can be airborne). Therefore, the airborne tire emissions are more likely to be around 8 mg/km as shown in the table above – this is still more than 400 times higher than tailpipe emissions.
However, considering just tire mass emissions may underestimate the effect on air quality and the consequent human health effects. The particulate number can be estimated, as shown in the second table. When measuring particle number, the lower size cut-off is important – the smaller the particles get, the more volatile and harder to measure repeatably they become. Cutting off at 23 nm avoids these ‘semi-volatiles’, whereas 6 nm is a much more comprehensive range.

This shows that 13.4 x 10¹¹ #/km are in the size range between 6 nm and 23 nm, which represent 92% of all particles below the 10 micron upper limit that defines PM10. Growing scientific evidence suggests that these ultrafine particles more easily enter the human bloodstream and lungs, and cross into the brain. The 14.5 x 10¹¹ #/km for the whole size range should also be compared to the maximum number permissible from the tailpipe of 6.0 x 10¹¹ #/km at a 23 nm cut-off, and the actual real-world values from Emissions Analytics’ EQUA test programme of 0.9 x 10¹¹ #/km for gasoline vehicles and 0.1 x 10¹¹ #/km for diesels. Therefore, tires create more than double the particle number emissions of the tailpipe, averaged across those two fuel types. Put another way, tires may release an extra sixty billion particles for every kilometre driven.
While the body of research on the health of effects of ultrafine particles is growing, how bad these effects are is likely to depend on how toxic the particles are. Light-duty tires are typically made up of synthetic rubber, derived from crude oil, rather than natural rubber, together with various fillers and additives. In a recent newsletter, Emissions Analytics set out its initial findings from chemical analysis of the organic compounds in a range of tires using two-dimensional gas chromatography and time-of-flight mass spectrometry. This showed that there were hundreds of different compounds in each tire, with a significant proportion being aromatics, some of which are recognised carcinogens.
The next stage is then to take that chemical profile and study the toxicity of each. Our research so far shows that the least toxic tires are one-third as toxic as the worst – this will be the subject of a future newsletter. Therefore, tires not only vary significantly in wear rates, but also in chemical composition and toxicity. This potentially points to an effective way to drive reductions in wear and toxicity through economic incentives and regulation.

Bringing all these elements together, Emissions Analytics will be publishing the chemical composition and toxicity of hundreds of different tires in a subscription database that will be launched in mid-May 2022. The aim is to bring transparency and insight to an area that has historically been under-researched, but which has now been thrown into the spotlight with ever-heavier vehicles and rapidly cleaning tailpipes. We are looking to talk to anyone interested in research in this area.
Want to join the conversation at our next conference? Click the photos below to learn more.


Presentation: Tyre wear, chemical composition and toxicity
Our CEO & Founder, Nick Molden presented a webinar on Tire wear, chemical composition and toxicity on 20th April 2022.
Our CEO & Founder, Nick Molden presented a webinar on Tyre wear, chemical composition and toxicity on 20th April 2022. To watch the webinar and download the presentation below.
Tyre wear emissions represent a widespread and growing challenge as vehicles become heavier, not least due to the battery weight in electric vehicles. Health evidence is mounting showing how tyre particles enter the bodies of humans and animals via air, soil and water. The questions are, therefore, how much material is released, what chemicals may be leaching into the environment as a result, and what are the potential toxic effects for humans and animals?
Over the past year, Emissions Analytics has undertaken considerable research to analyse the organic composition of tyres. To that end, we have independently sourced hundreds of tyres samples for analysis in our laboratory utilising two-dimensional gas chromatography and mass spectrometry to separate, identify and quantify those organic compounds present, and to estimate how they will leach when released.
We invite you to join our webinar so that we may share our work to date and welcome your input.
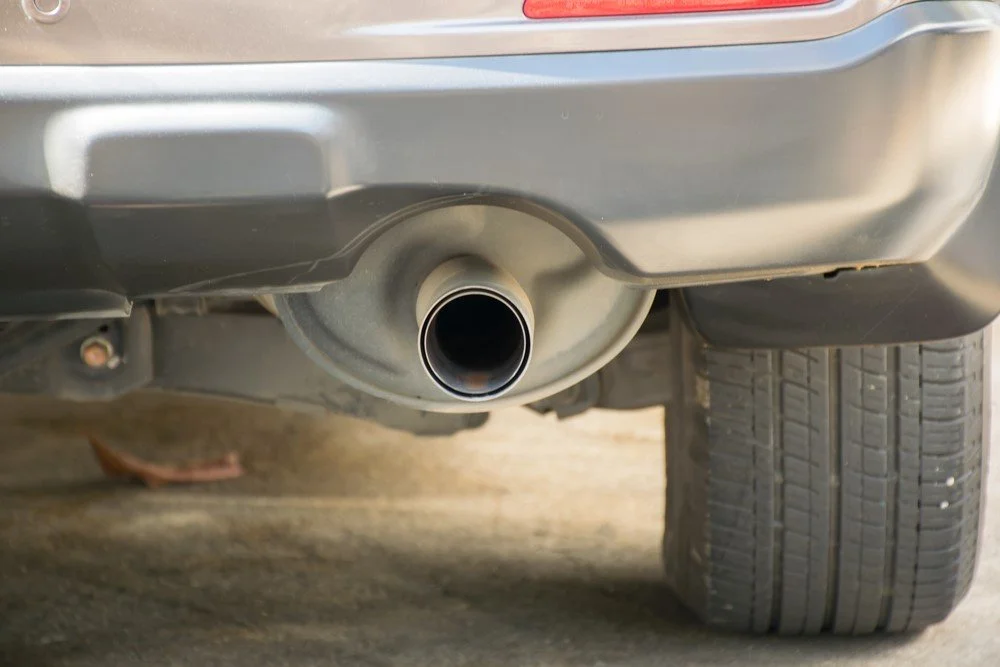
The septillion particle problem (literally)
That’s 1,000,000,000,000,000,000,000,000 exhaust emissions particles that are due to be emitted in the United States that don’t need to be. How? A large majority of European and Chinese cars are now sold with tailpipe particle filters, known as gasoline particulate filters (GPFs) or diesel particulate filters (DPFs) in the industry, but this is not the case in the US.
That’s 1,000,000,000,000,000,000,000,000 exhaust emissions particles that are due to be emitted in the United States that don’t need to be. How? A large majority of European and Chinese cars are now sold with tailpipe particle filters, known as gasoline particulate filters (GPFs) or diesel particulate filters (DPFs) in the industry, but this is not the case in the US. Focus on small, ‘ultrafine’ particles in the European regulations has driven gasoline exhaust filter adoption in a way that has not happened in the US, where particulate mass measurement has primacy, and effectively ignores these ultrafines.
A gasoline vehicle with a filter emits around 0.9 x 10¹¹ particles per mile (90 billion), but without a filter it is about 6.3 x 10¹¹ (630 billion), according to testing conducted by Emissions Analytics. With about 300 million internal combustion engine (ICE) vehicles likely to be on the road on average over the next ten years, each driving an average of 10,000 miles per year, that put the total number of ‘unnecessary’ particles emitted to US air to be 1.6 x 1024, or 1.6 septillion particles. If each particle were a dollar bill, the whole of the US could be carpeted over half a mile deep in money.

It is important, however, not to think of these particles as creating visible plumes of black smoke from the tailpipe. That is the clichéd image of exhaust particles, but that applies to older diesel vehicles without a particle filter. For gasoline vehicles, and those with a filter, the concern is for very small particles, down to 10 nm in size, which are invisible, numerous and highly mobile.
These ultrafine particles are of concern for human health, as their small size means that when inhaled they can be drawn deep into the lungs and cross the blood-brain barrier, with potential effects on cognitive development. The direct link to negative health outcomes is not generally considered as proven yet, but Europe has nevertheless regulated due to the weight of evidence and as a precaution. European particle-number-based standards have led to the widespread adoption of GPFs, which are effective at trapping these small particles. This was quickly adopted by China and India.
Even if only particle mass is concerned, on average a gasoline vehicle without a filter emits around 0.070 mg/mile, compared to a vehicle with a filter at 0.027 mg/mile. The unnecessary particle mass to be emitted in the US is therefore forecast to be over 100 tonnes over ten years. Not only does this have the understood impacts on air quality in urban areas, but observations suggest that it eventually migrates to the North and South Poles, settles on the ice, and helps accelerate climate change because of the high ‘black carbon’ content in soot, which is darker and a known global warming agent.
Some would say that this is minor or irrelevant as the light-duty fleet moves to full electrification. However, even on the most aggressive scenarios, new ICE vehicles will be sold in the US for over ten years. Those vehicles are likely to have a lifespan of around twelve years, so these vehicles could be on the road easily for 25 years from today. This does not reflect a lack of ambition in decarbonisation, but a practical reality. In the transition, there is a strong argument that we should do what we can to make ICE vehicles as clean as possible. Emissions Analytics has written extensively before that hybridisation is a better route to quick decarbonations – see a previous newsletter – and, if this position comes to pass, it could mean that hybrid vehicles are sold long after pure ICE vehicles are phased out, and these hybrids emit ultrafine particles in a similar way.
The emissions values described above are the result of programme run by Emissions Analytics in 2021 that tested apparently similar pairs of vehicles between the US (without GPFs) and Europe (with GPFs). The US vehicles were tested in Michigan, and the European vehicles in the UK. Four pairs of gasoline vehicles were tested. First, the three-litre BMW X5 was a 2019 model year in the US and 2020 in Europe. Second, there were two 2020 Jeep Wranglers with a 2.0 litre engine. Third, the full hybrid Toyota RAV4s were 2019 model year with the 2.5 litre engine. Finally, the 2020 1.5 litre Ford engine was tested in the Escape in the US and its equivalent Kuga model in Europe. These vehicles were drawn from different manufacturers and where the models were near-identical in technical specification and model year between the two regions. That said, in each case, the Europe vehicle was equipped with a GPF, while the US vehicle was not.
Each vehicle was then tested on similar on-road routes in the two countries to allow the comparison of their particle mass and number emissions. The gas emissions and particle number were measured using a regulatory-approved portable emissions measurement system (PEMS) from Sensors, Inc, together with a diffusion charger for particle mass measurement. Similar on-road routes were designed in both locations, which, despite the inevitably different traffic and ambient conditions, were shown to have similar dynamics overall. The average emissions across the four pairs of vehicles are shown in the charts below.


The results were highly consistent between the four vehicles. They were also consistent between different types of driving, from urban cold start to highway warm start. The table shows that the average reduction in particle number was 86% across the different vehicles and driving. The variation was from 76% to 96% – in all cases, the reduction was impressive. As the vehicle specifications were near-identical in other respects, it is very likely that the improvement is due to the GPF. While there were some differences in the chemical composition of the standard pump fuel used in both locations, this would not account for a significant proportion of this reduction.
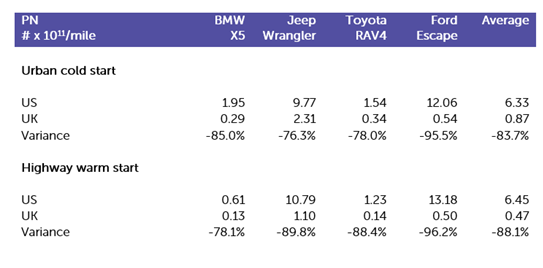
The equivalent overall particle mass reduction was lower but still impressive at 55%, with 81% reduction on the highway. Despite this positive performance, the question remains as to whether the benefit in improved air quality is worth the extra cost. A GPF system typically costs less than $200, which is about the same cost as the optional carpet mats on the BMW X5. Therefore, the cost for removing every billion particles emitted into the air is just 0.0004 cents. In addition to this, there is the further potential benefit of removing particles from the air that have come from other sources. As Emissions Analytics has shown in another newsletter, diesel particulate filters (DPFs) can ‘clean’ the air as the vehicle drives. GPFs are now achieving filtration efficiency rates – typically 80%, with the next generation of GPFs for Euro 7 regulations likely to exceed 95% – that are getting close to those of DPFs, and so the same net-cleaning effect can be expected. Moreover, the filtration efficiency tends to improve with the age of the filter, so the positive effect, if anything, grows.
The septillion particles mentioned above may even underestimate the potential for emissions reduction. The numbers are based on a rapid transition to full battery electric vehicles (BEVs), with no tailpipe emissions. However, this transition may not be as fast as anticipated, which would mean more ICEs for longer. Widespread installation of GPFs would, therefore, generate greater benefits over a longer period. But even as BEVs take off, there is growing evidence that they emit more tire wear emissions that ICE vehicles due to their increased weight. Emissions Analytics’ tests showed a 21% increase in tire particle mass emissions for 500 kg extra vehicle mass – roughly equivalent to the mass of a large battery pack – although this may be partially offset by the effect of regeneration breaking. More generally, there is an on-going trend towards heavier vehicles of all types, which increases tire emissions. Even though only 10-20% of tire wear emissions hang in the air, GPFs could have the added benefit of removing these particles from the air. In other words, ‘legacy’ ICE vehicles could help clean up emissions from BEVs.
Put another way, GPFs bring direct value, but also have an important ‘insurance’ effect that ensures there is benefit however the vehicle car parc evolves.

With filters on gasoline cars in Europe and China, and even coming soon to India, it is surprising that most new car sales in the world's second largest car market are not equipped with the best available technology for emissions reduction. There are signs that this might change, however. Even if US regulators do not embrace particle number as a measure that should be regulated, the potential reduction of the particle mass limit to 1 mg/mile at normal and cold temperatures (20°F or -7°C) might enable cleaner air in the US with widespread deployment of GPFs.
Few things in emissions control are a no-brainer. Mostly, awkward trade-offs between cost, vehicle utility and emissions reduction have to be resolved. In this case, the benefits appear high, costs relatively low, and risk minimal.
Credits: BMW VX images from BMW and www.thecarconnection.com.
Presentation: PEMS Conference
Our CEO & Founder, Nick Molden recently spoke at the annual CRC Real World Emissions Workshop.
Our CEO & Founder, Nick Molden recently spoke at the 11th Annual International PEMS Conference.
PEMS2022: Moving Towards Onboard Sensing, Analysis, and Reporting (OSAR) in California on the 17th March 2022
In this presentation, Nick discusses: Tailpipe emissions measurements.


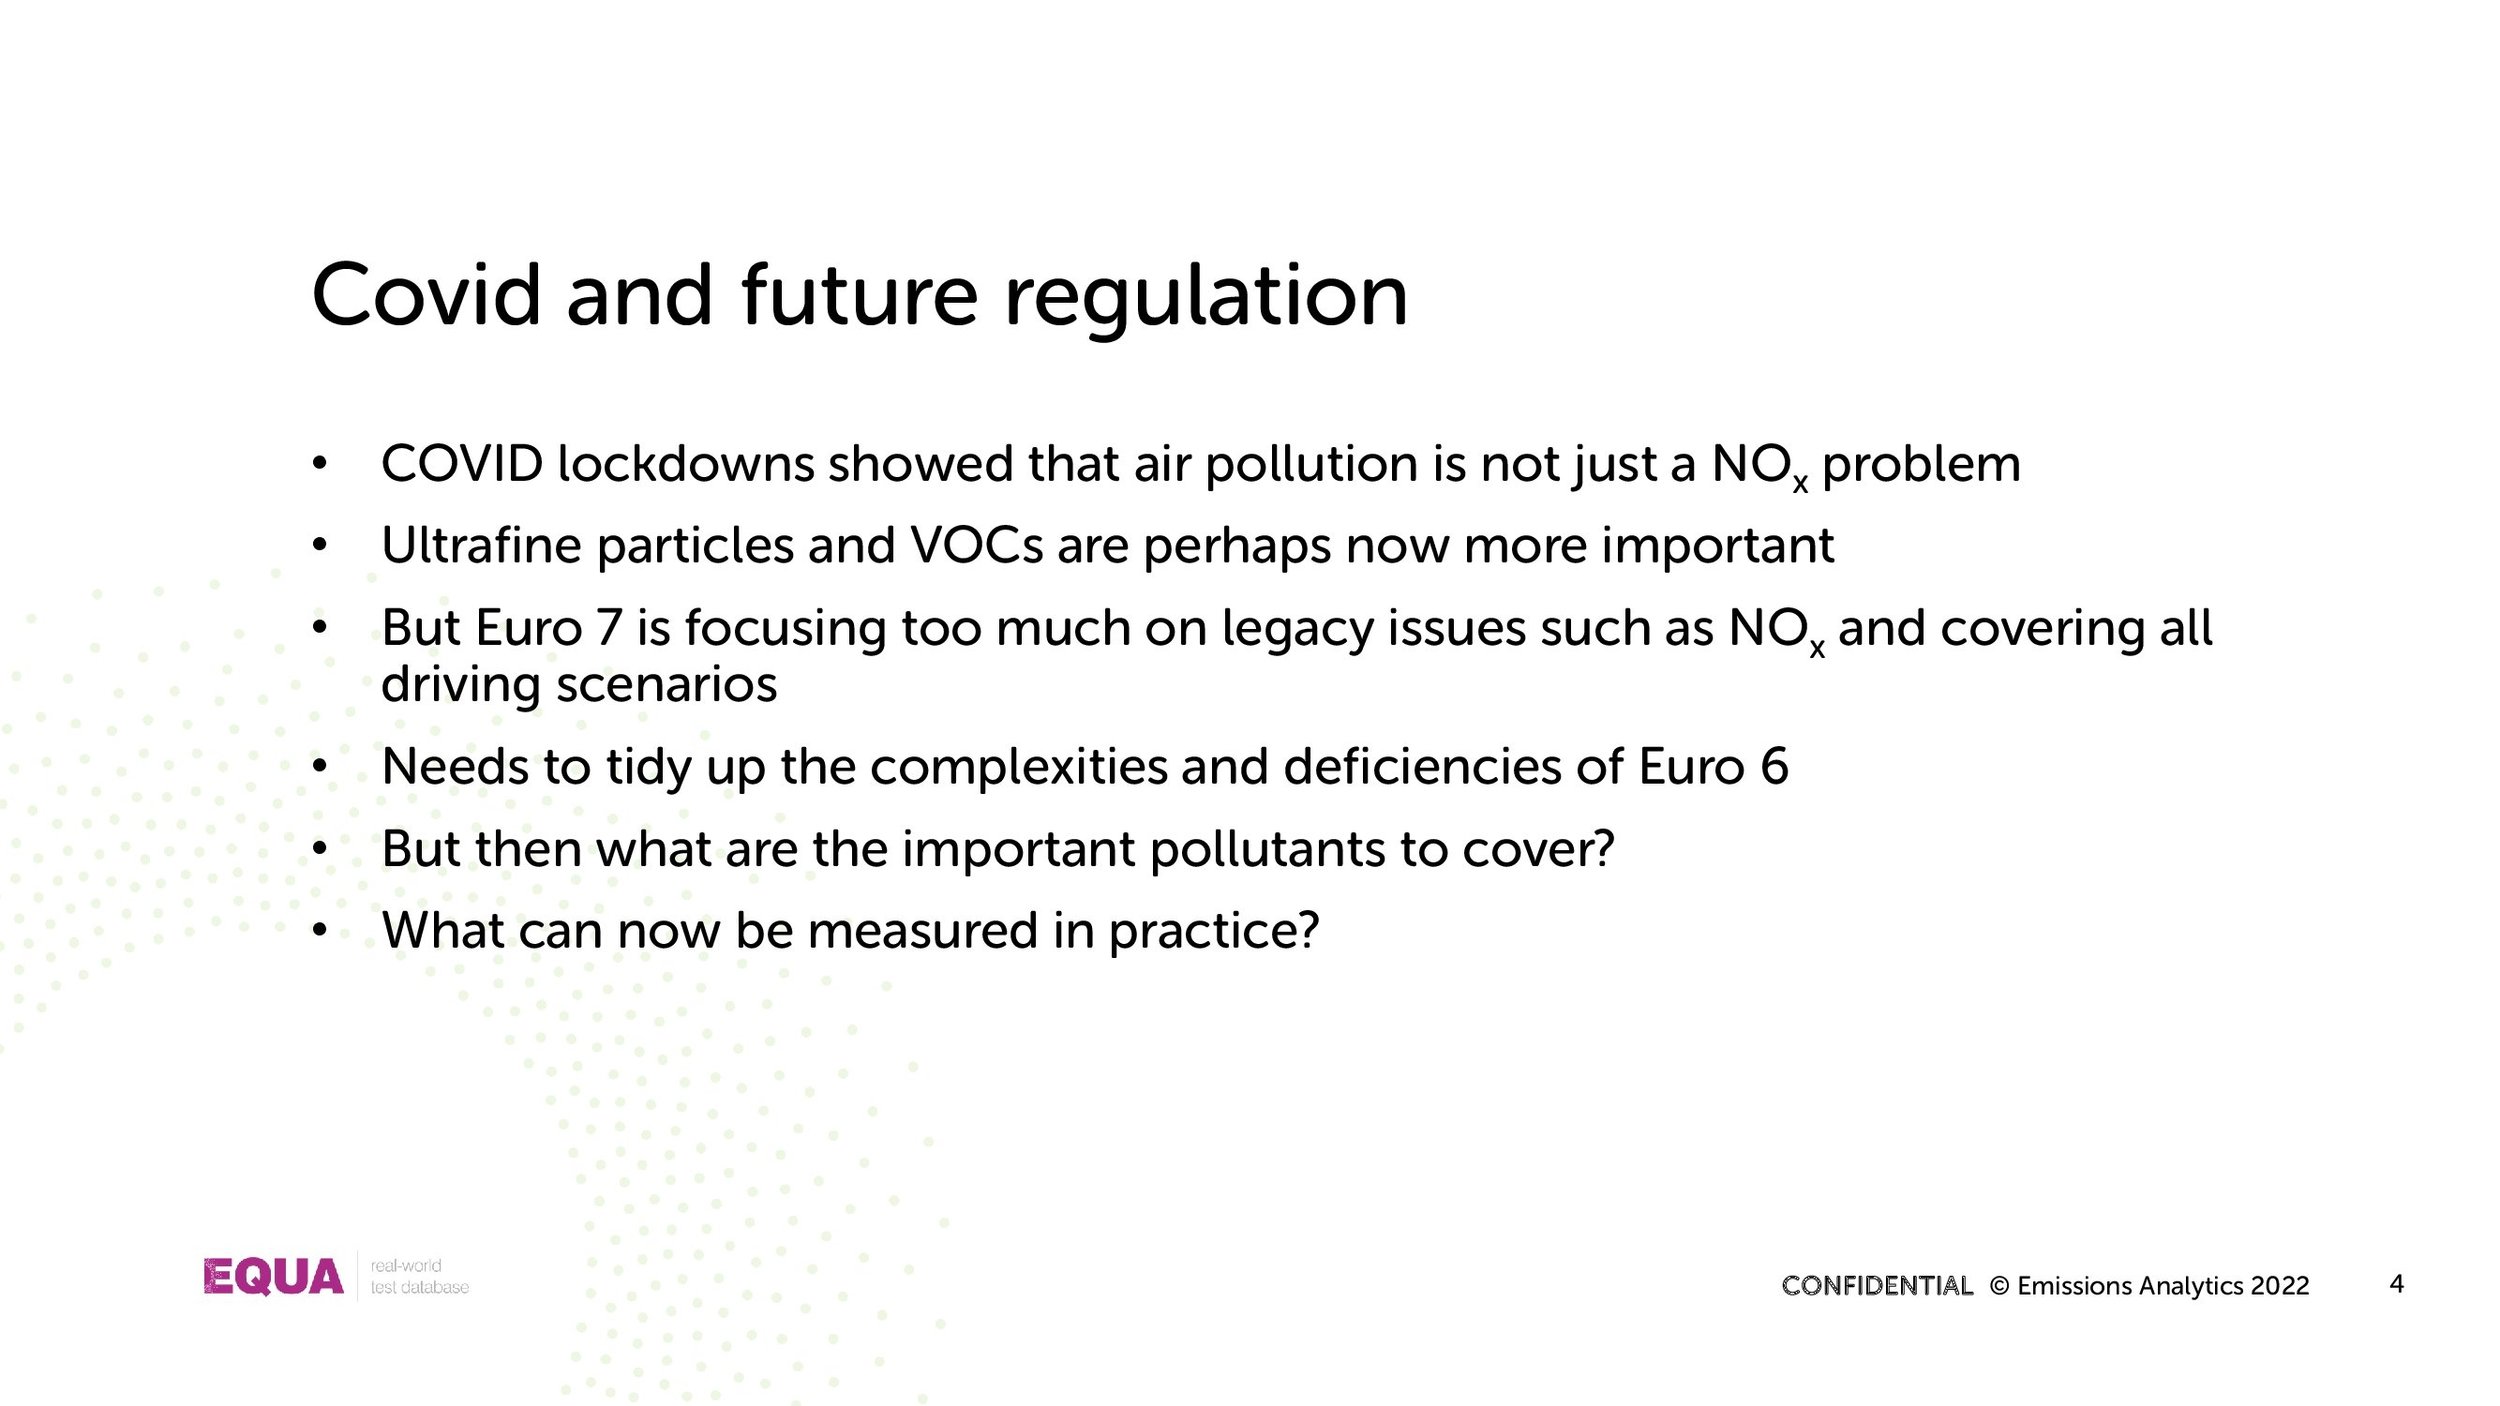
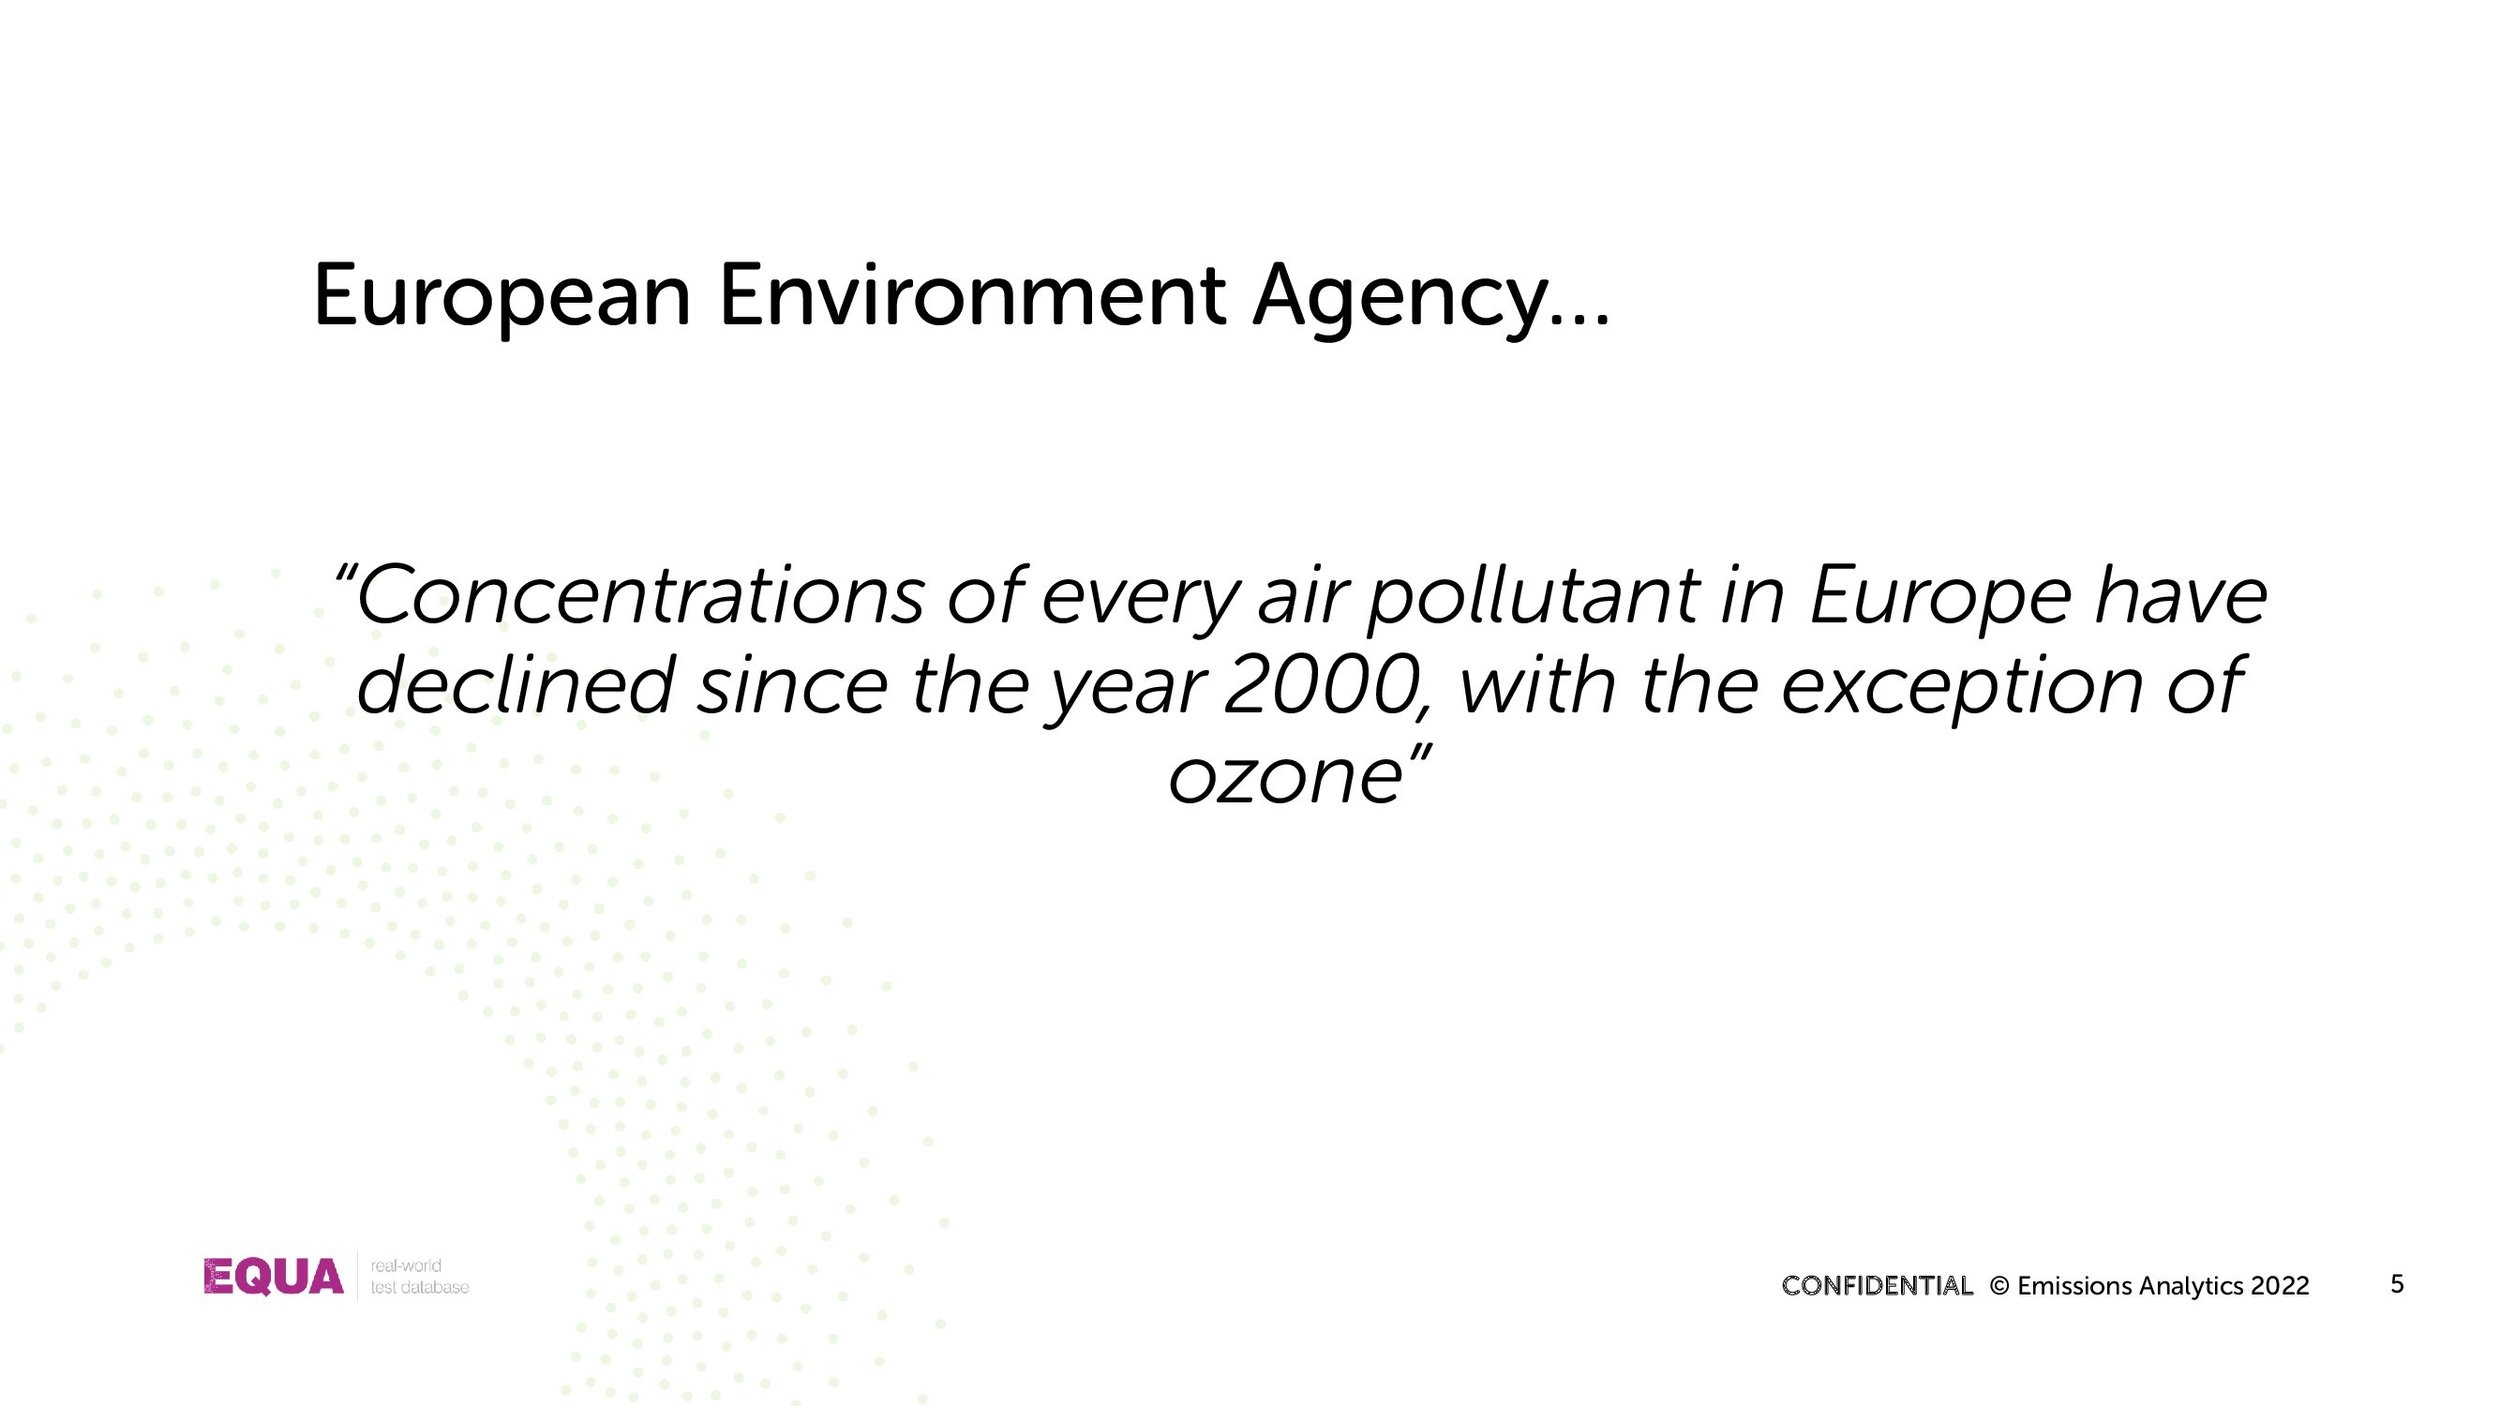

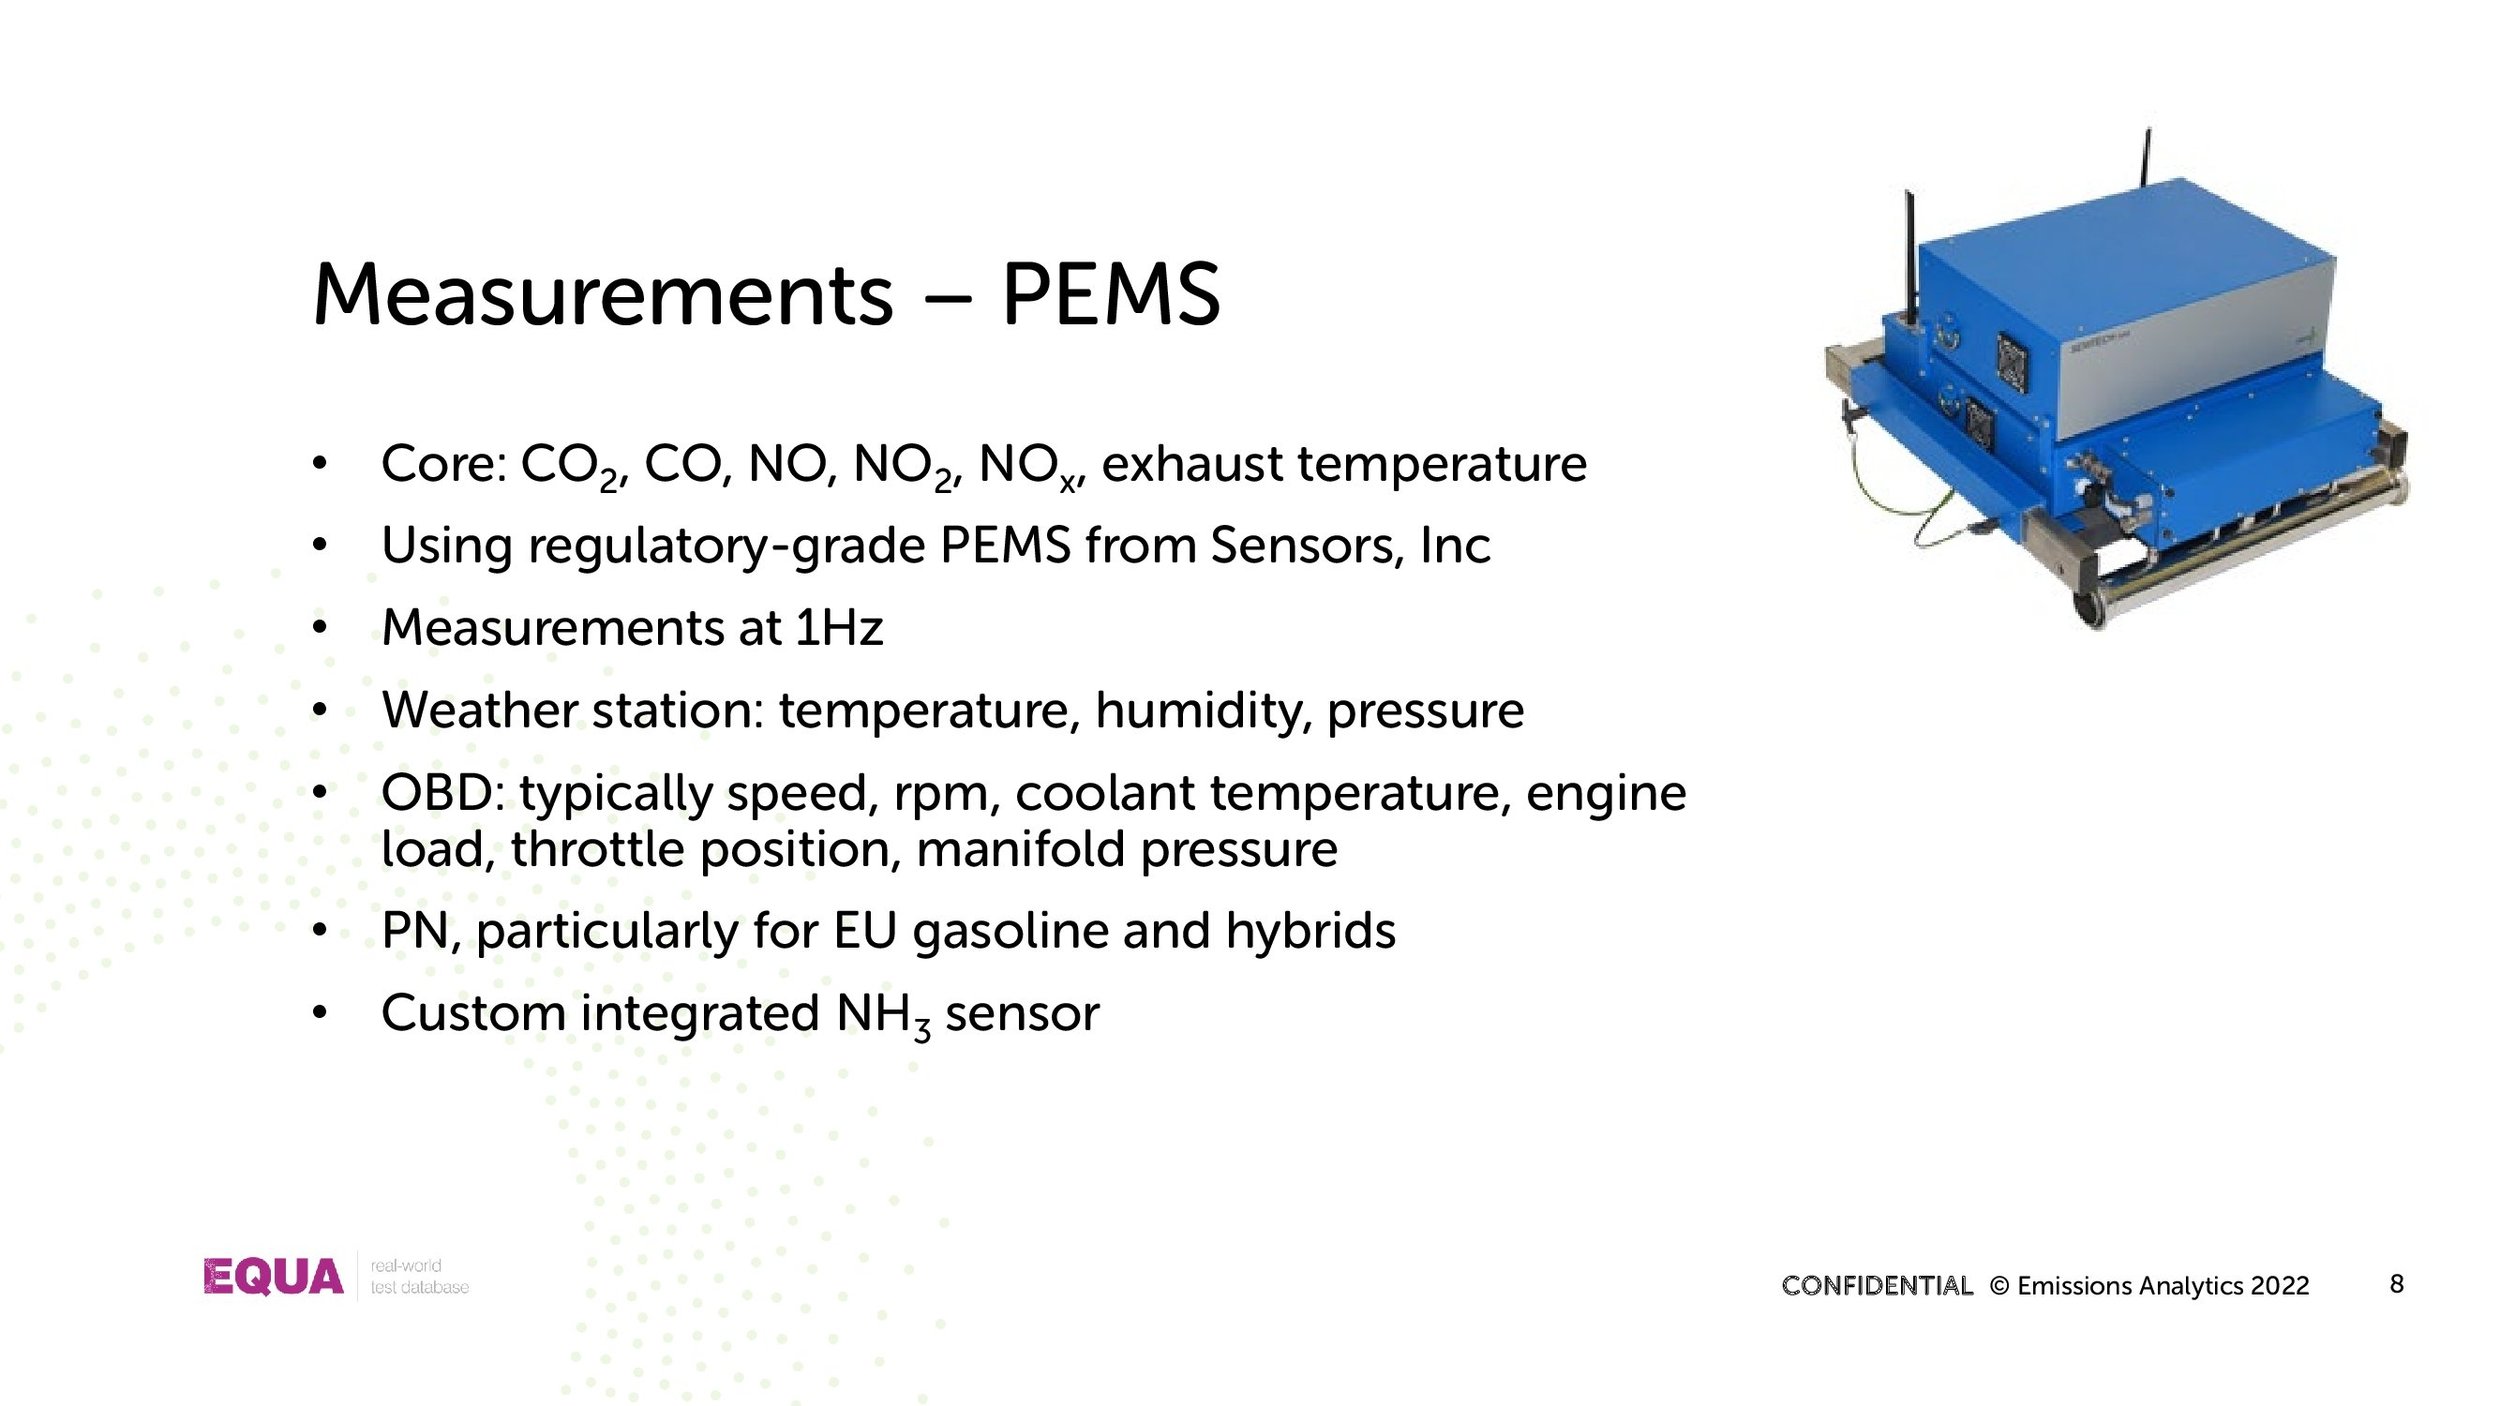
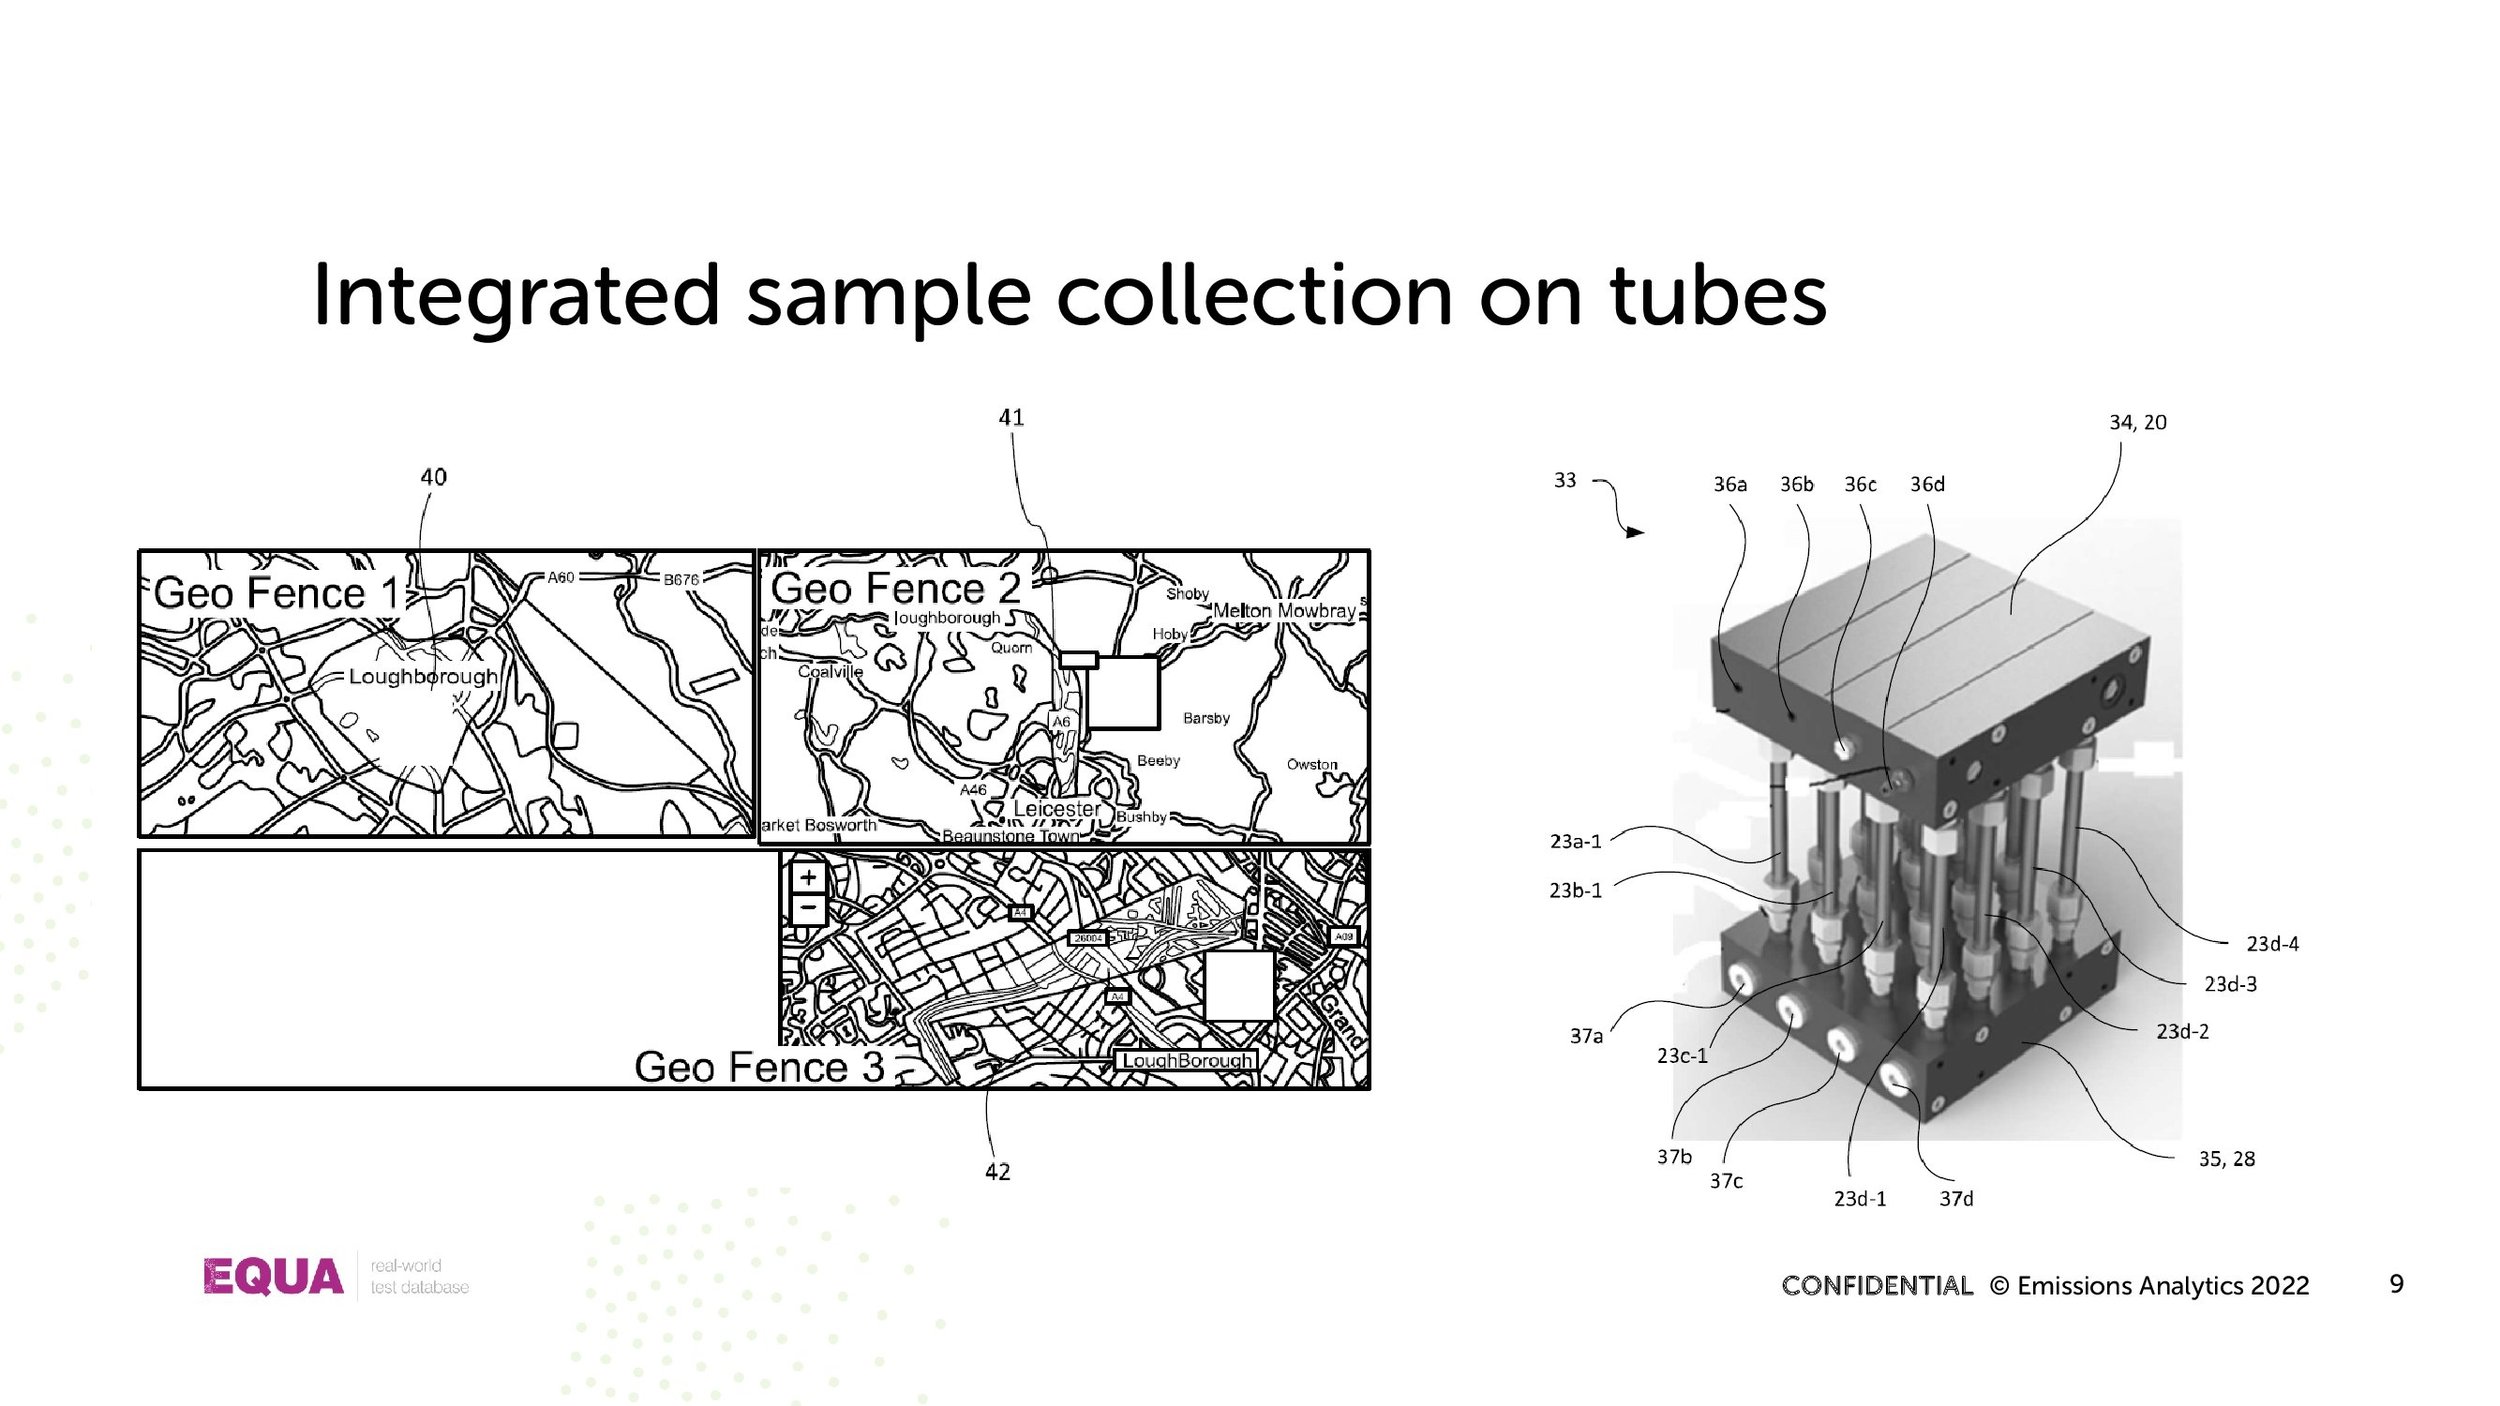
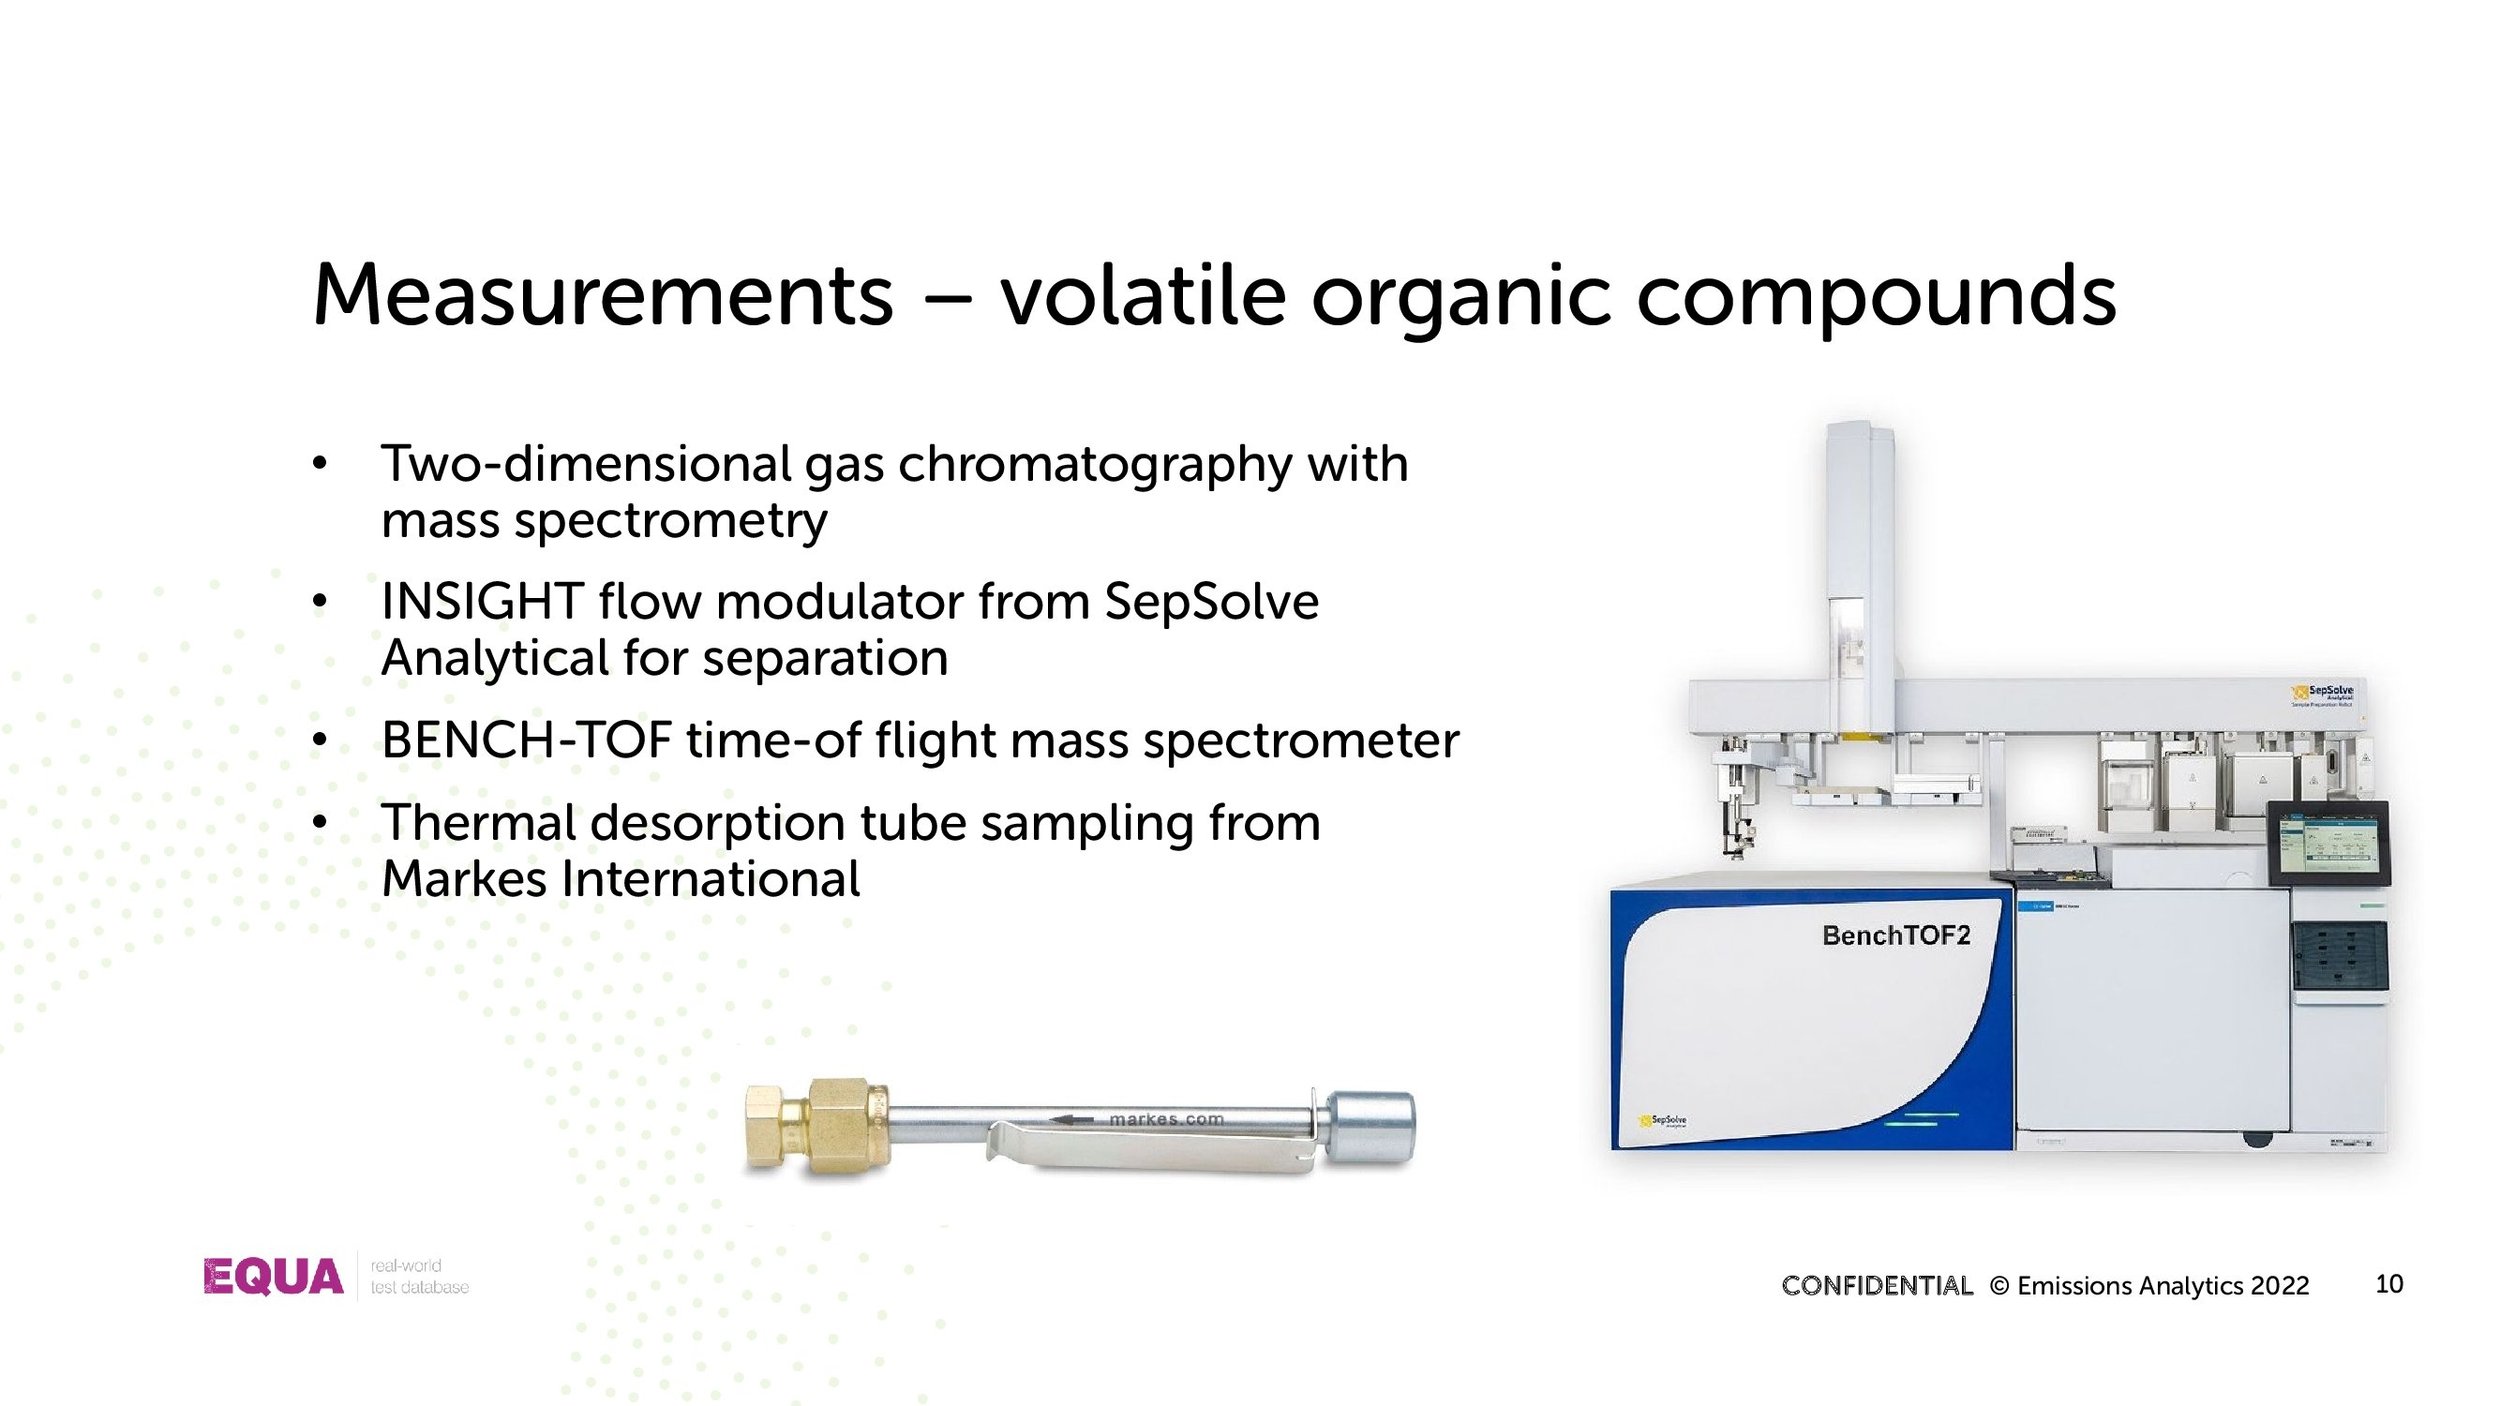
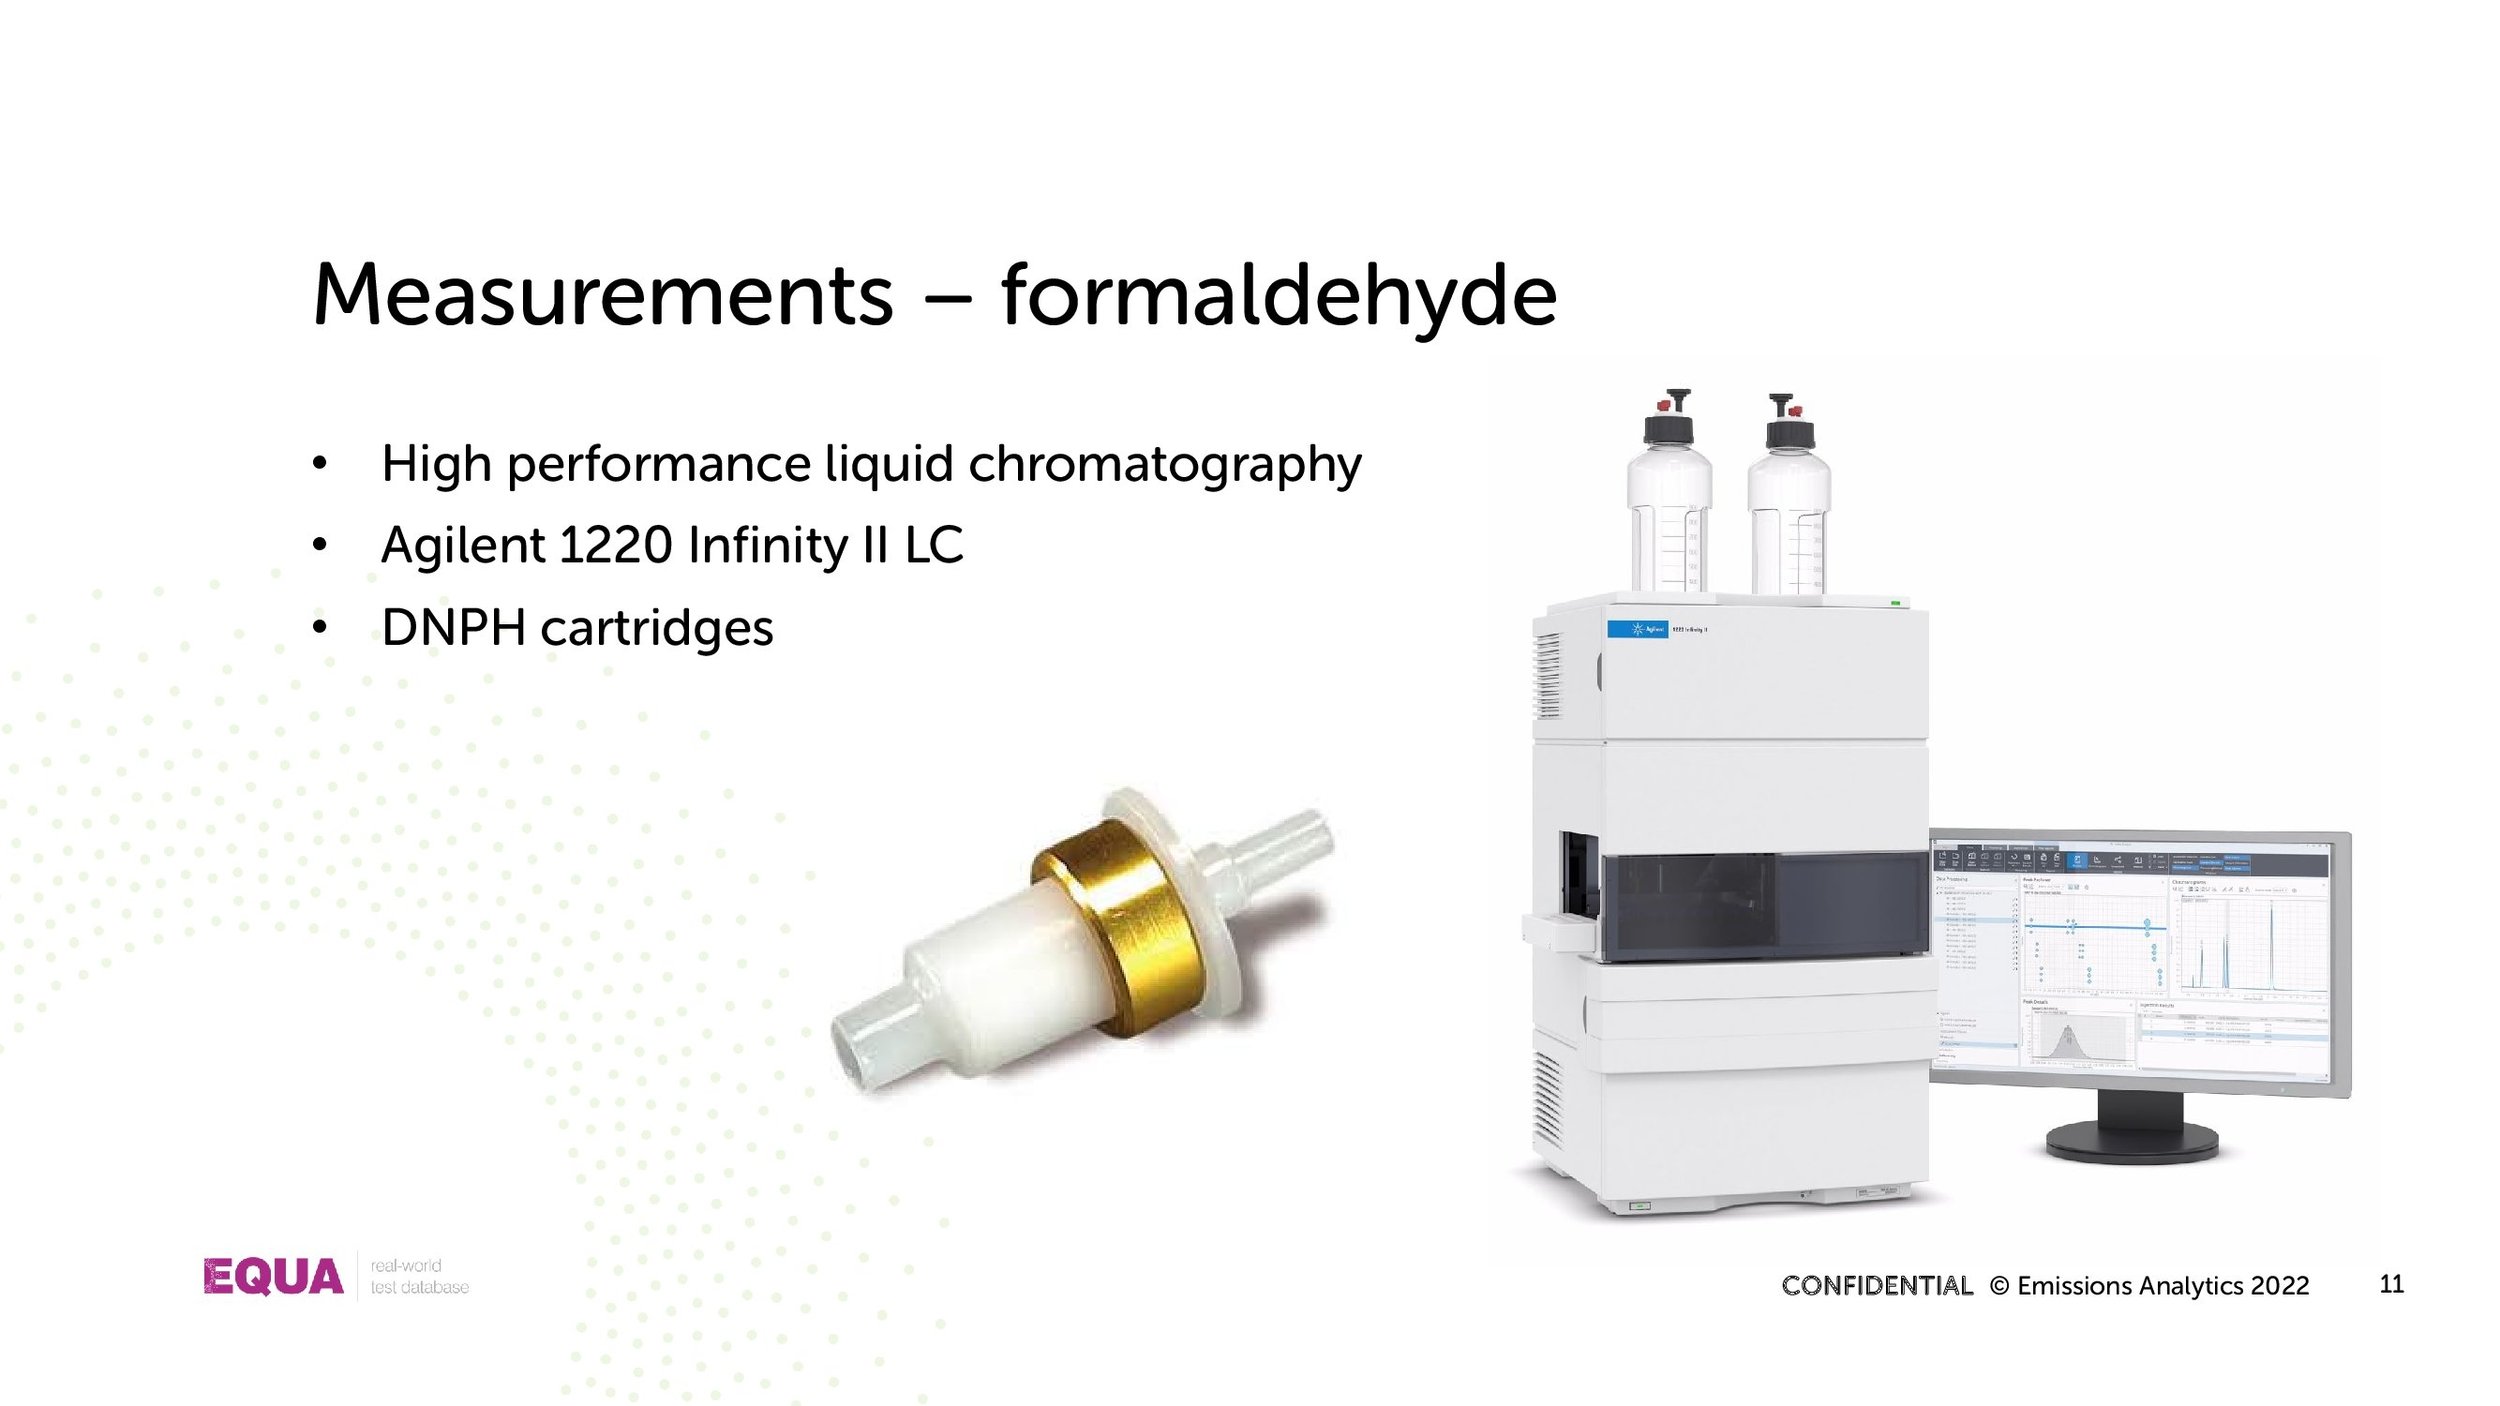
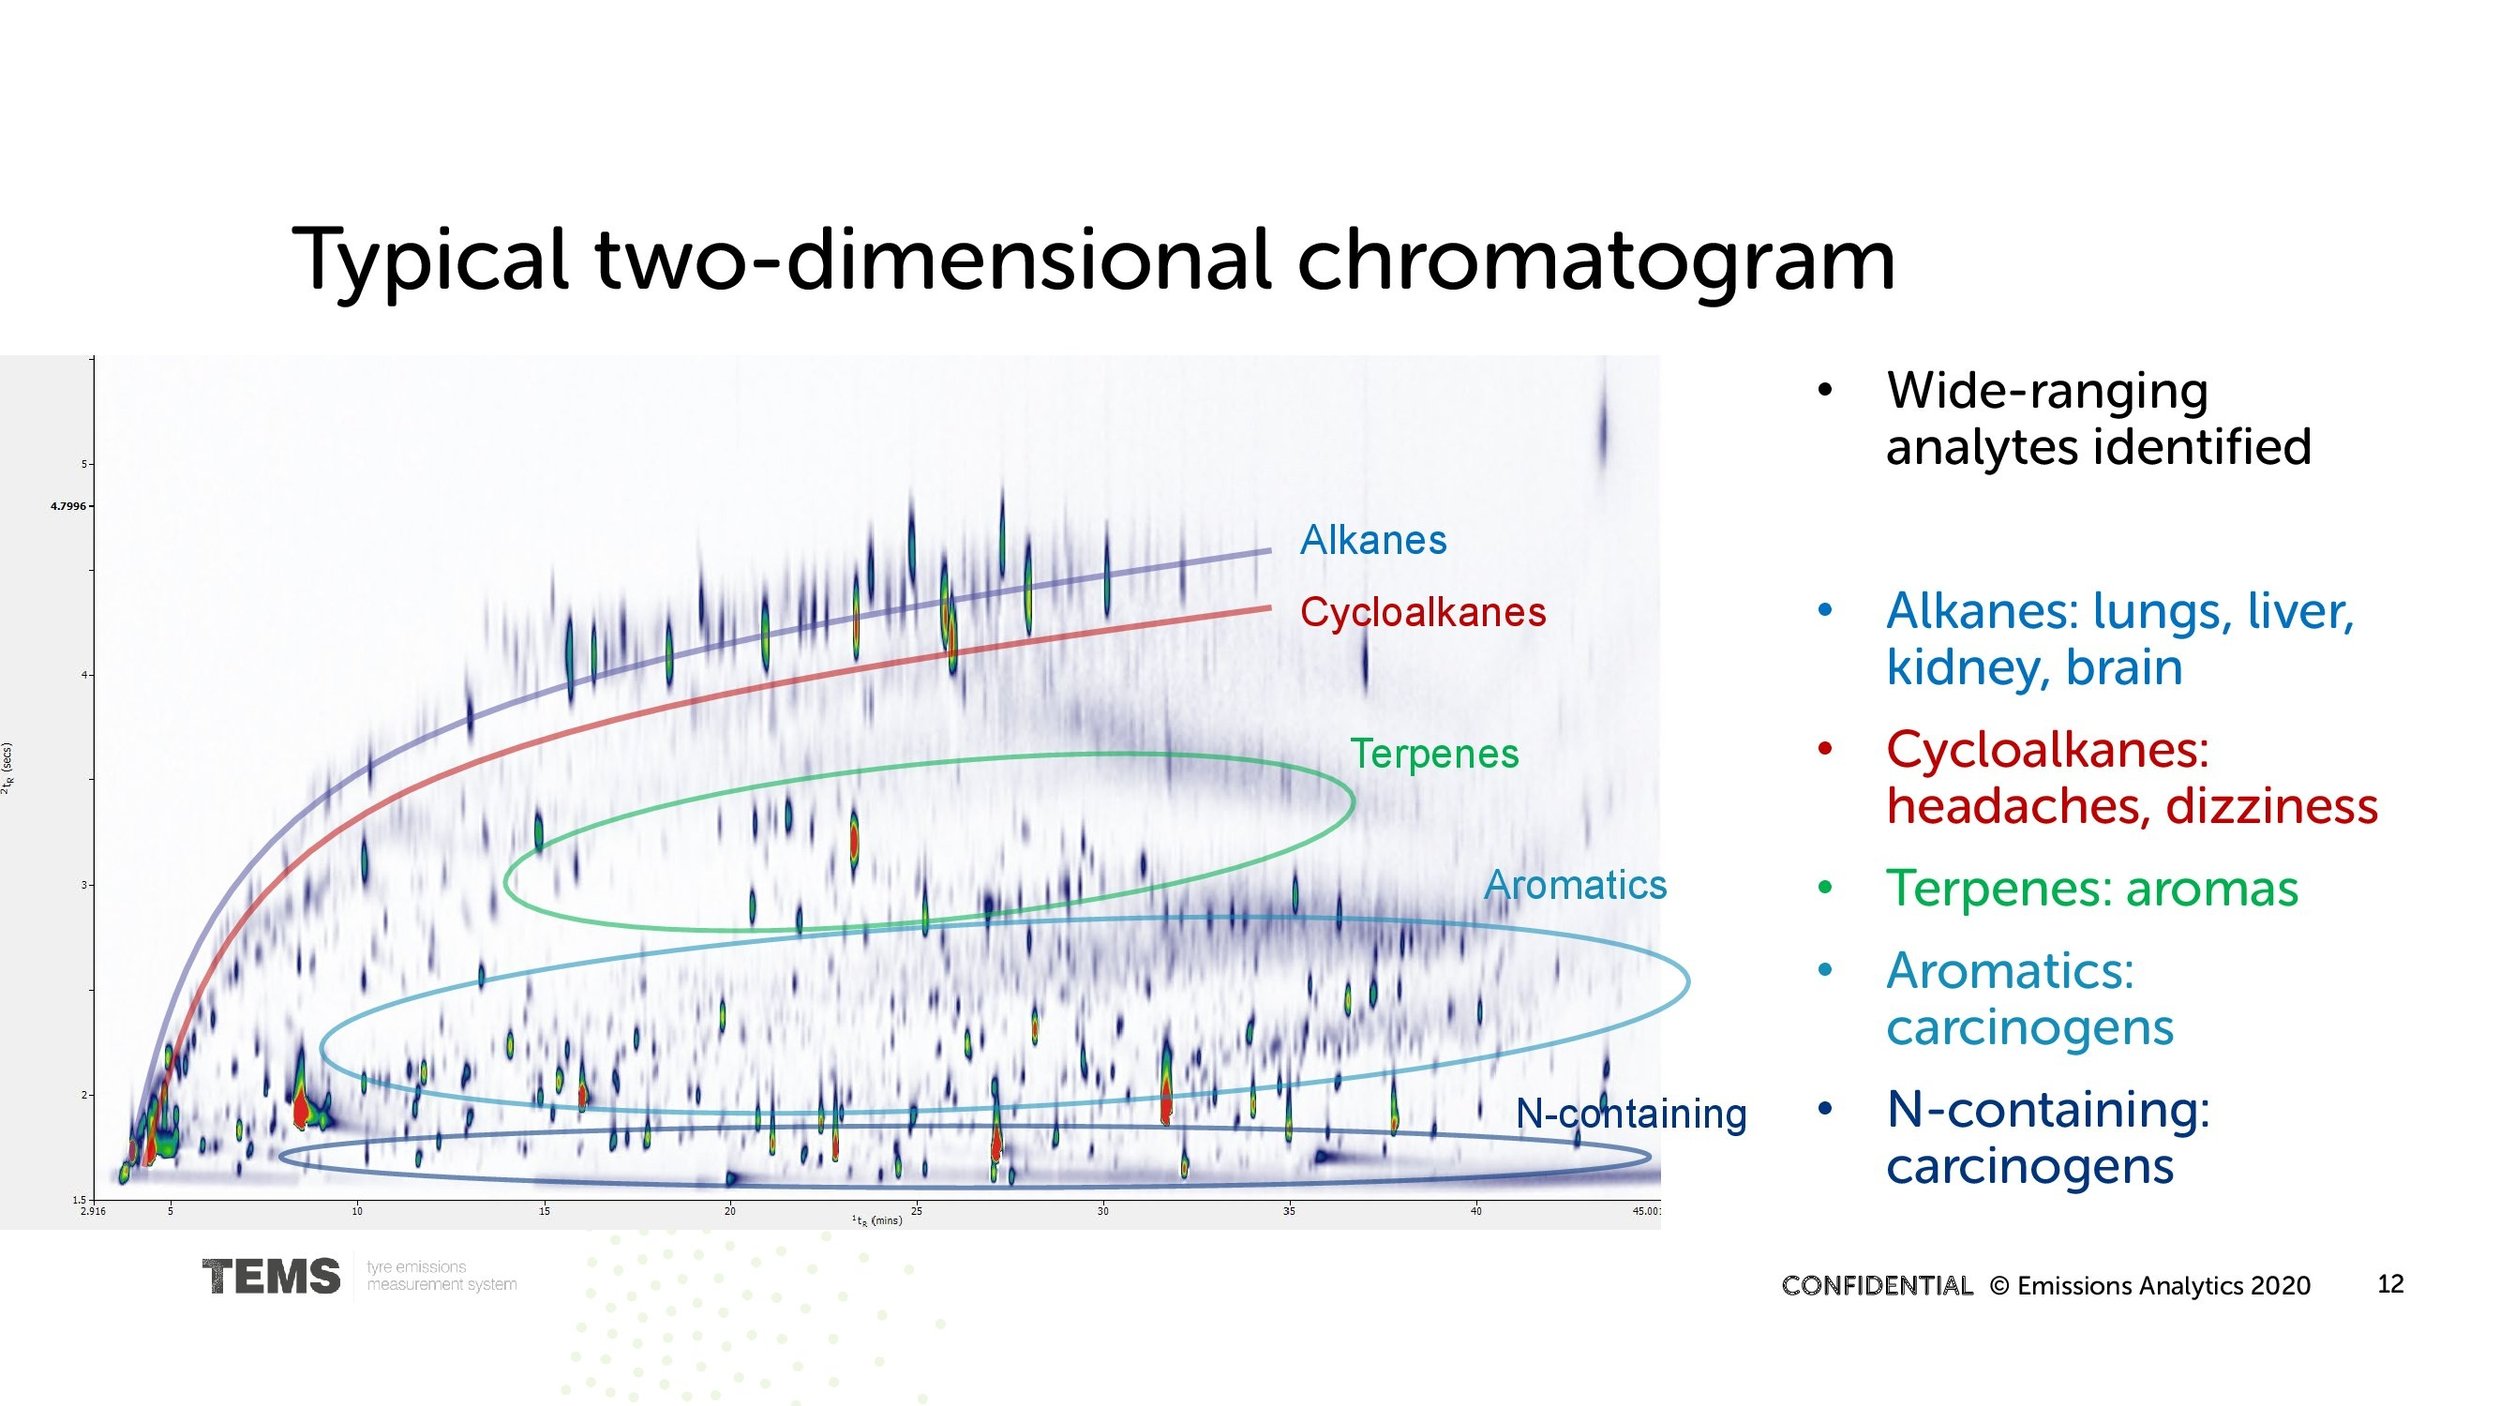
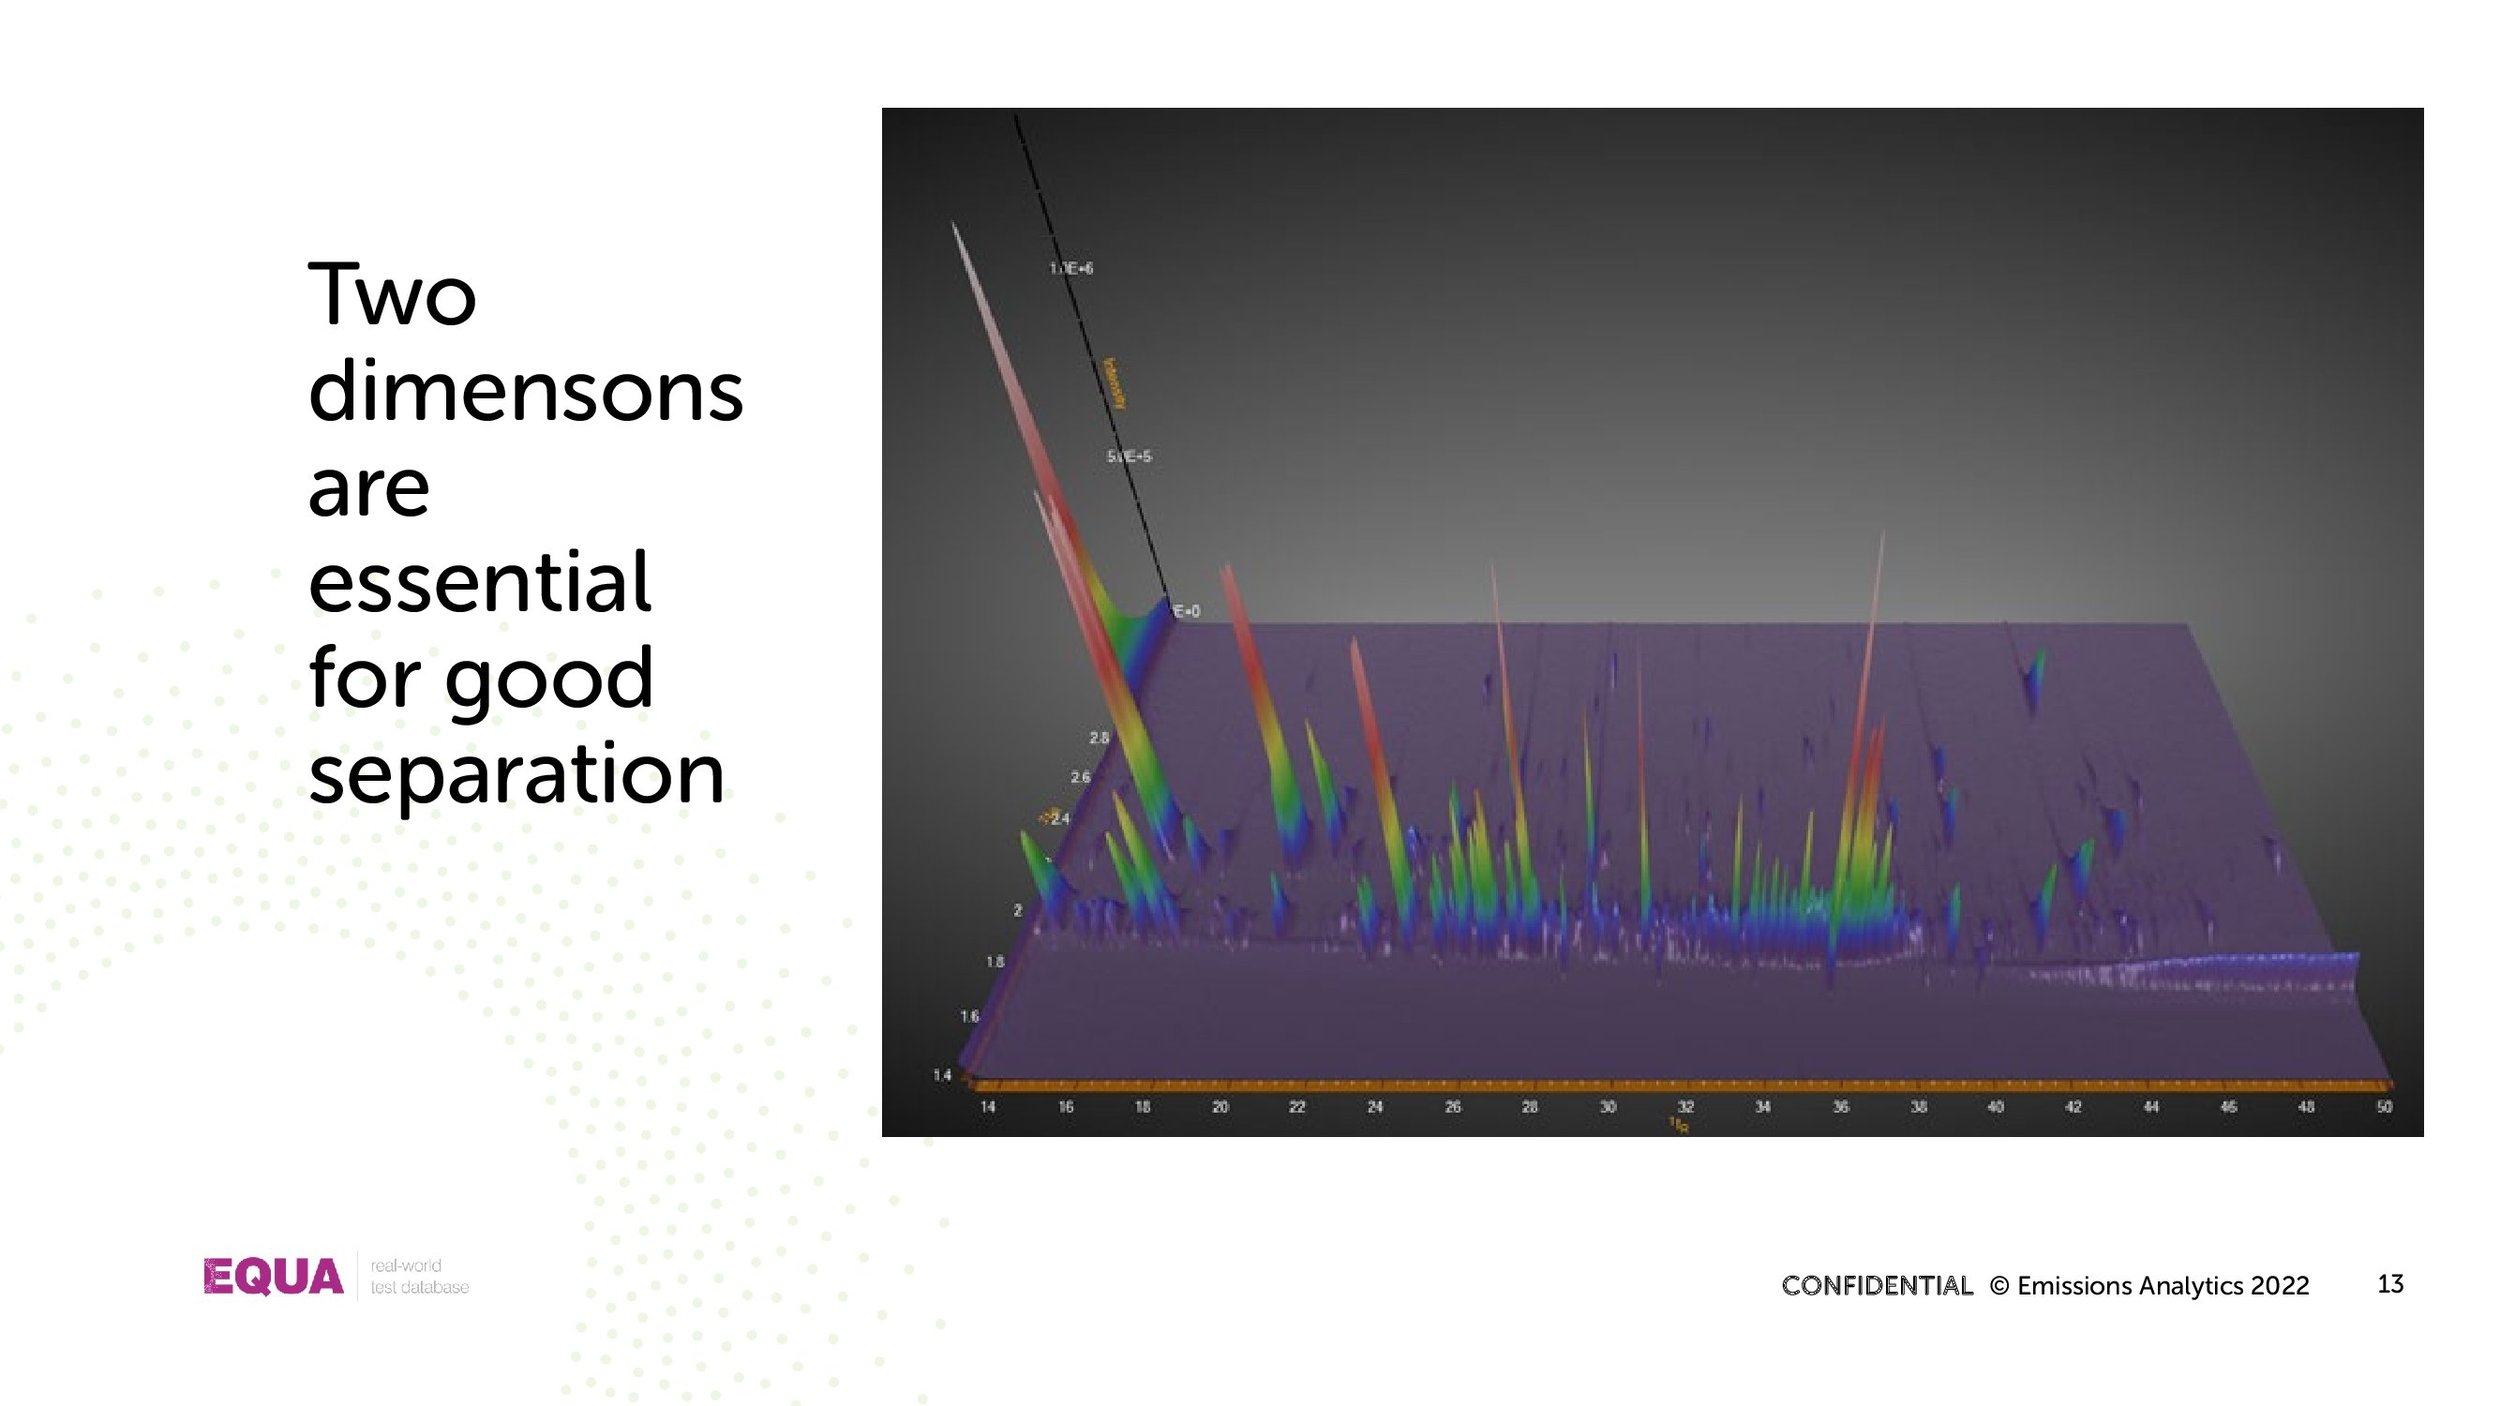
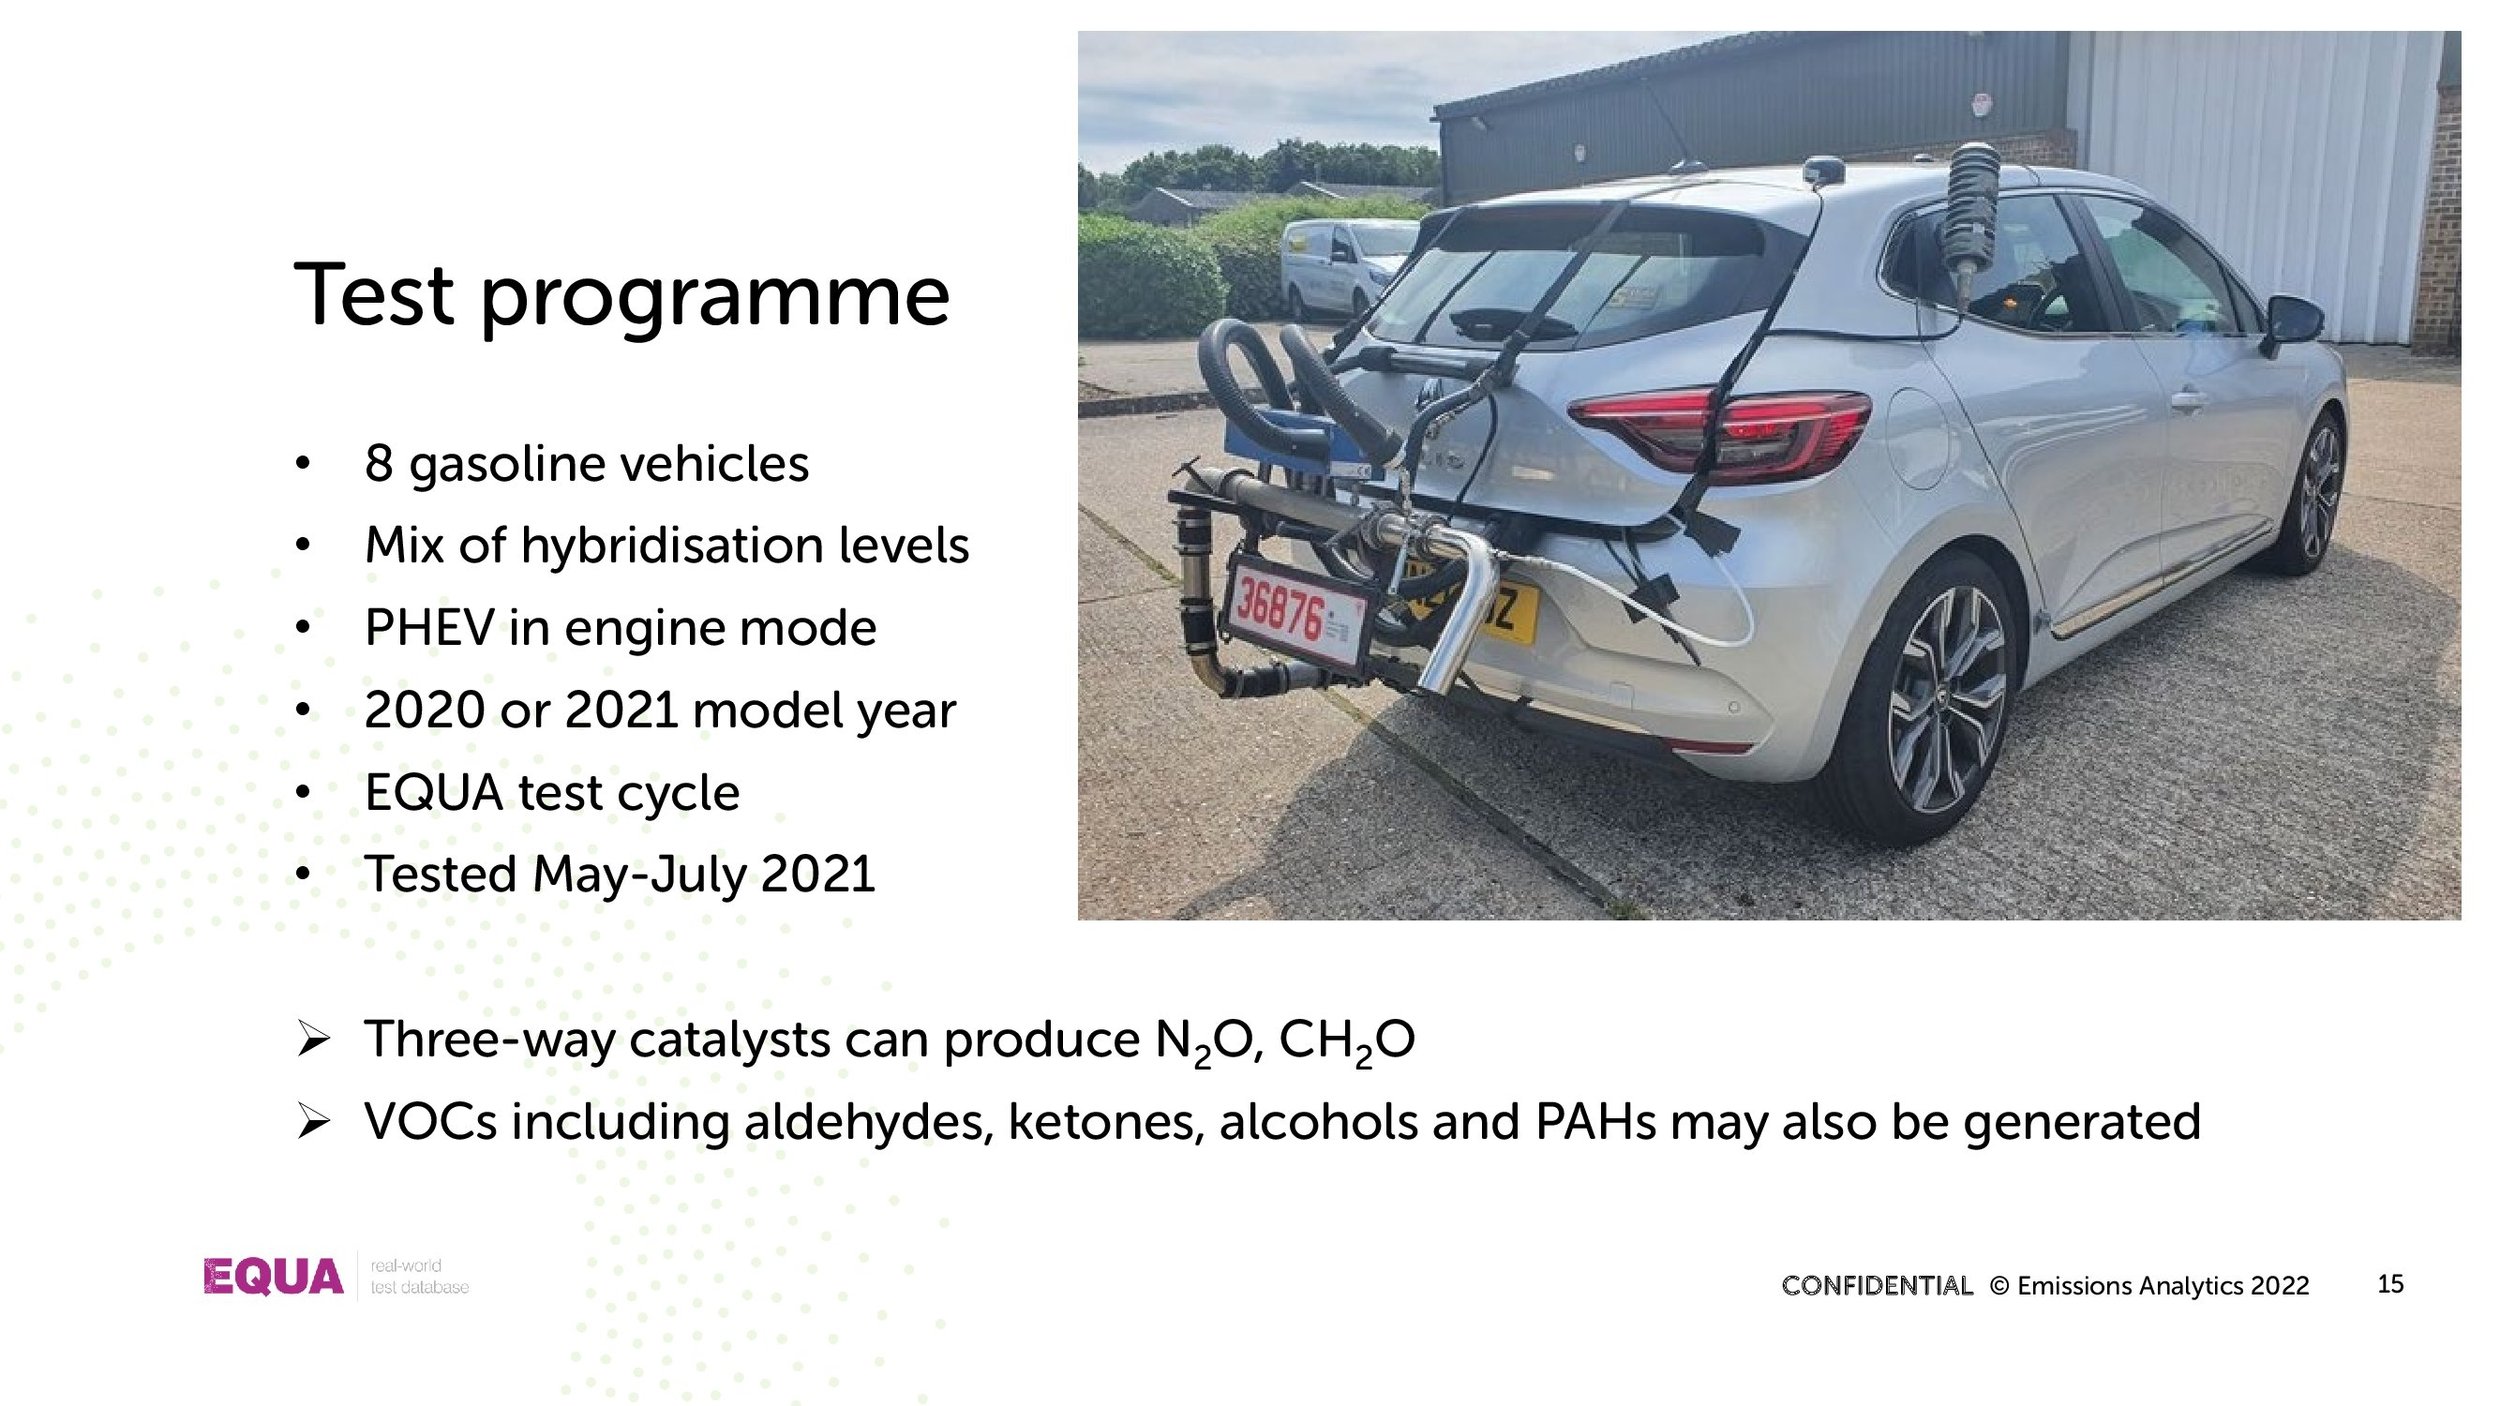
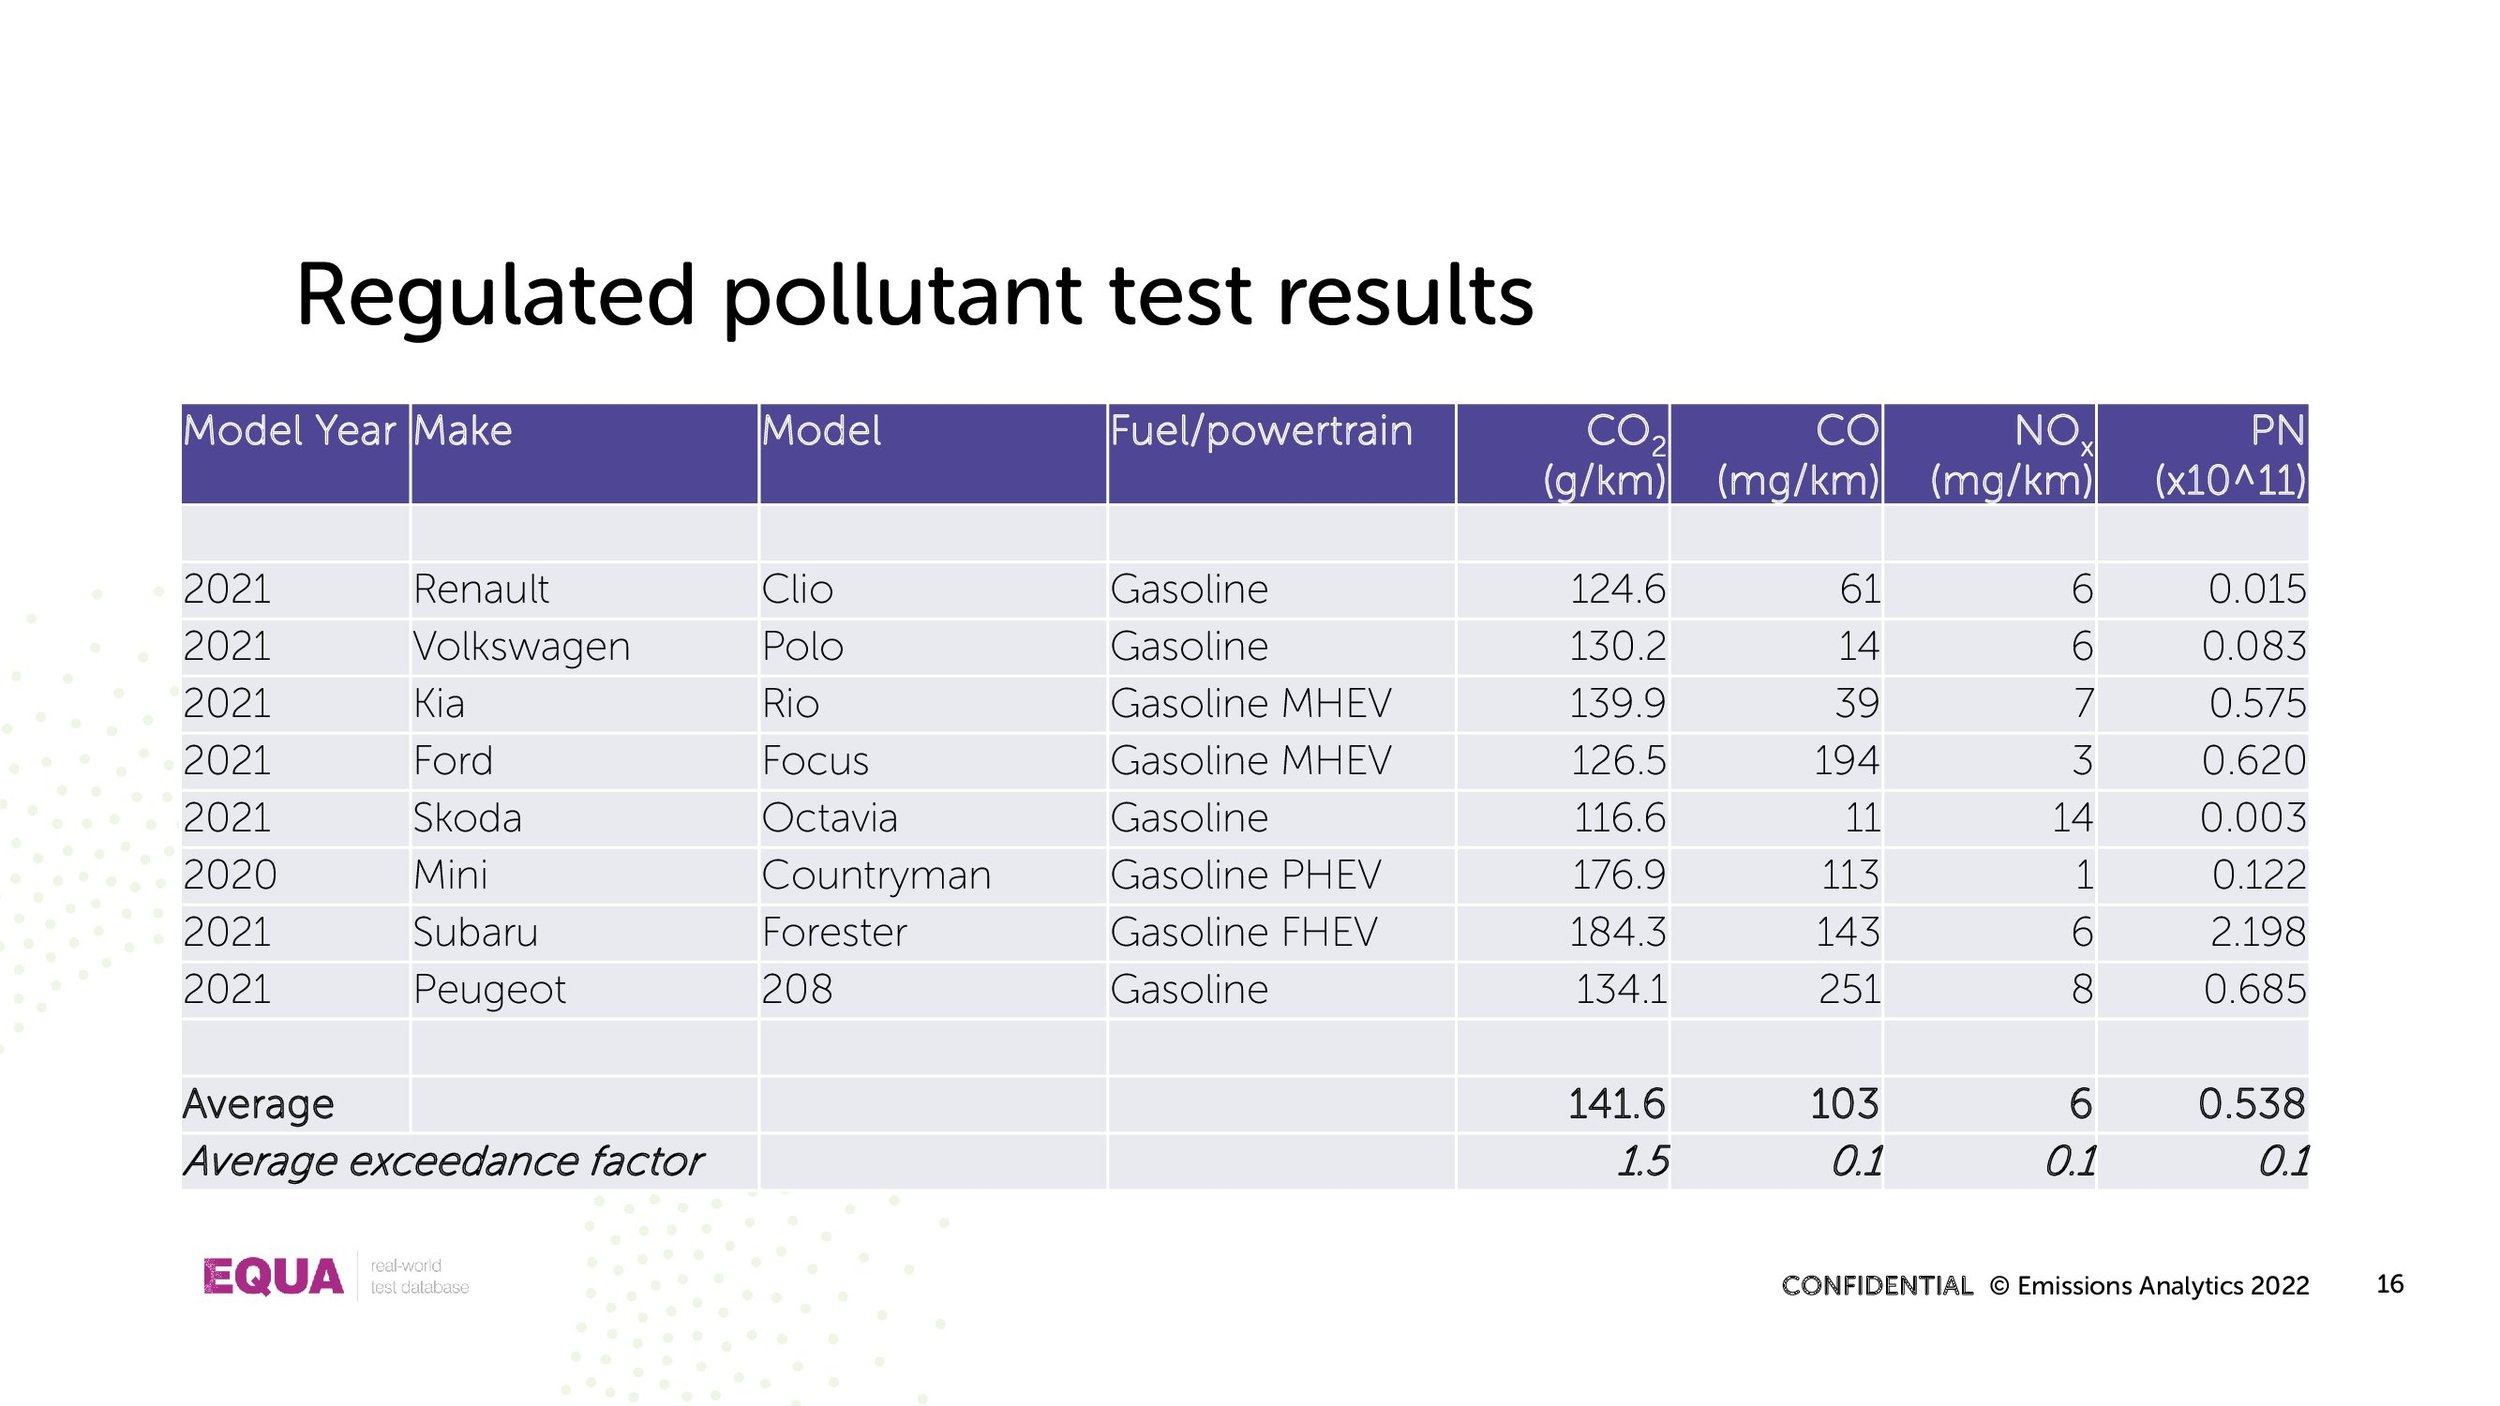
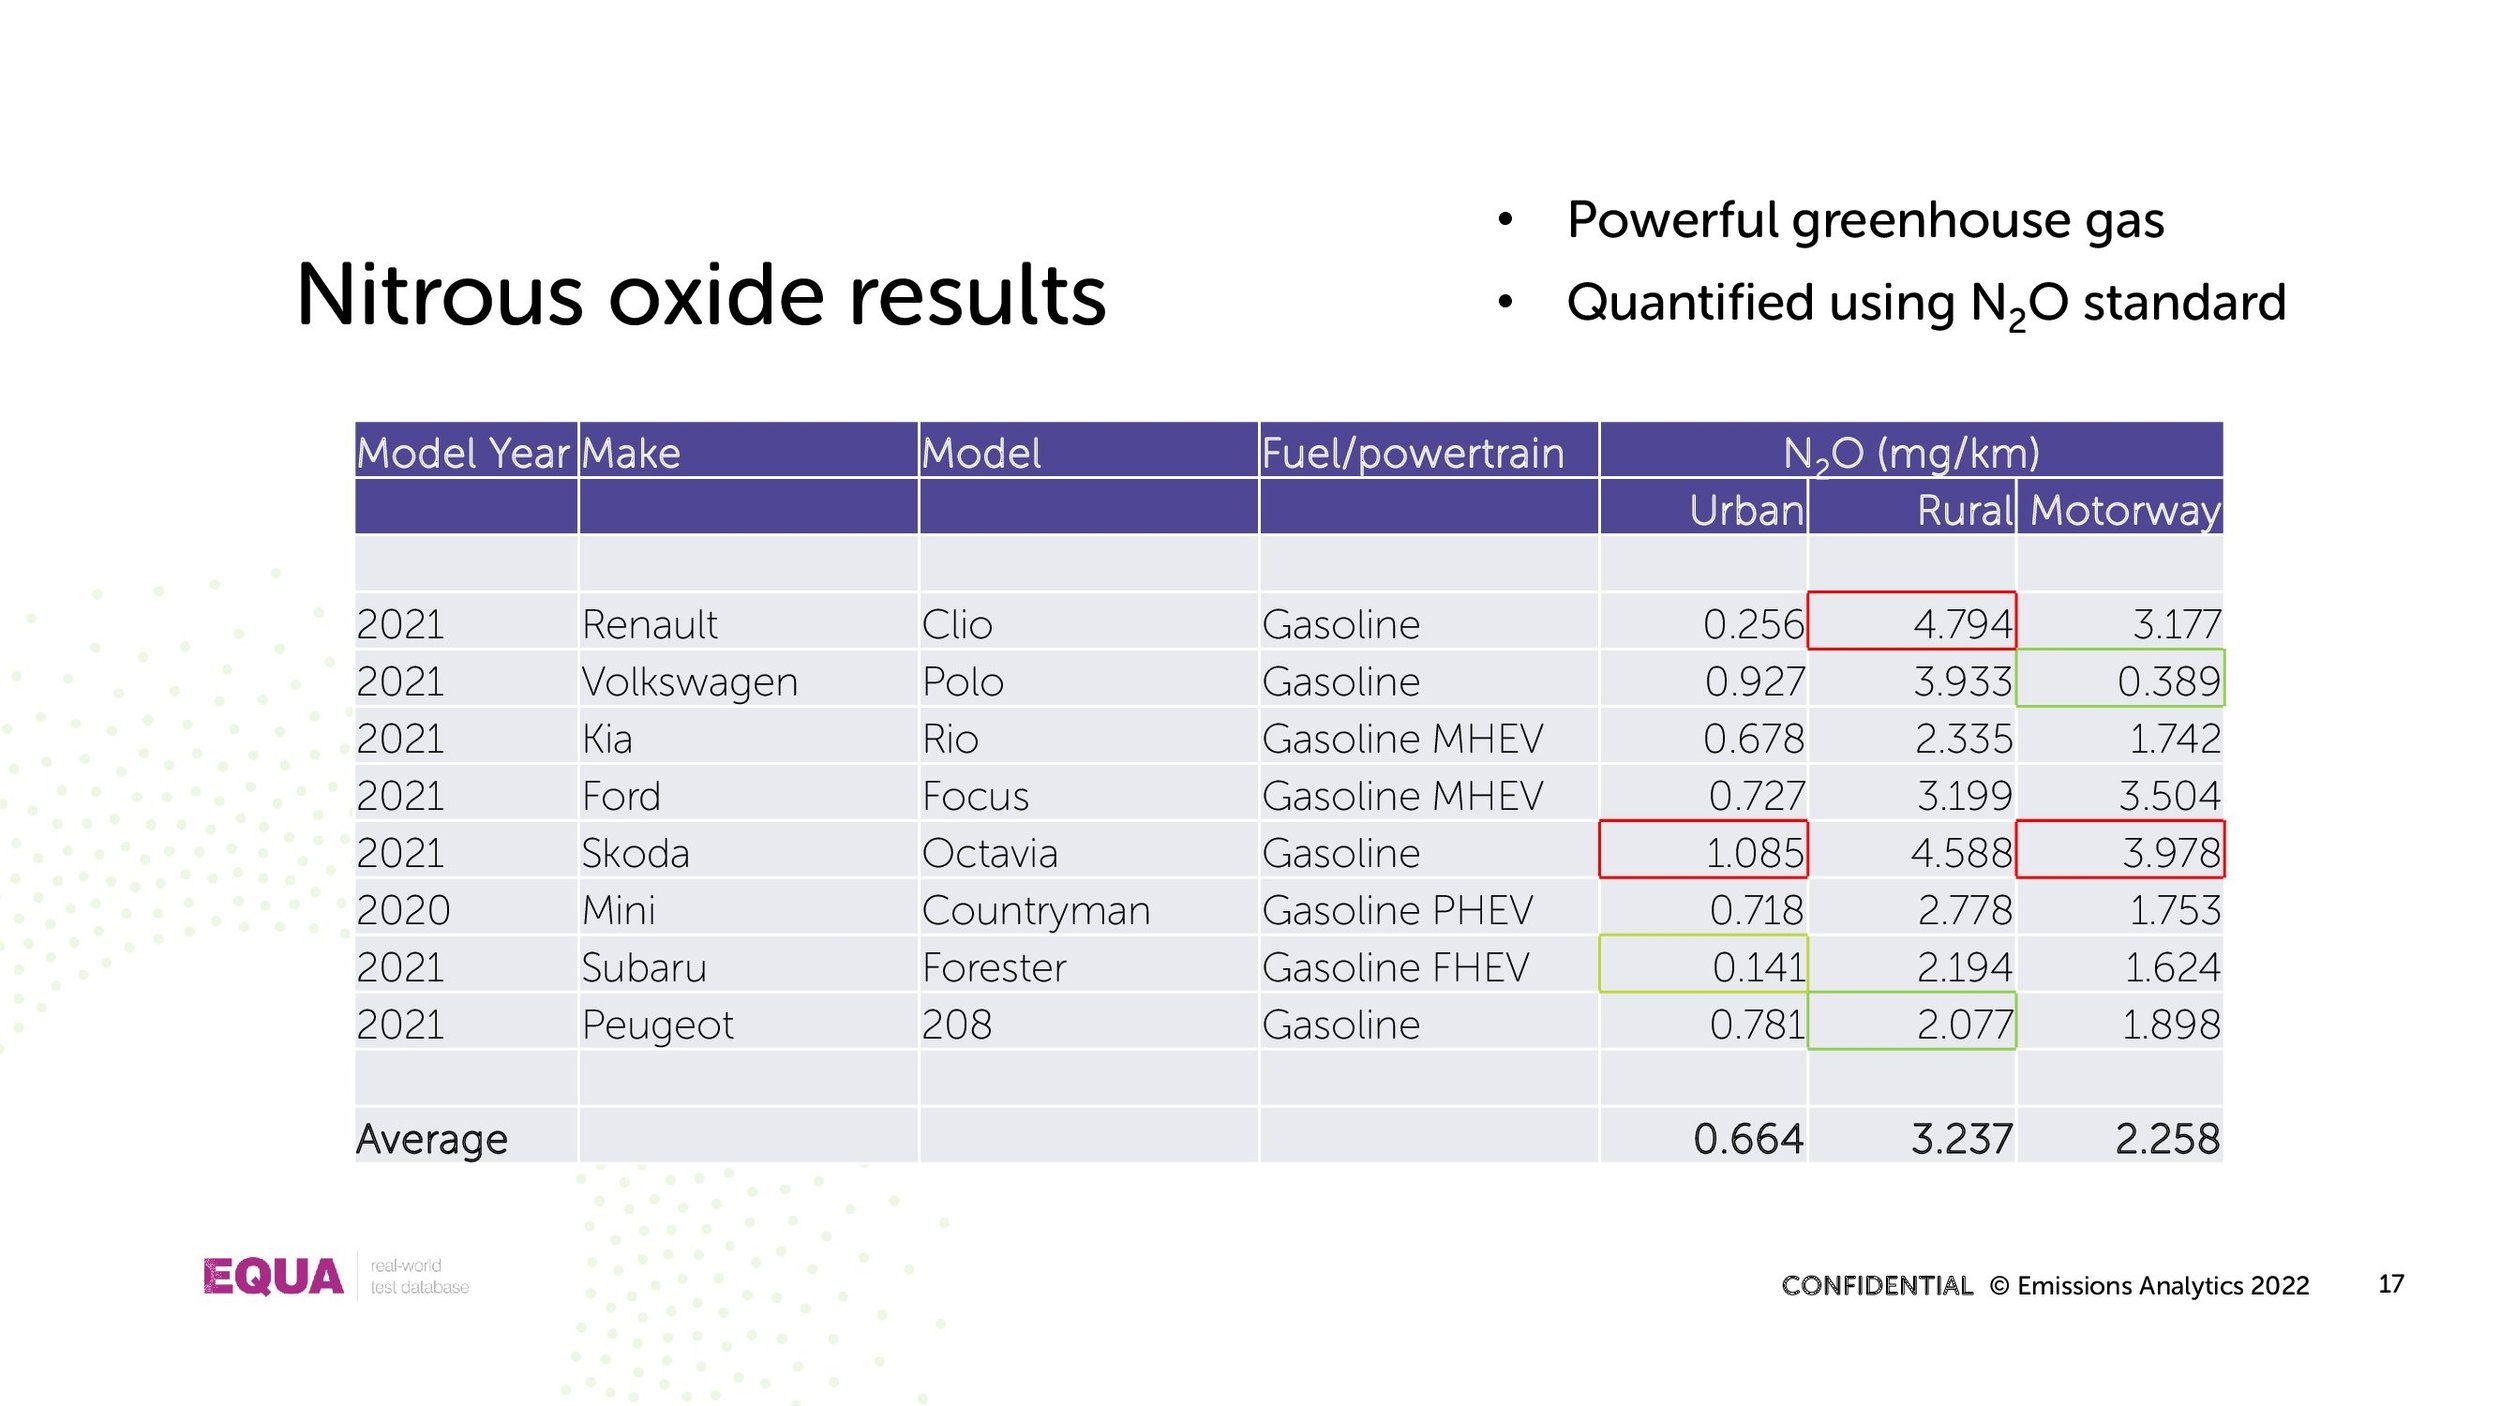
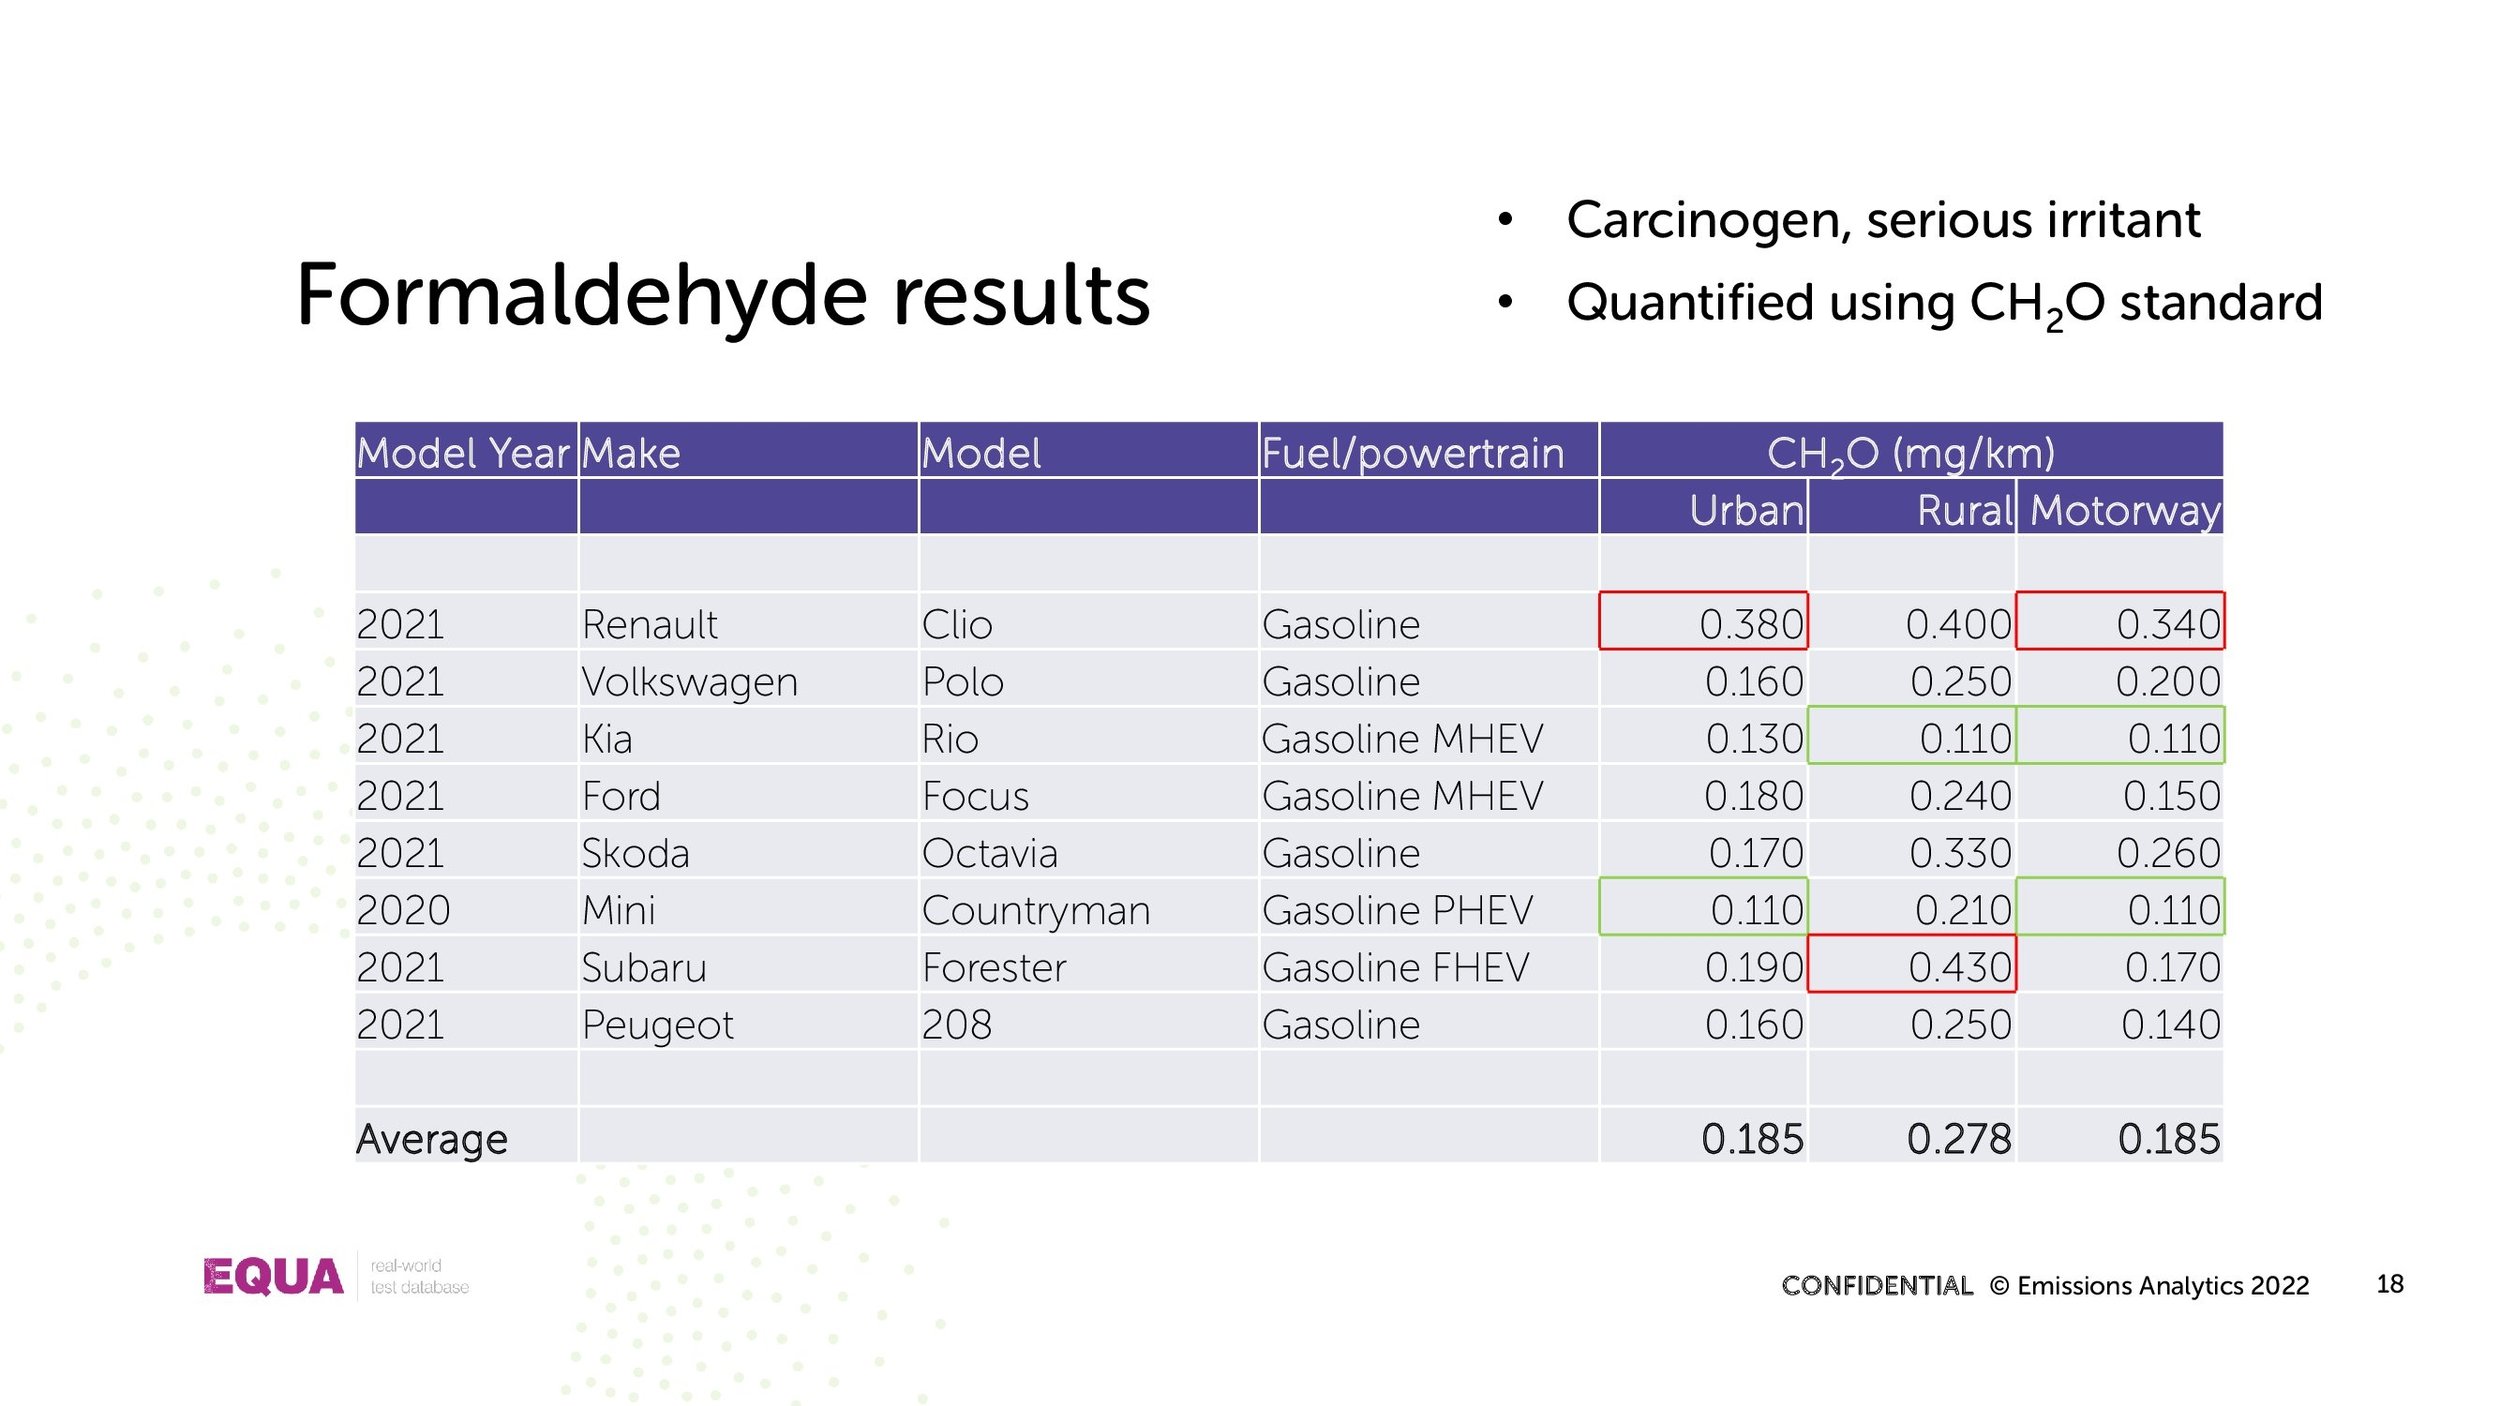
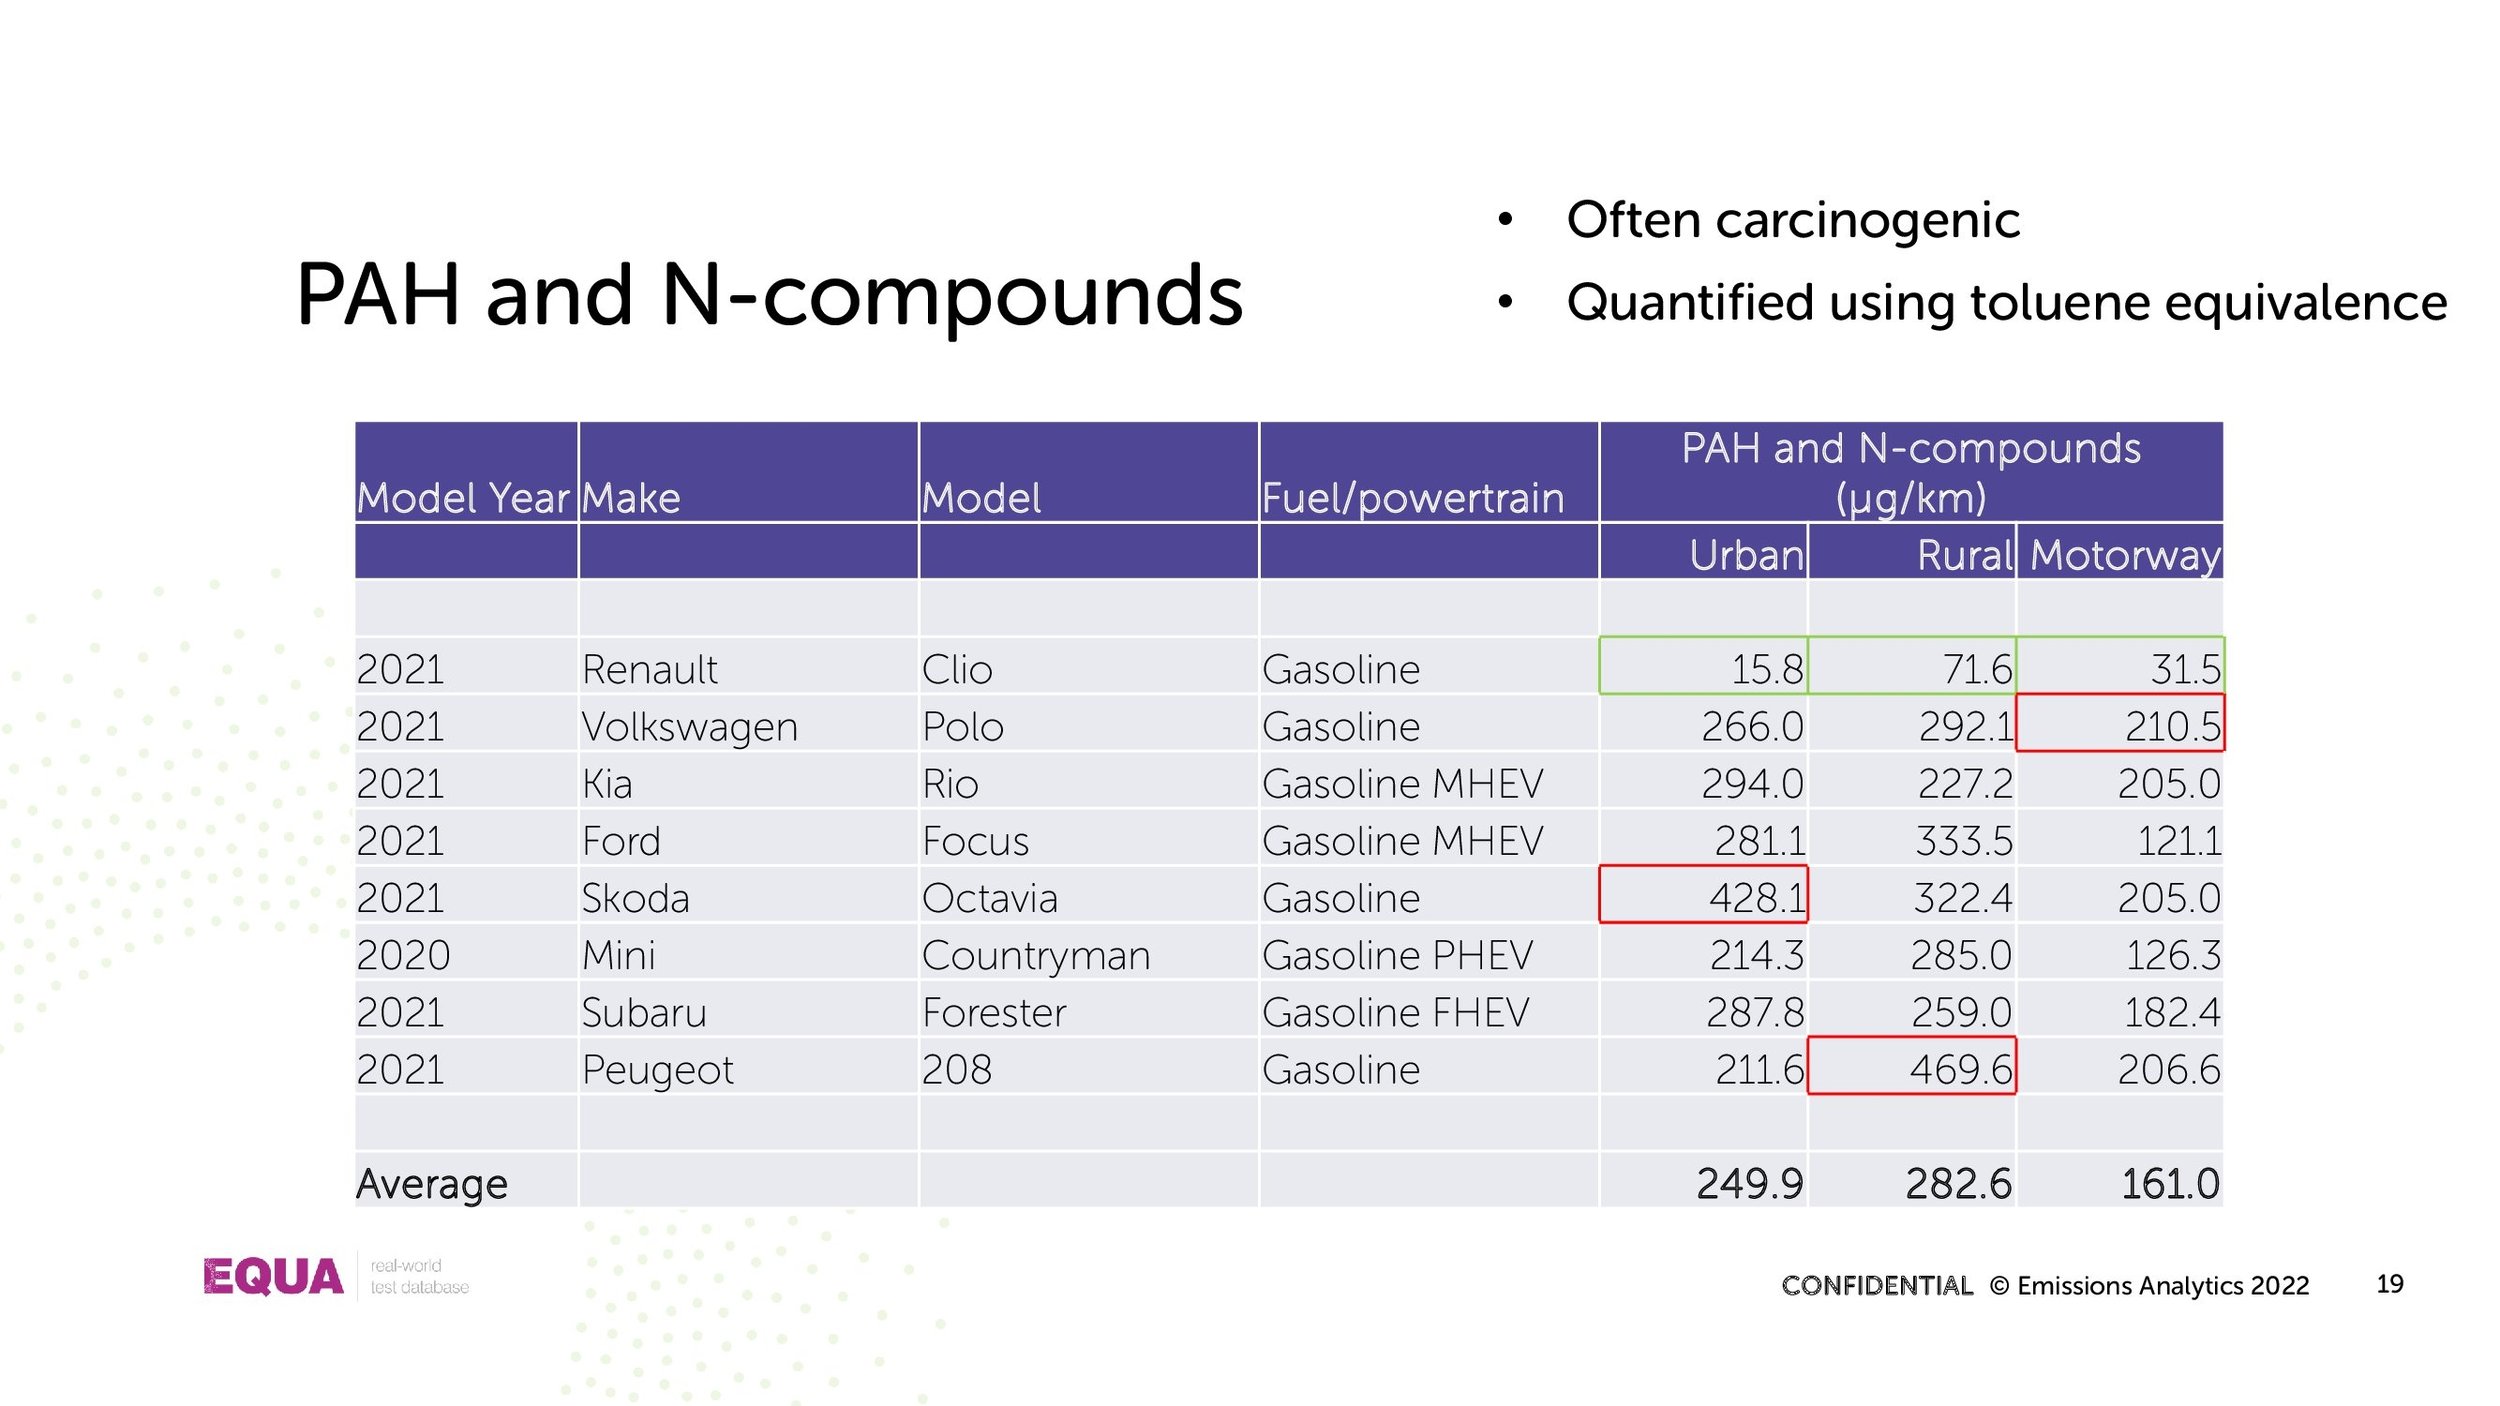
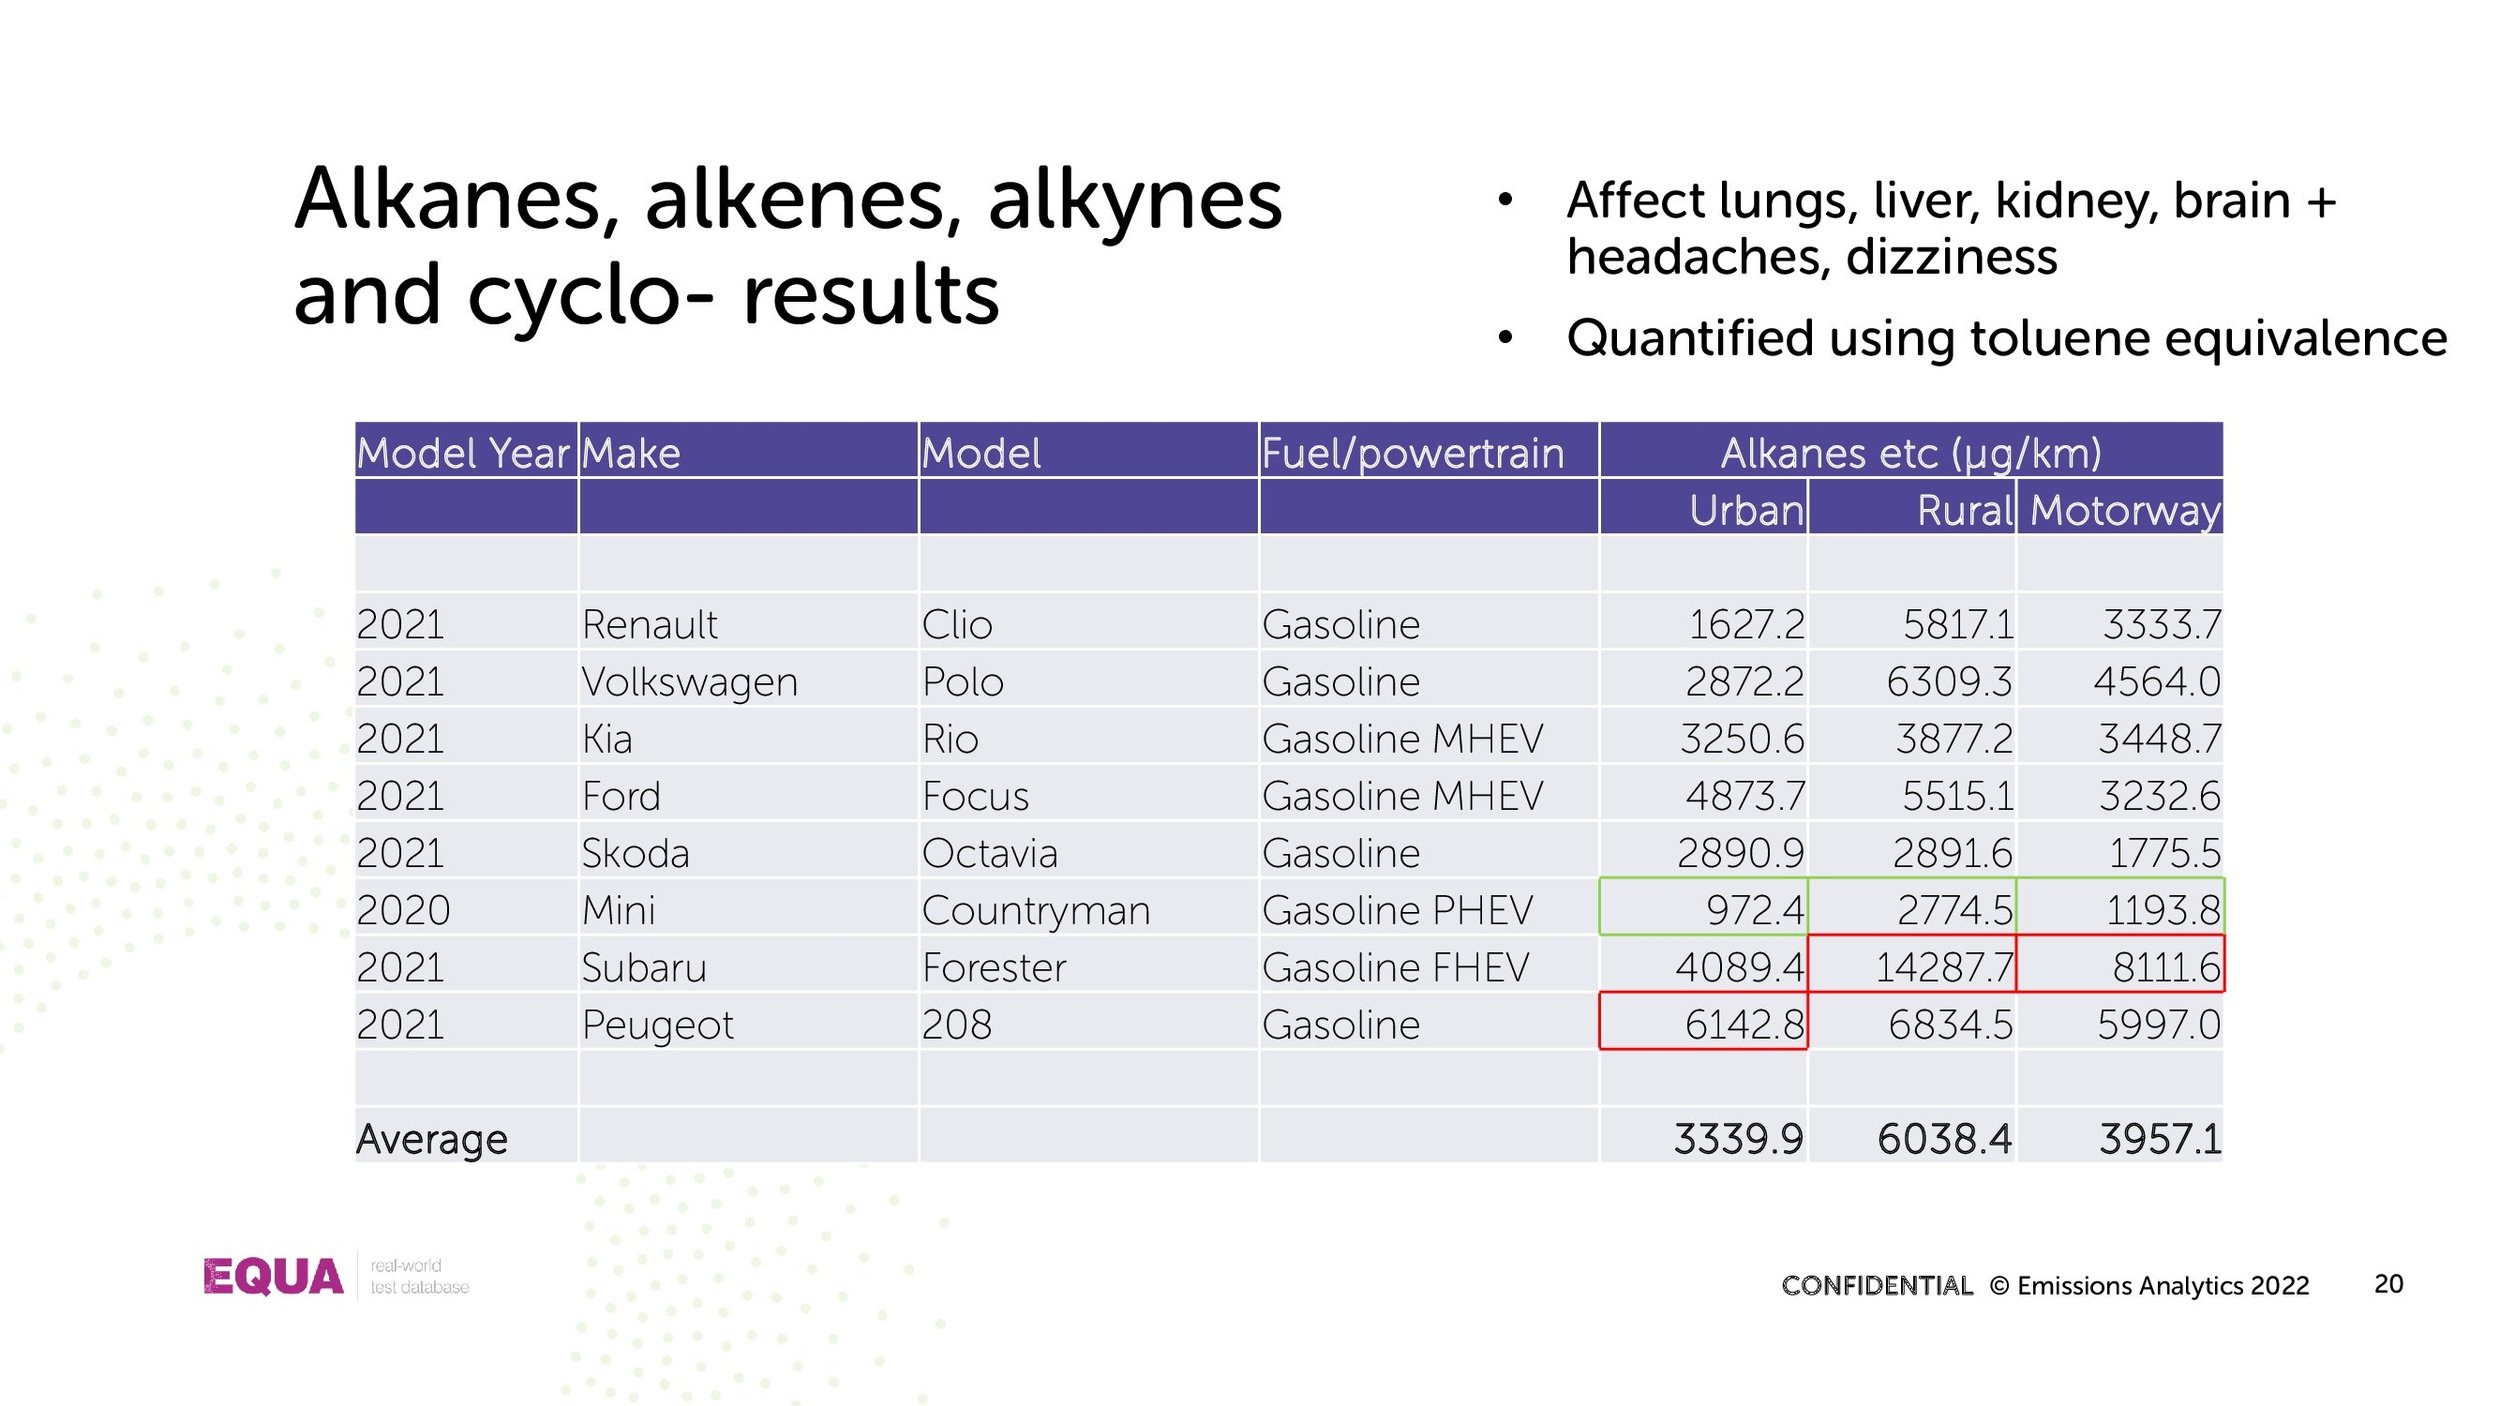
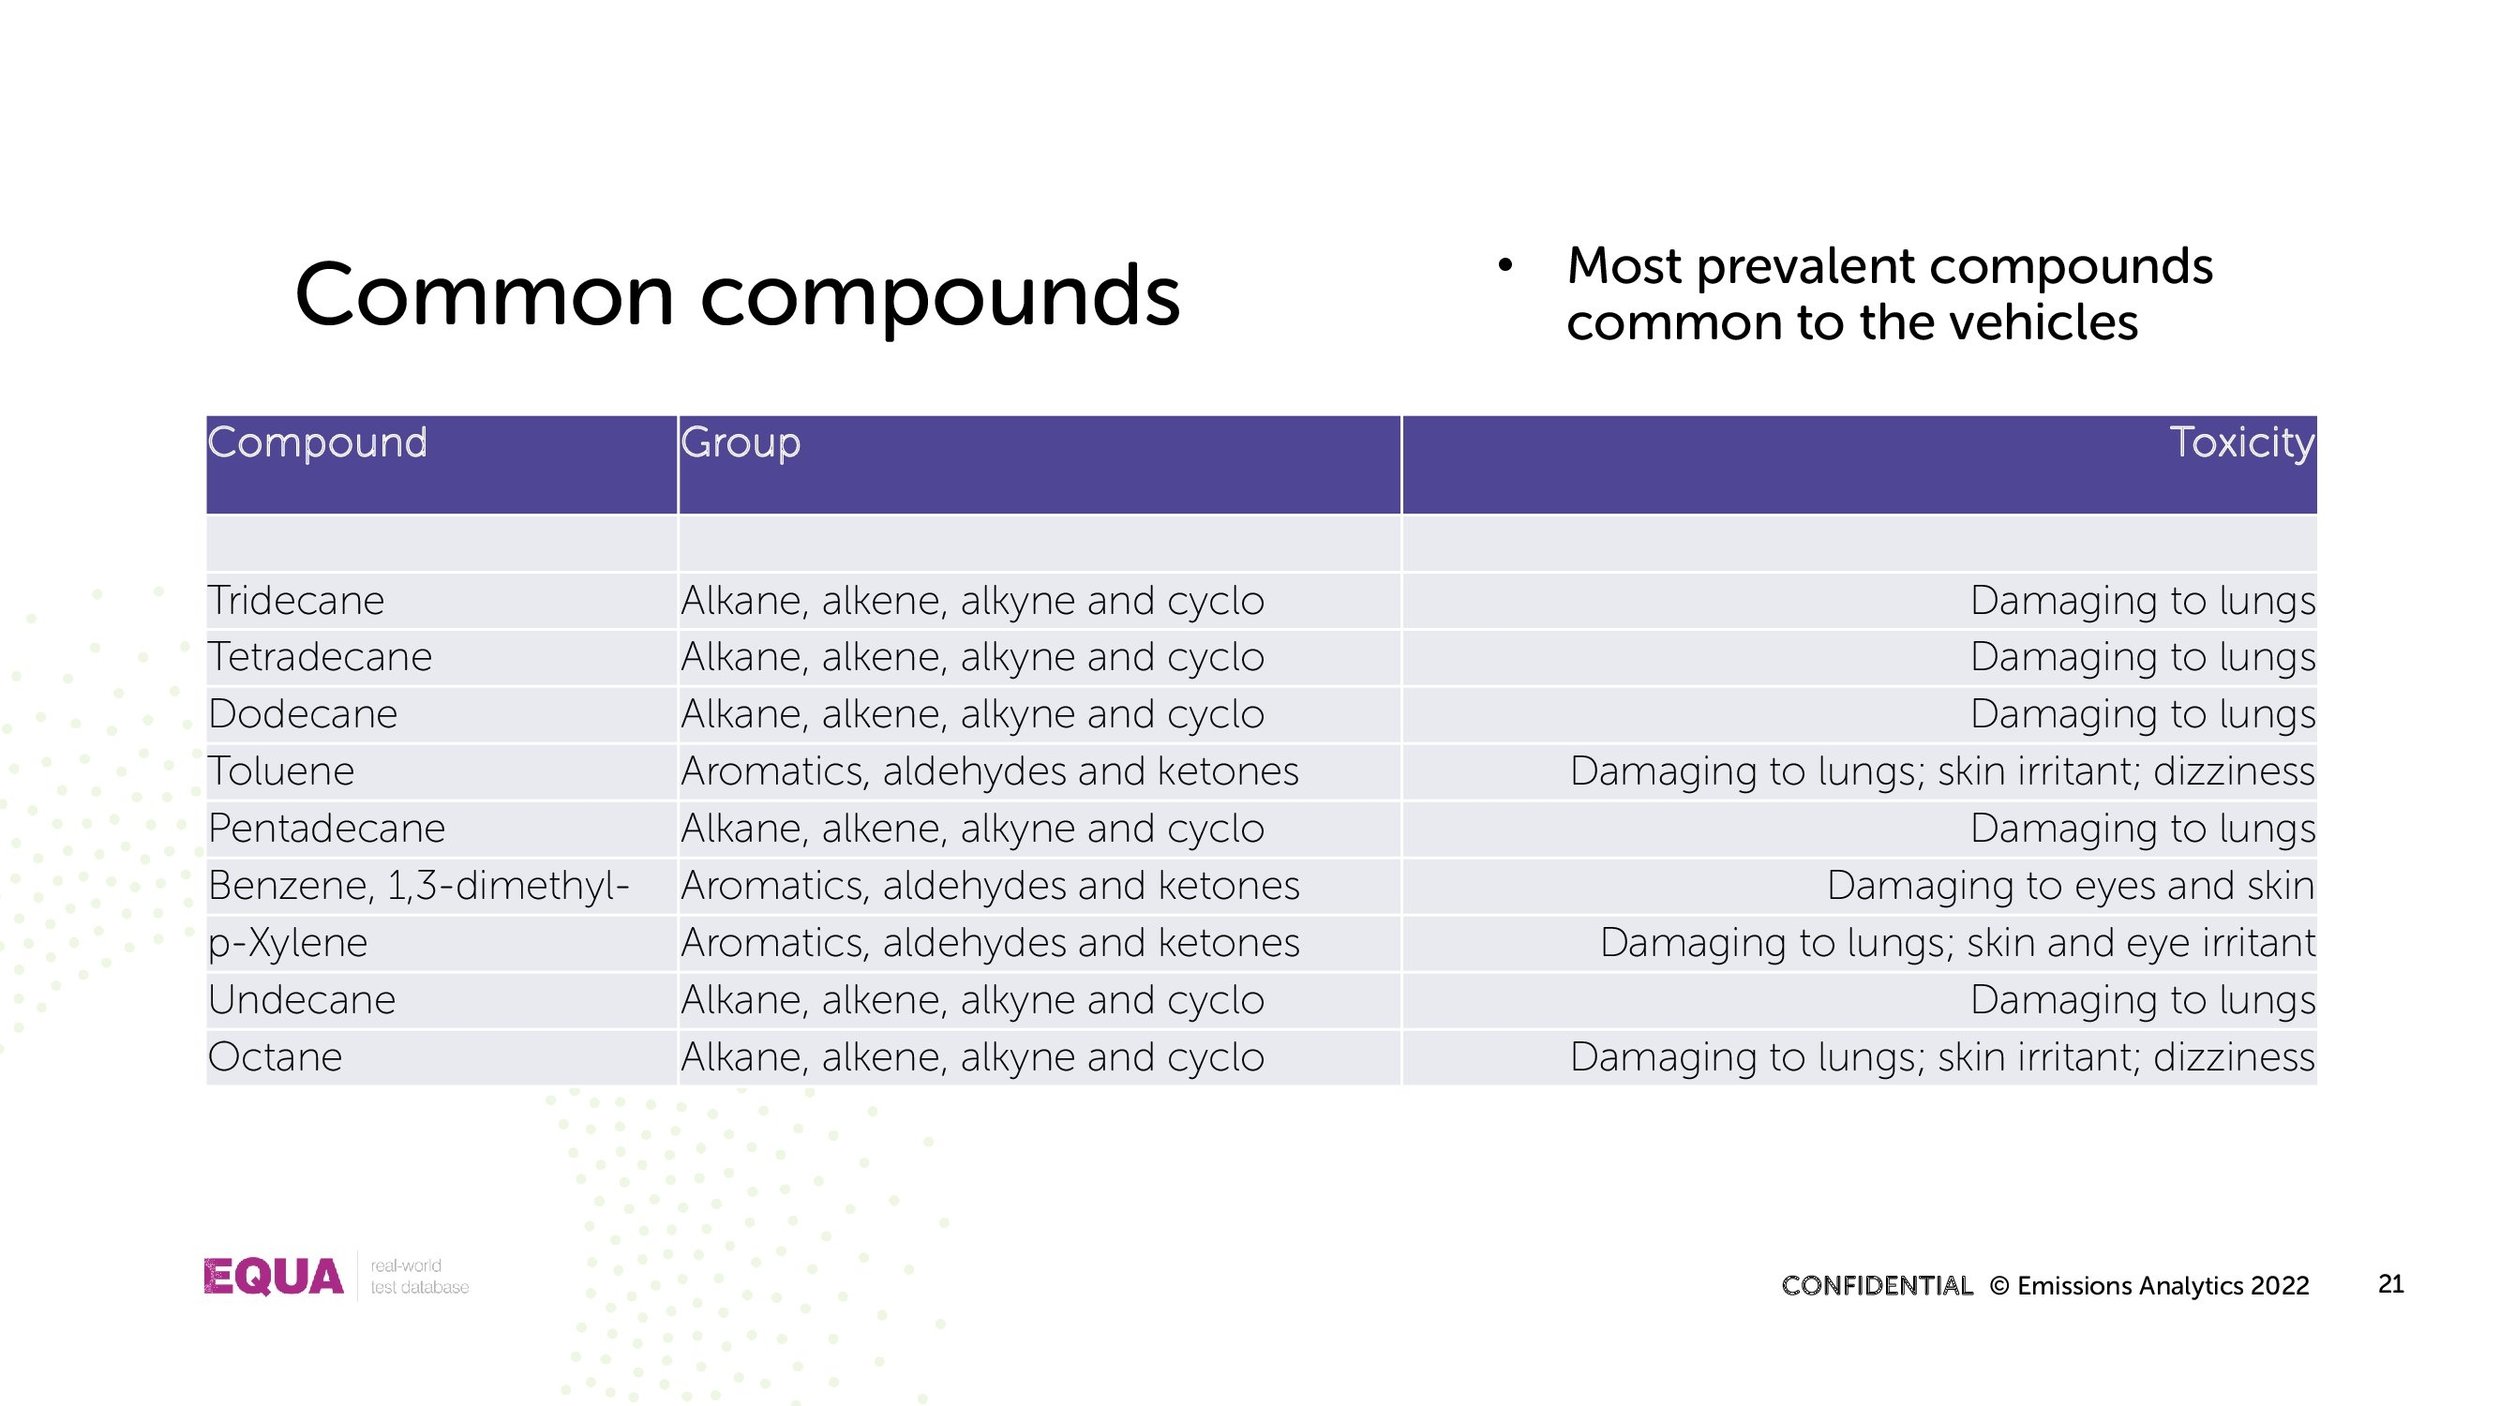
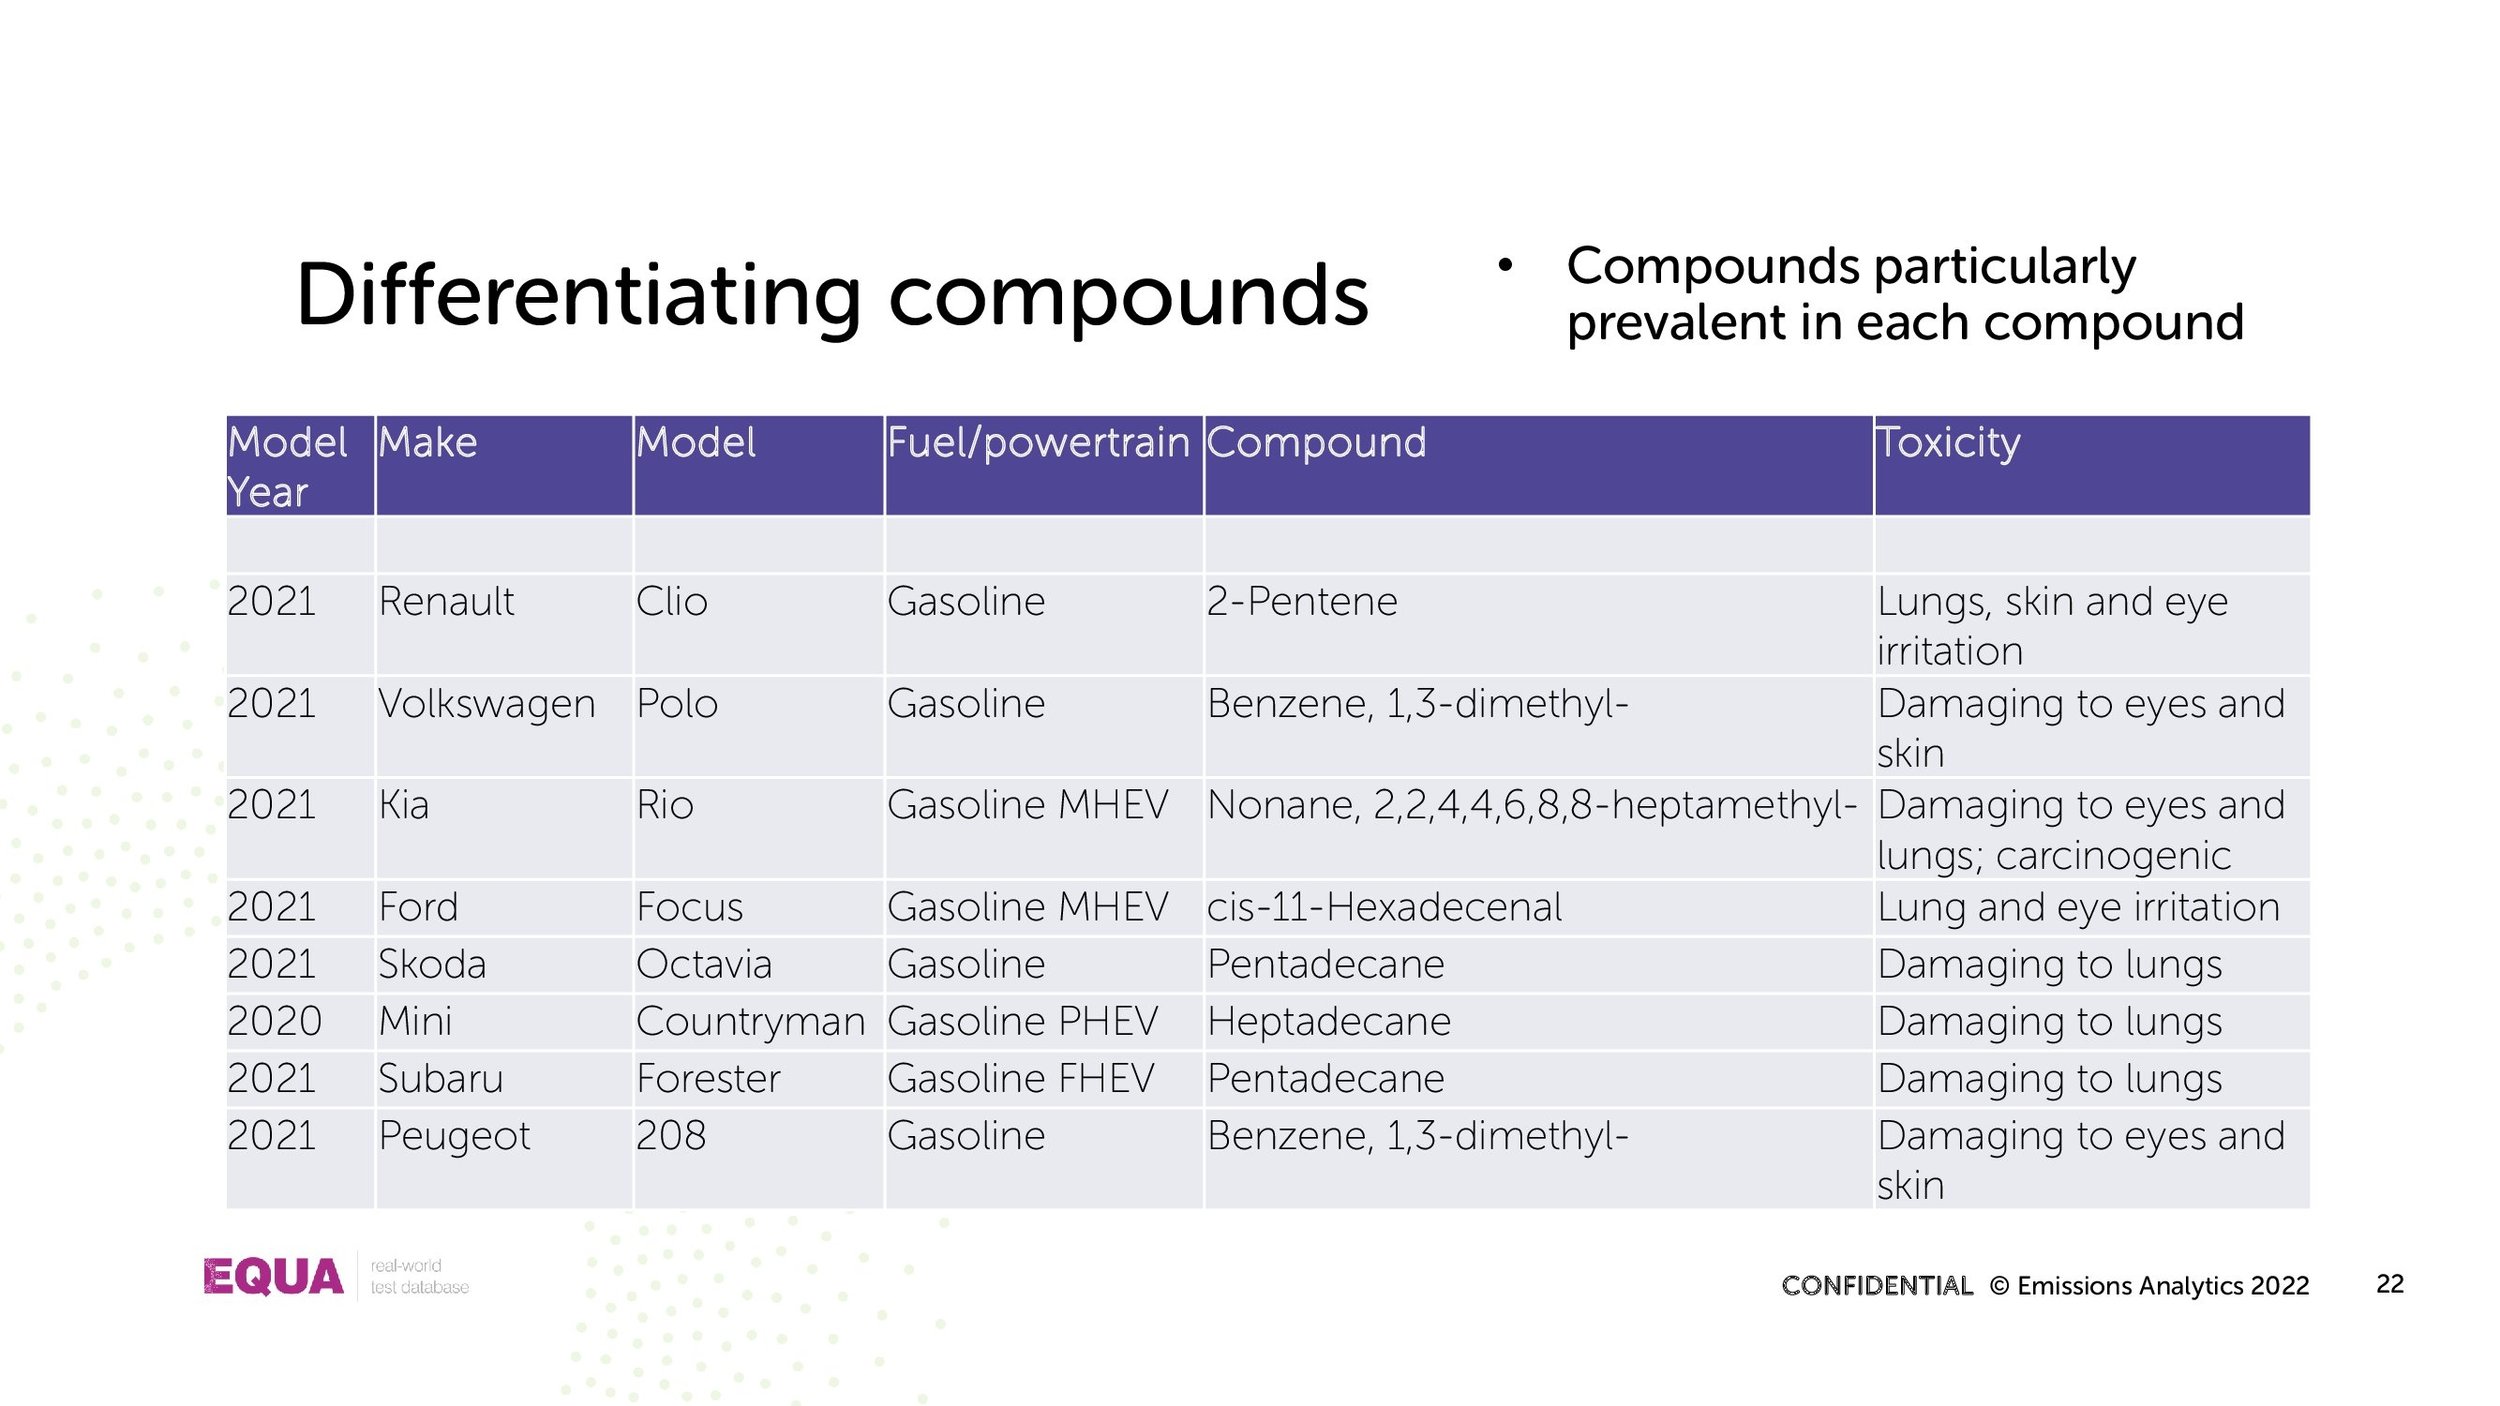
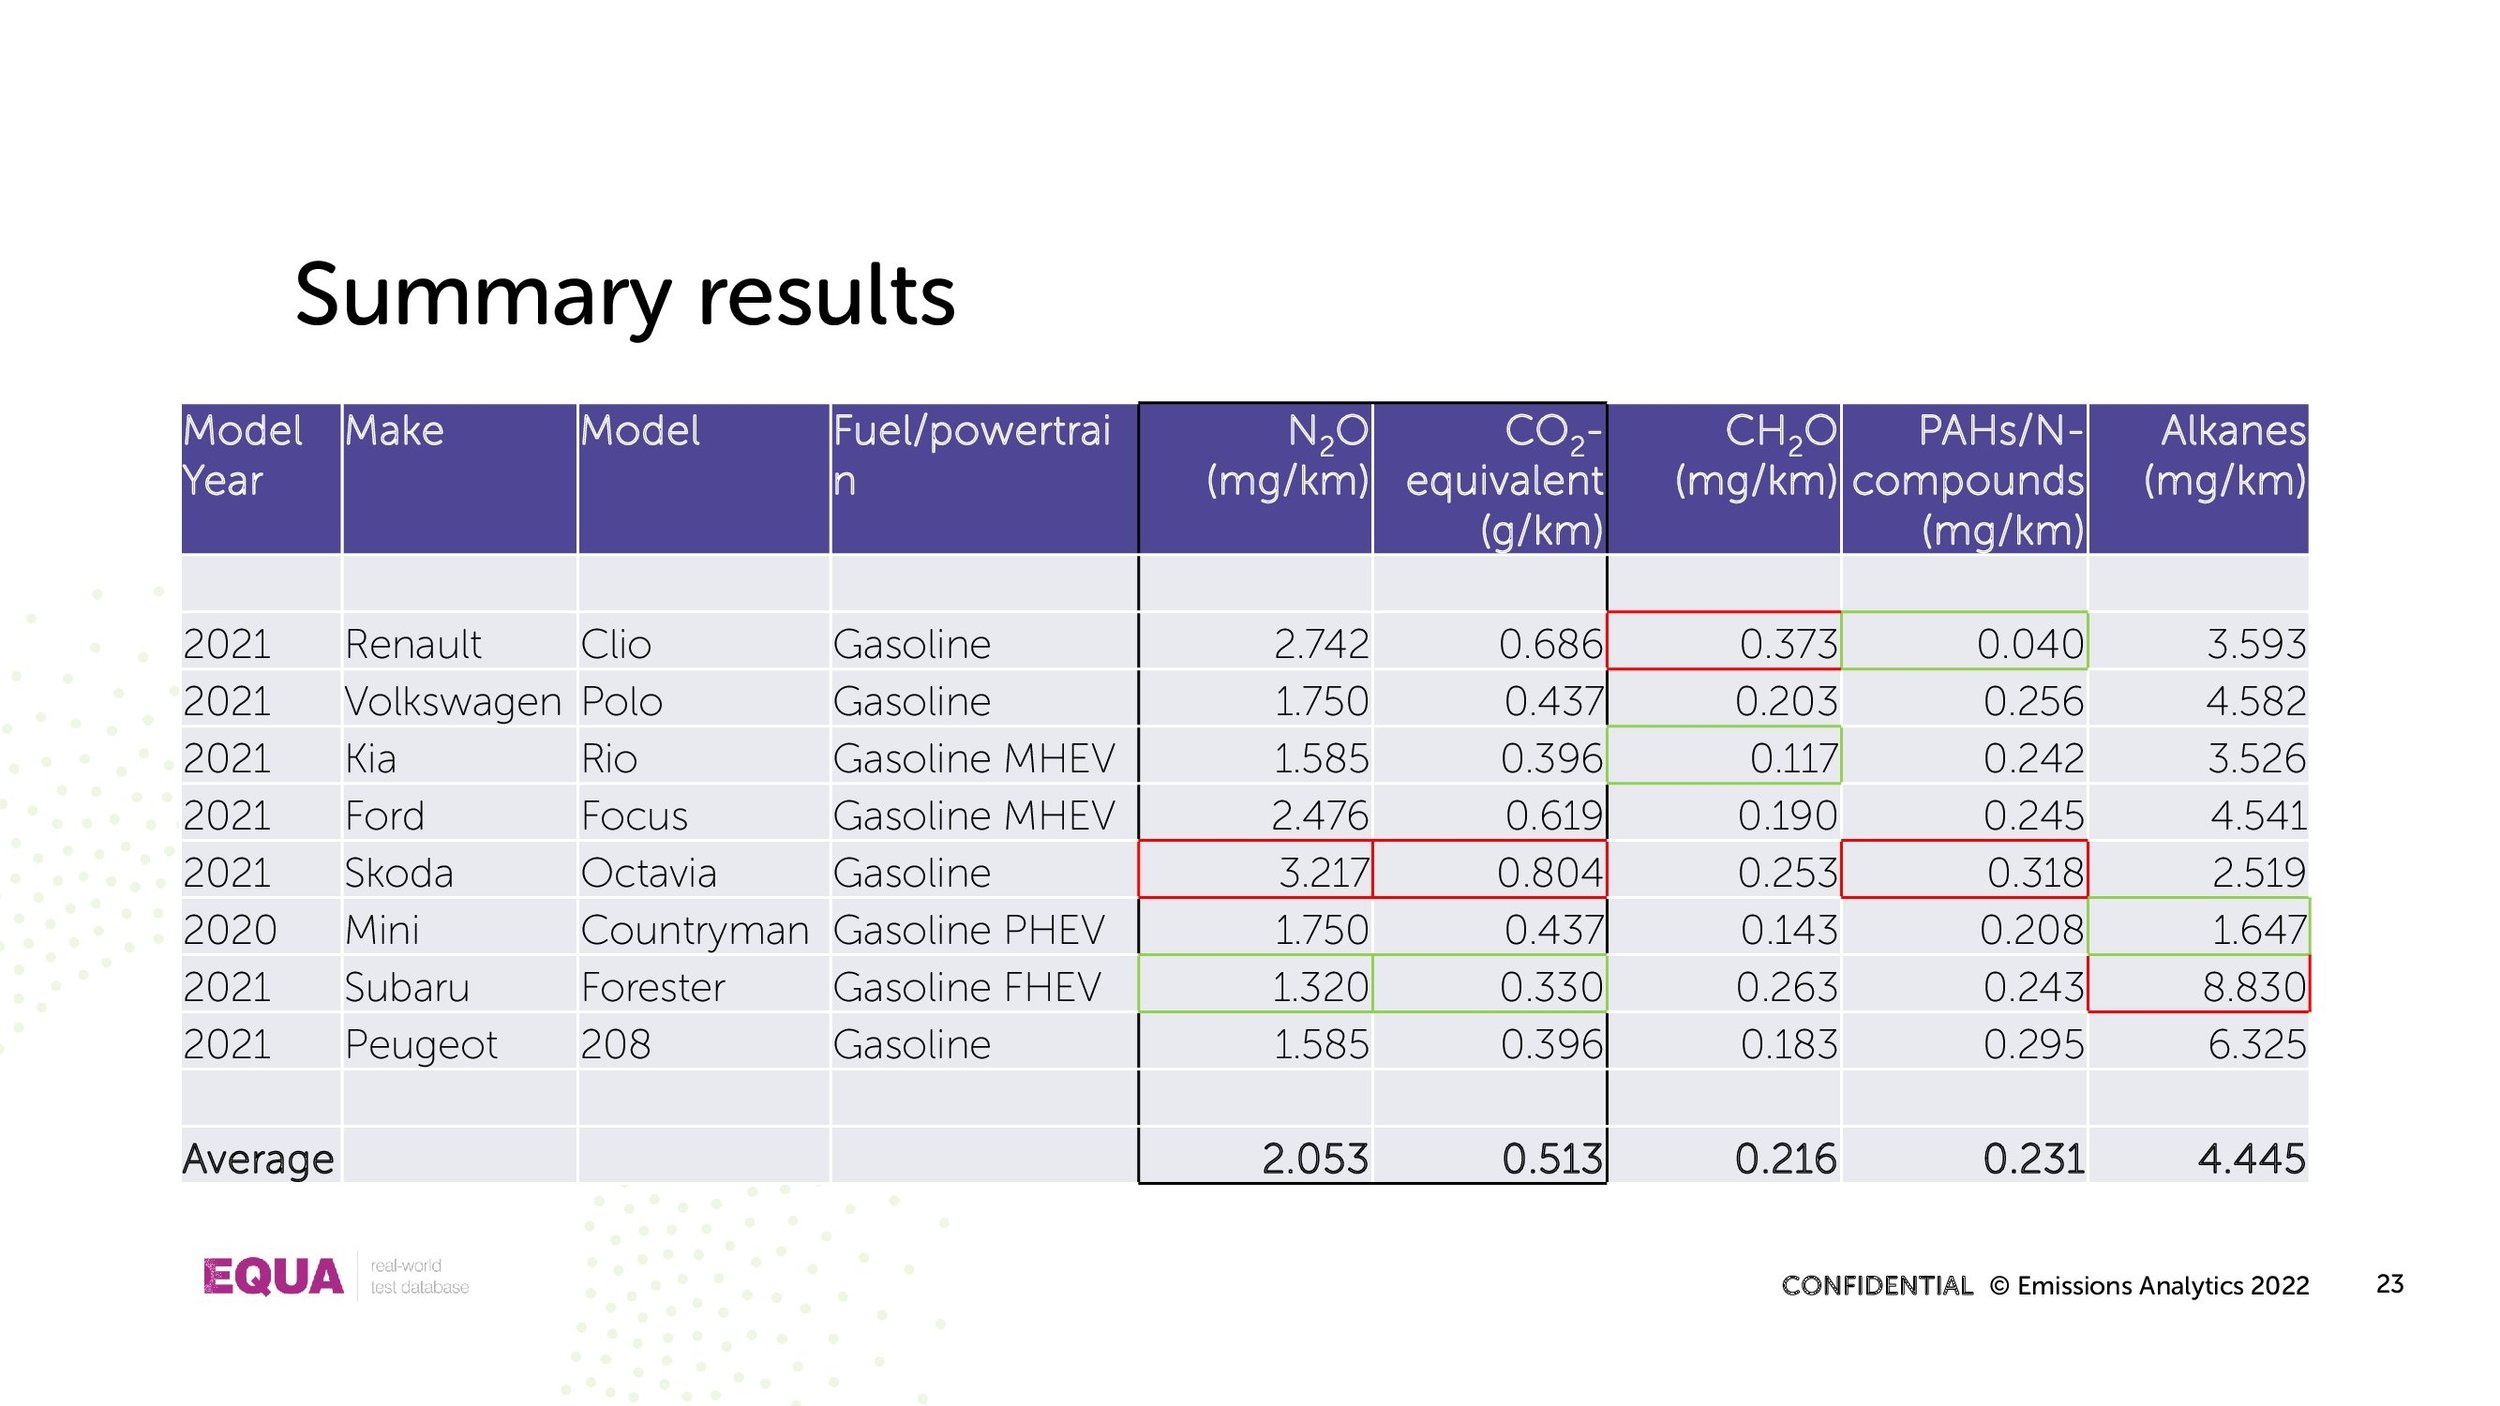


Presentation: CRC Oral Presentation March 2022
Our CEO & Founder, Nick Molden recently spoke at the annual CRC Real World Emissions Workshop.
Our CEO & Founder, Nick Molden recently spoke at the annual CRC Real World Emissions Workshop.
In this presentation, Nick discusses: Chemical fingerprinting tyres to understand tire wear emissions.
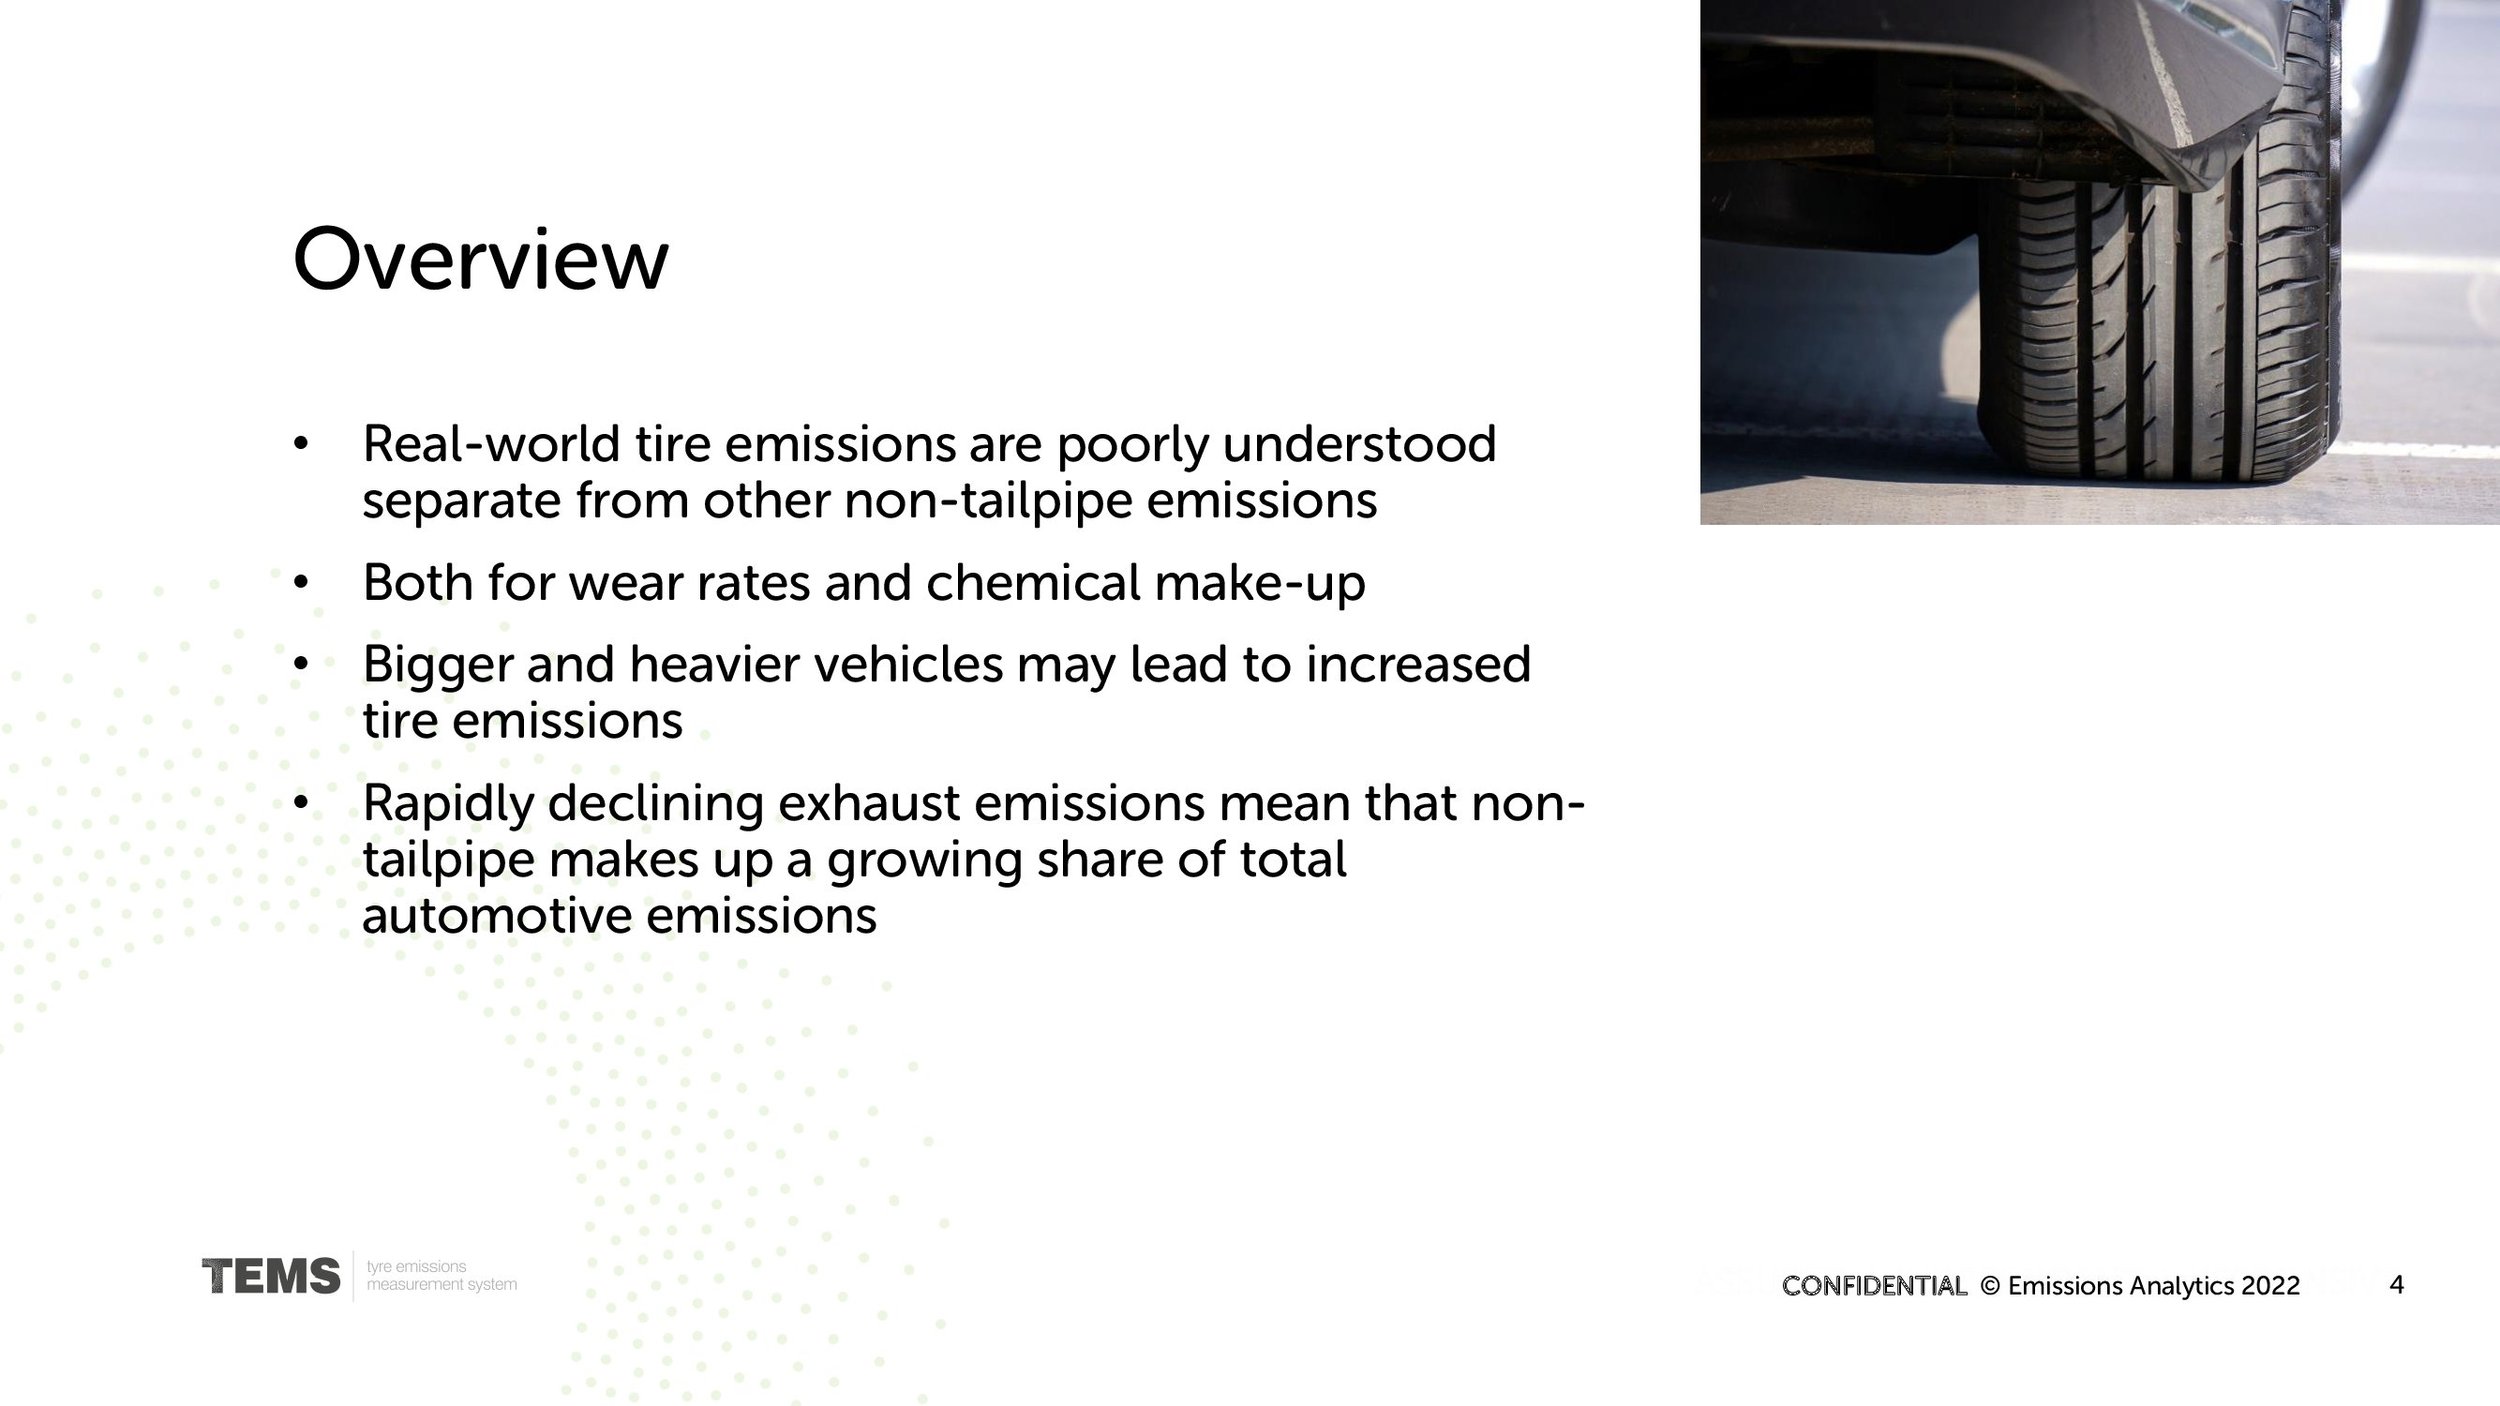

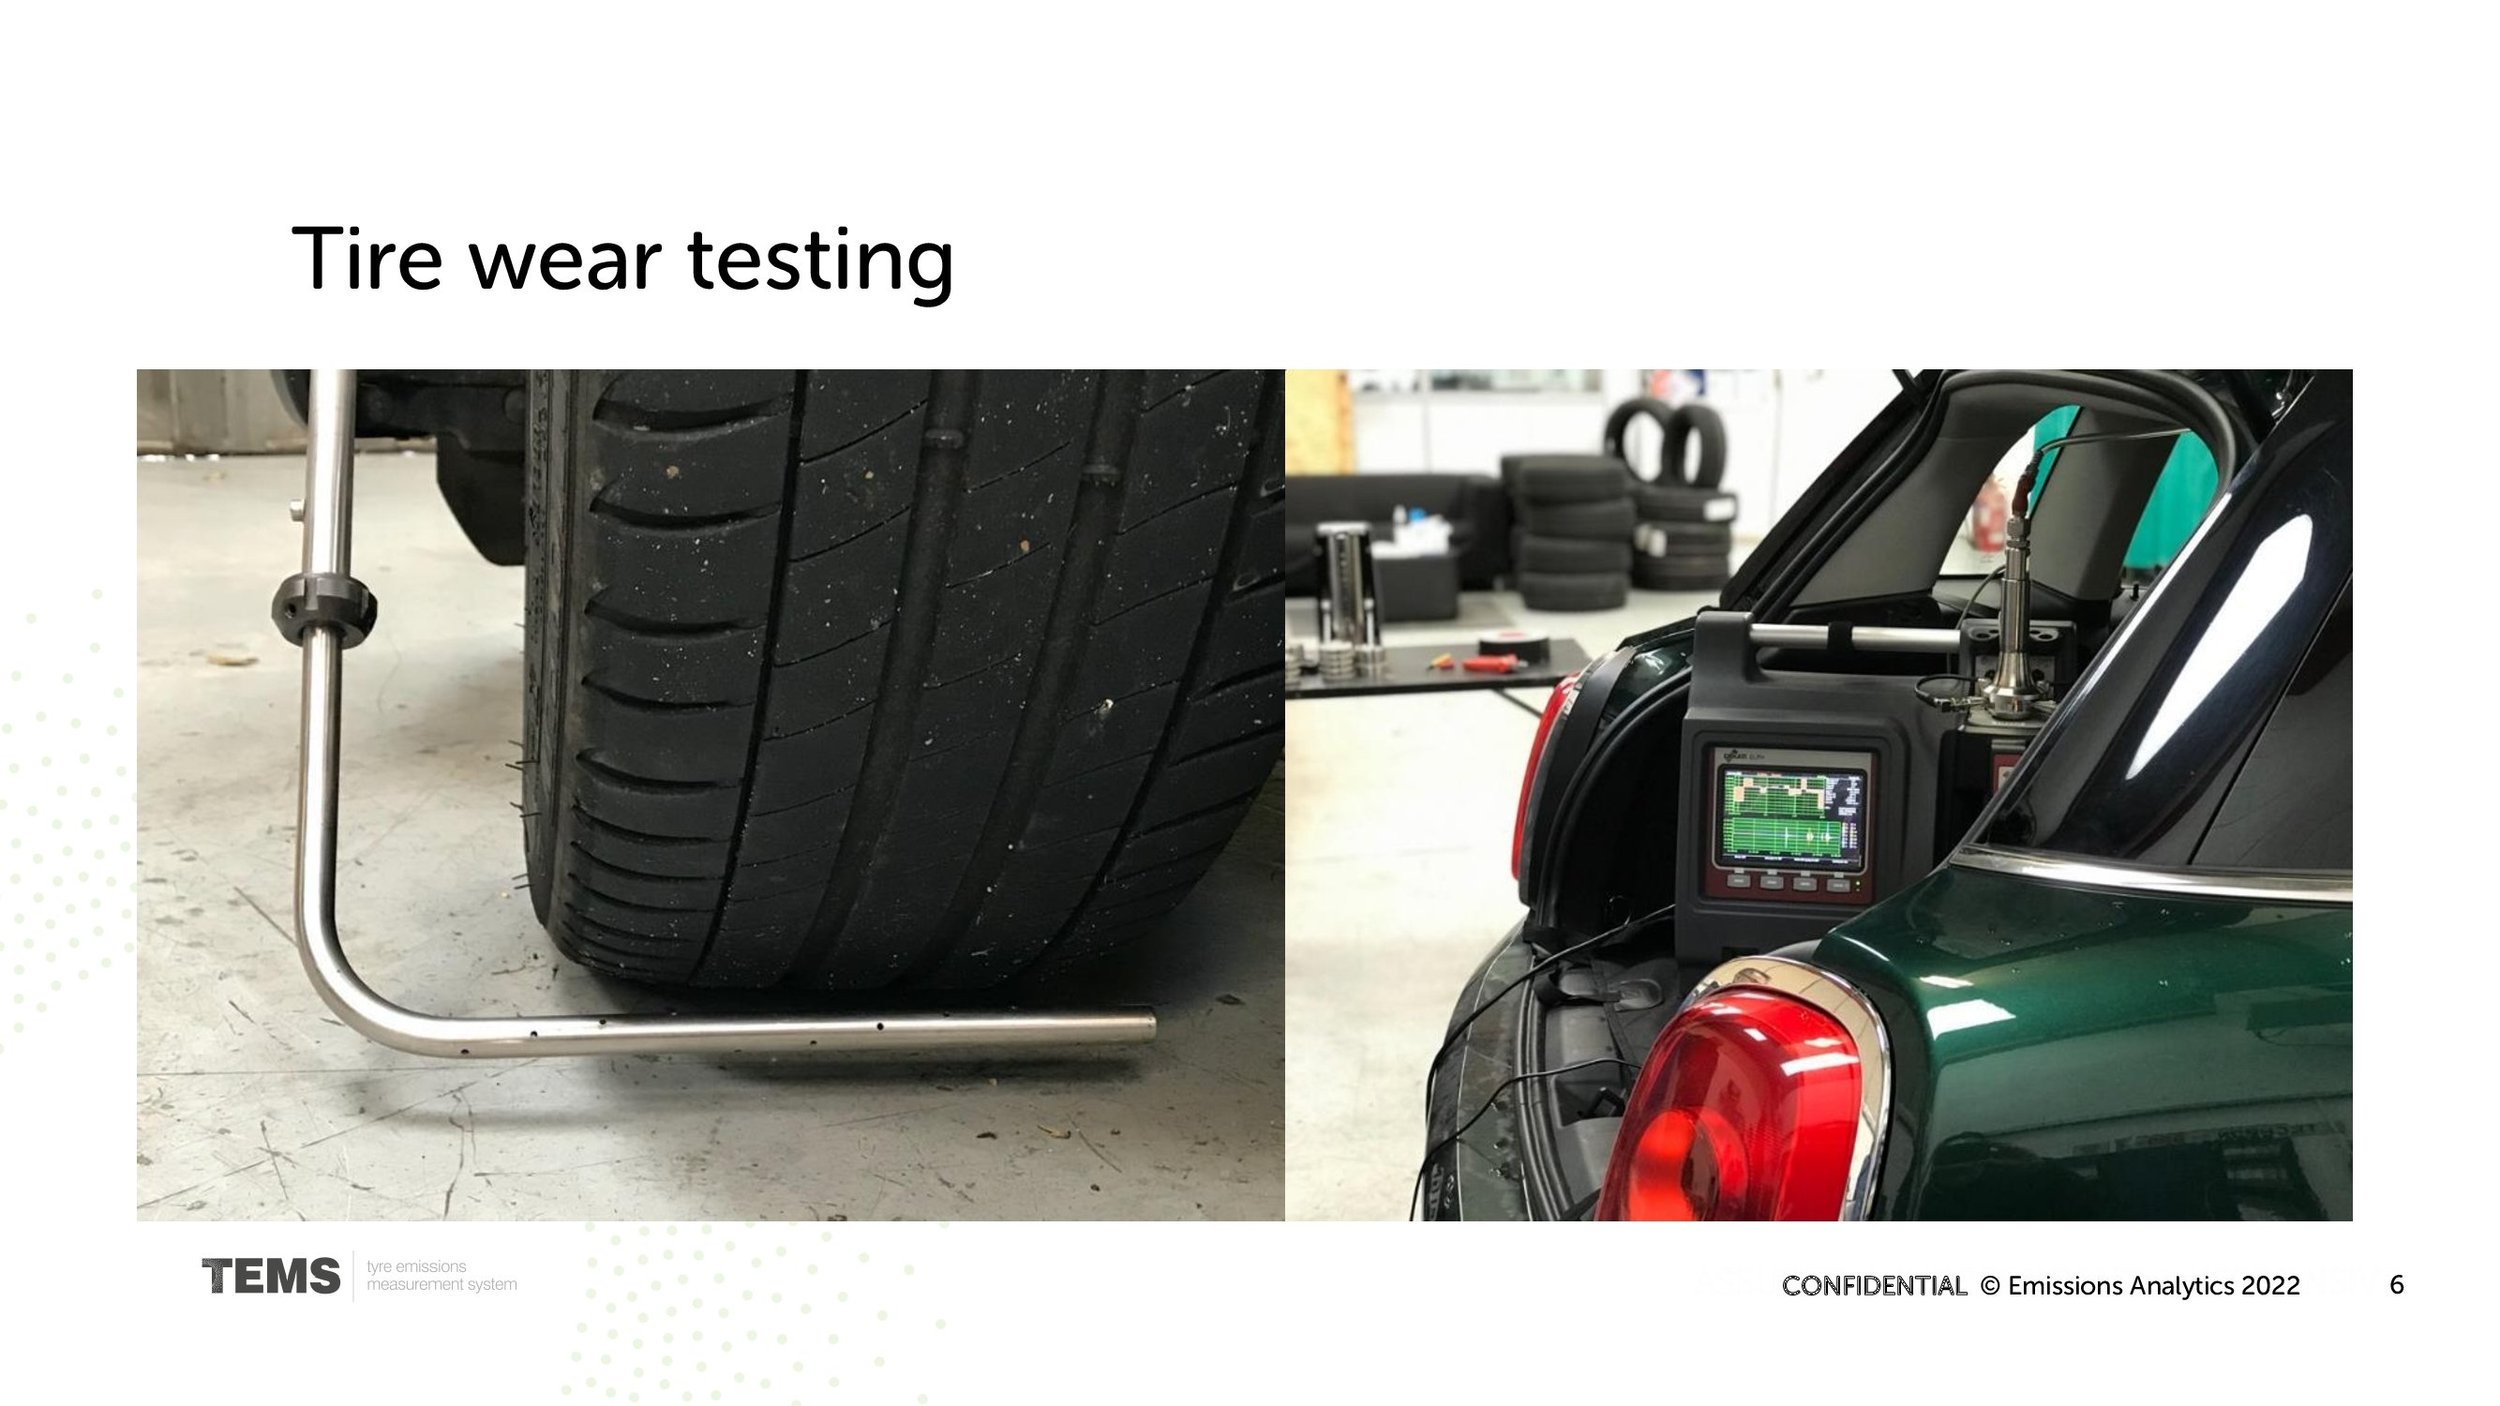
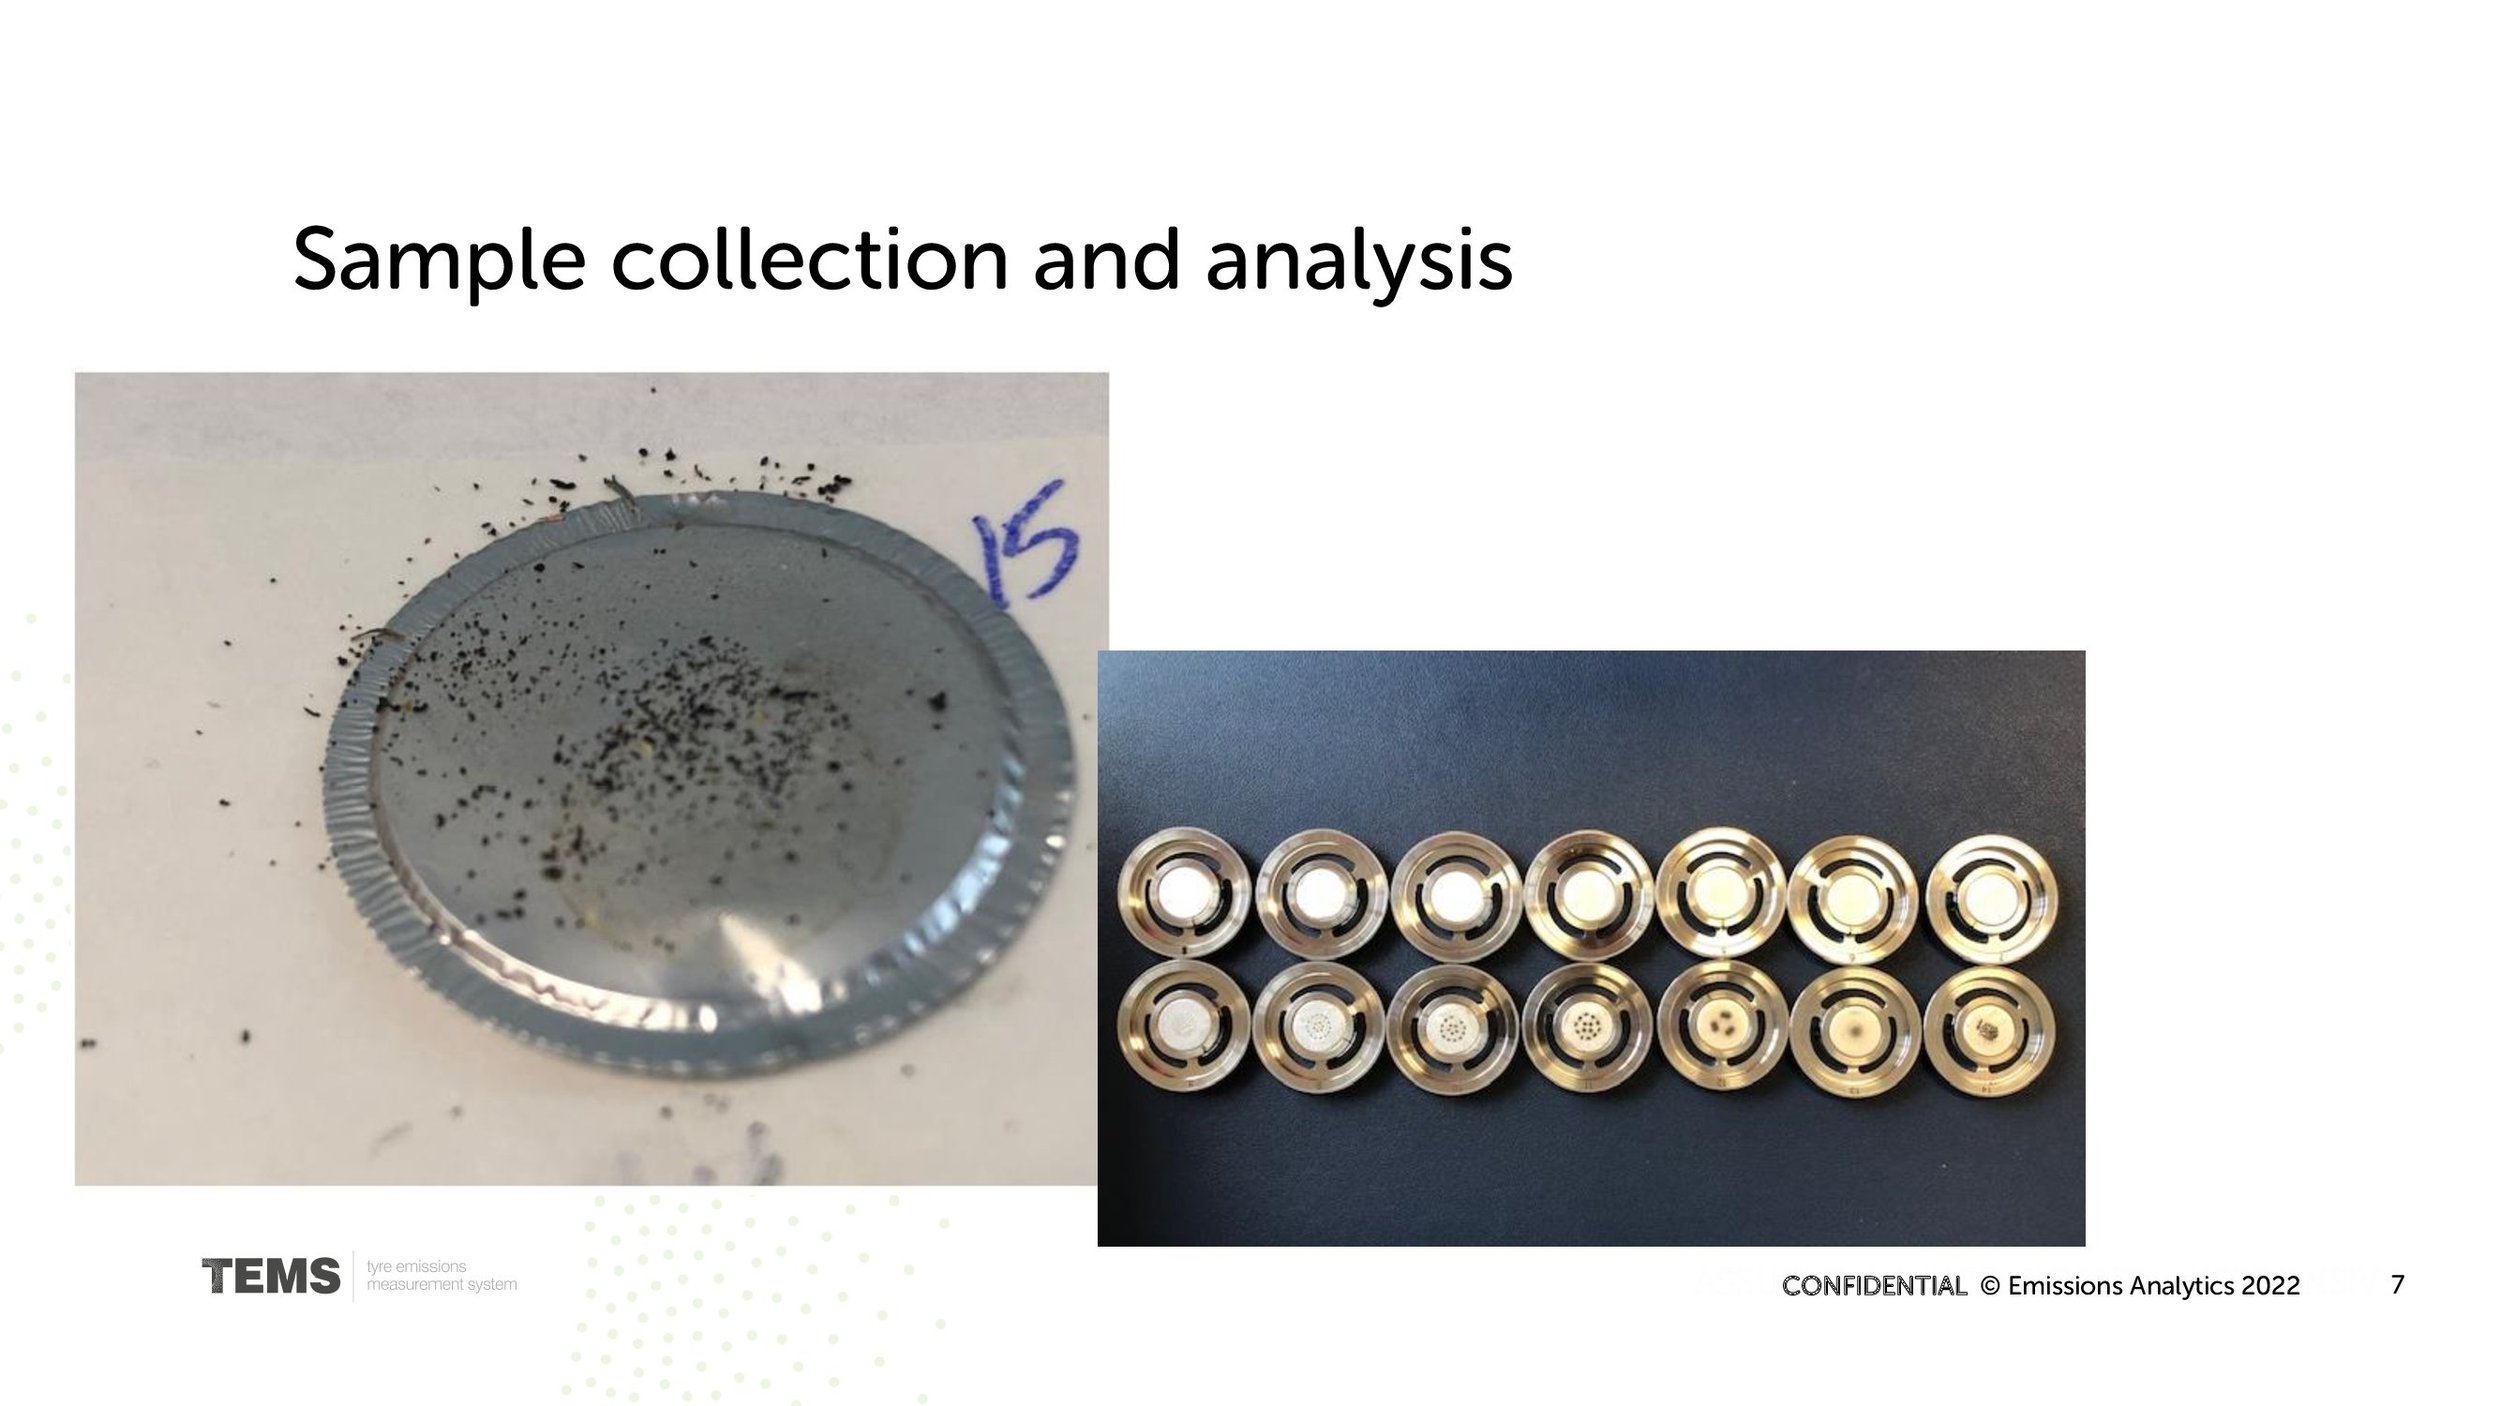

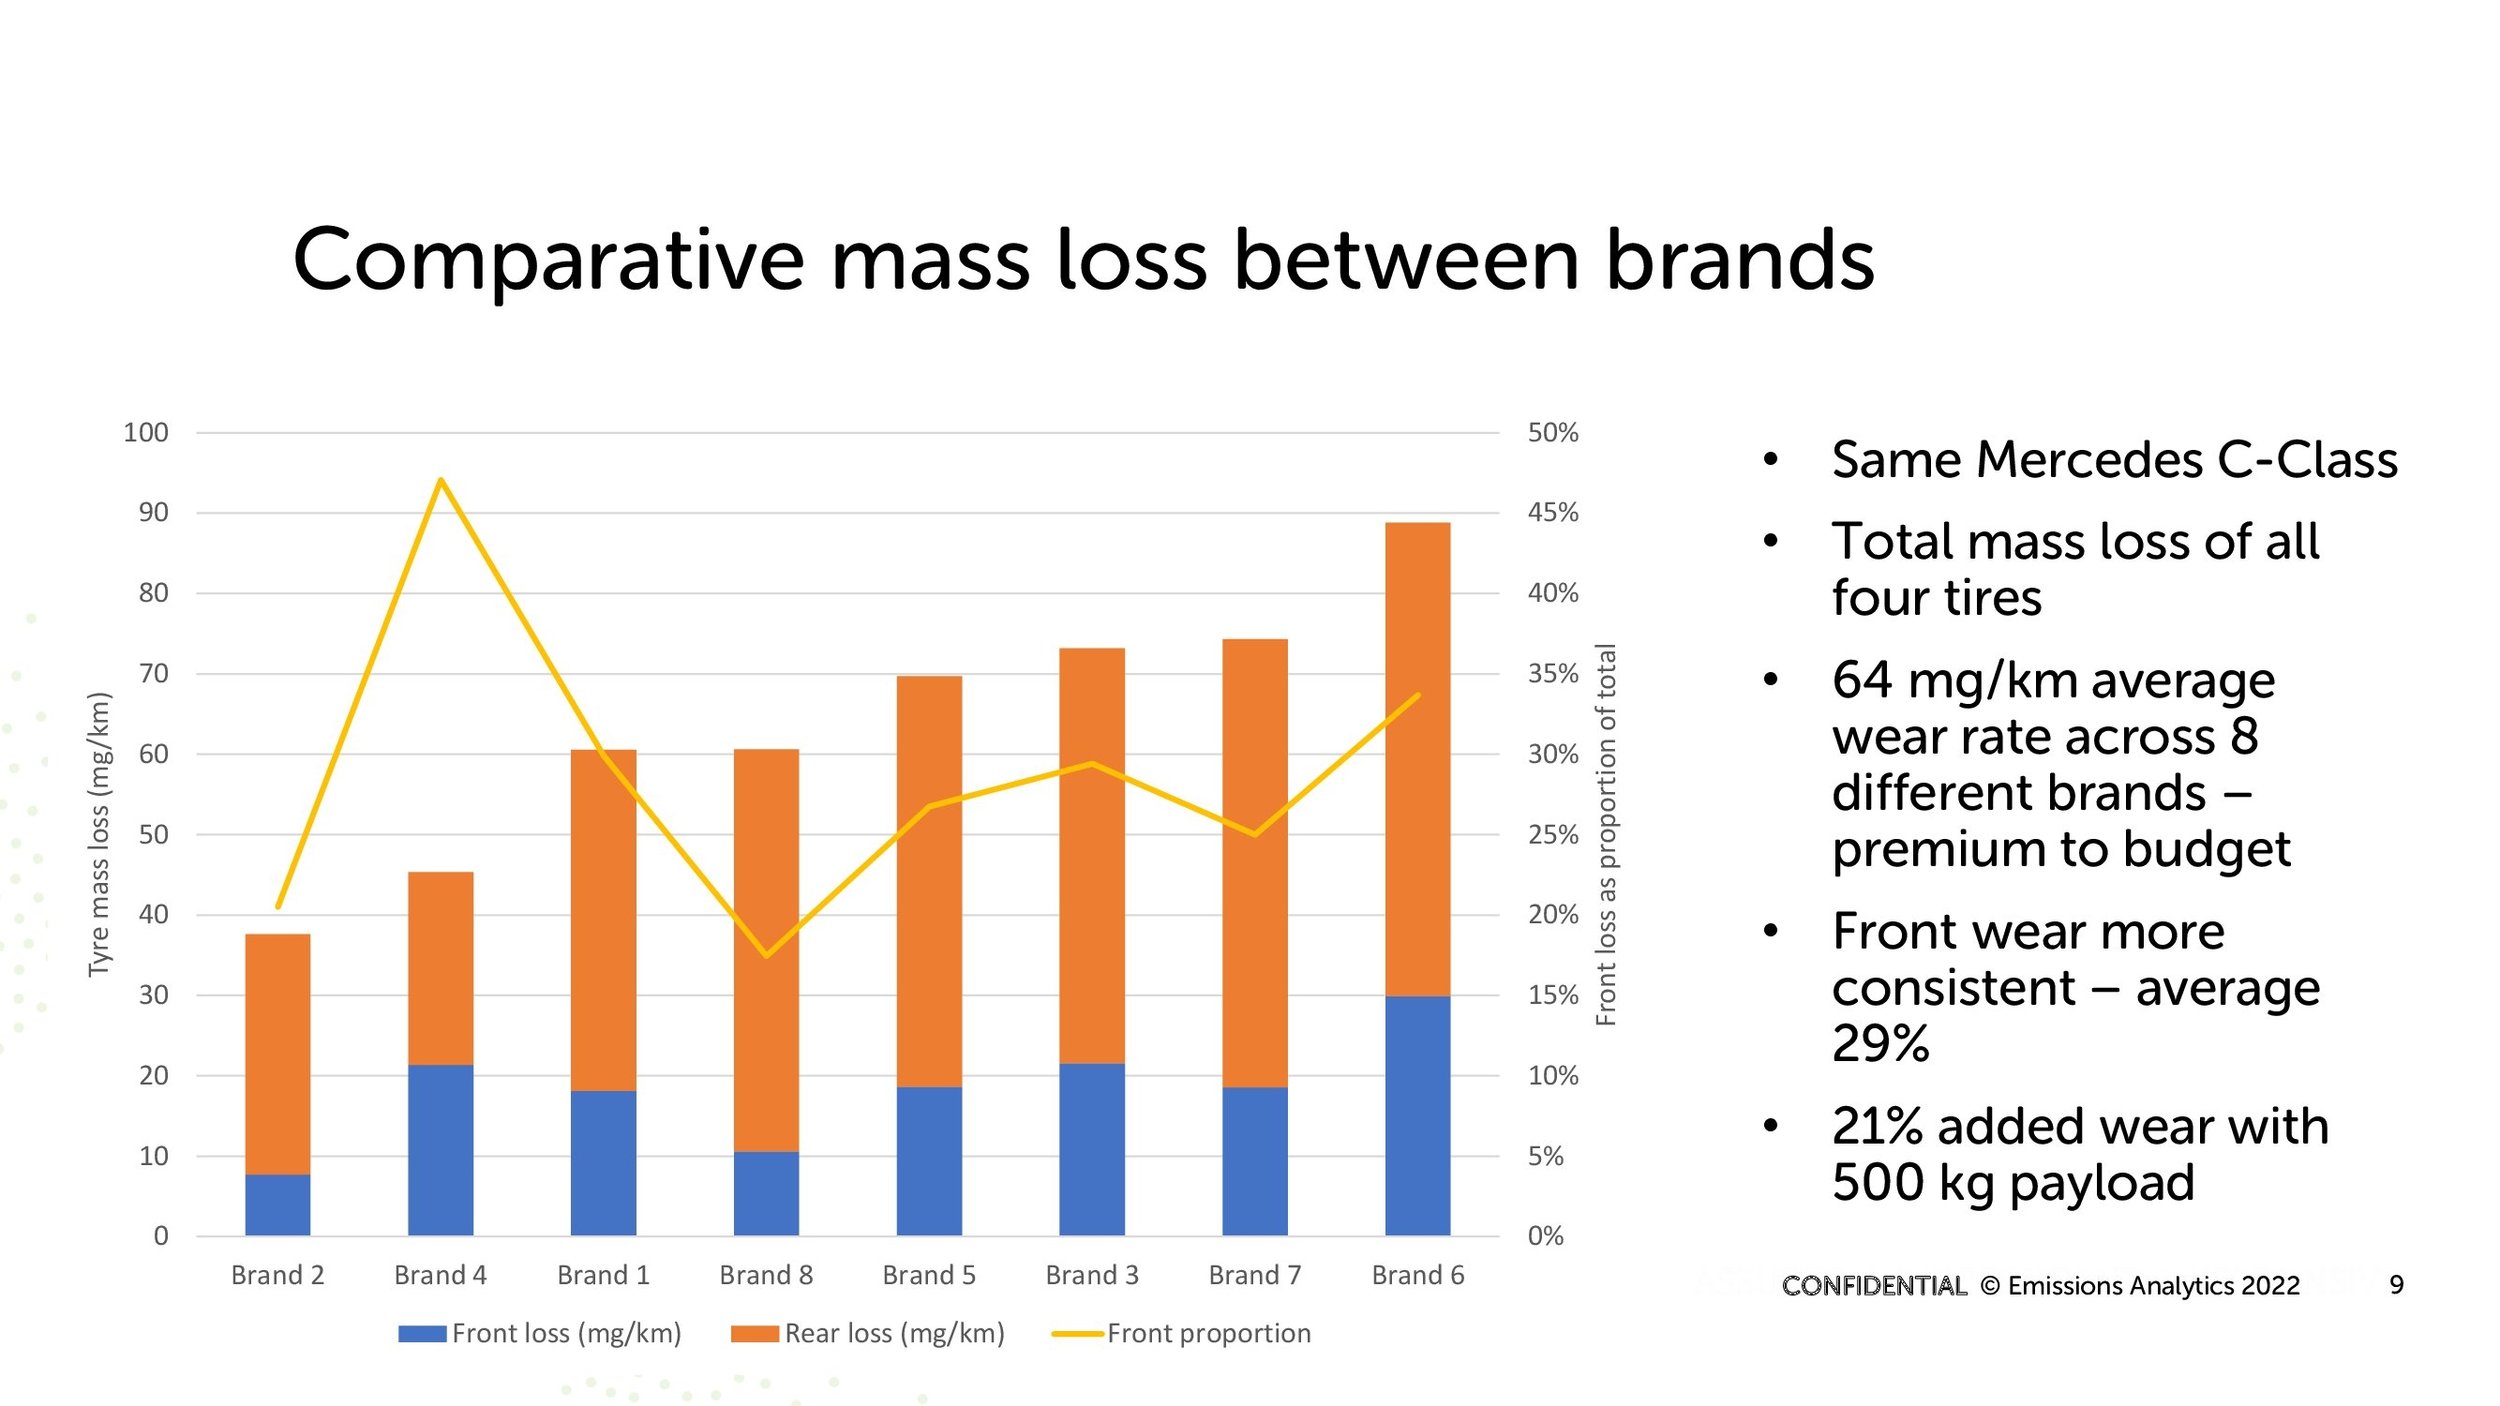
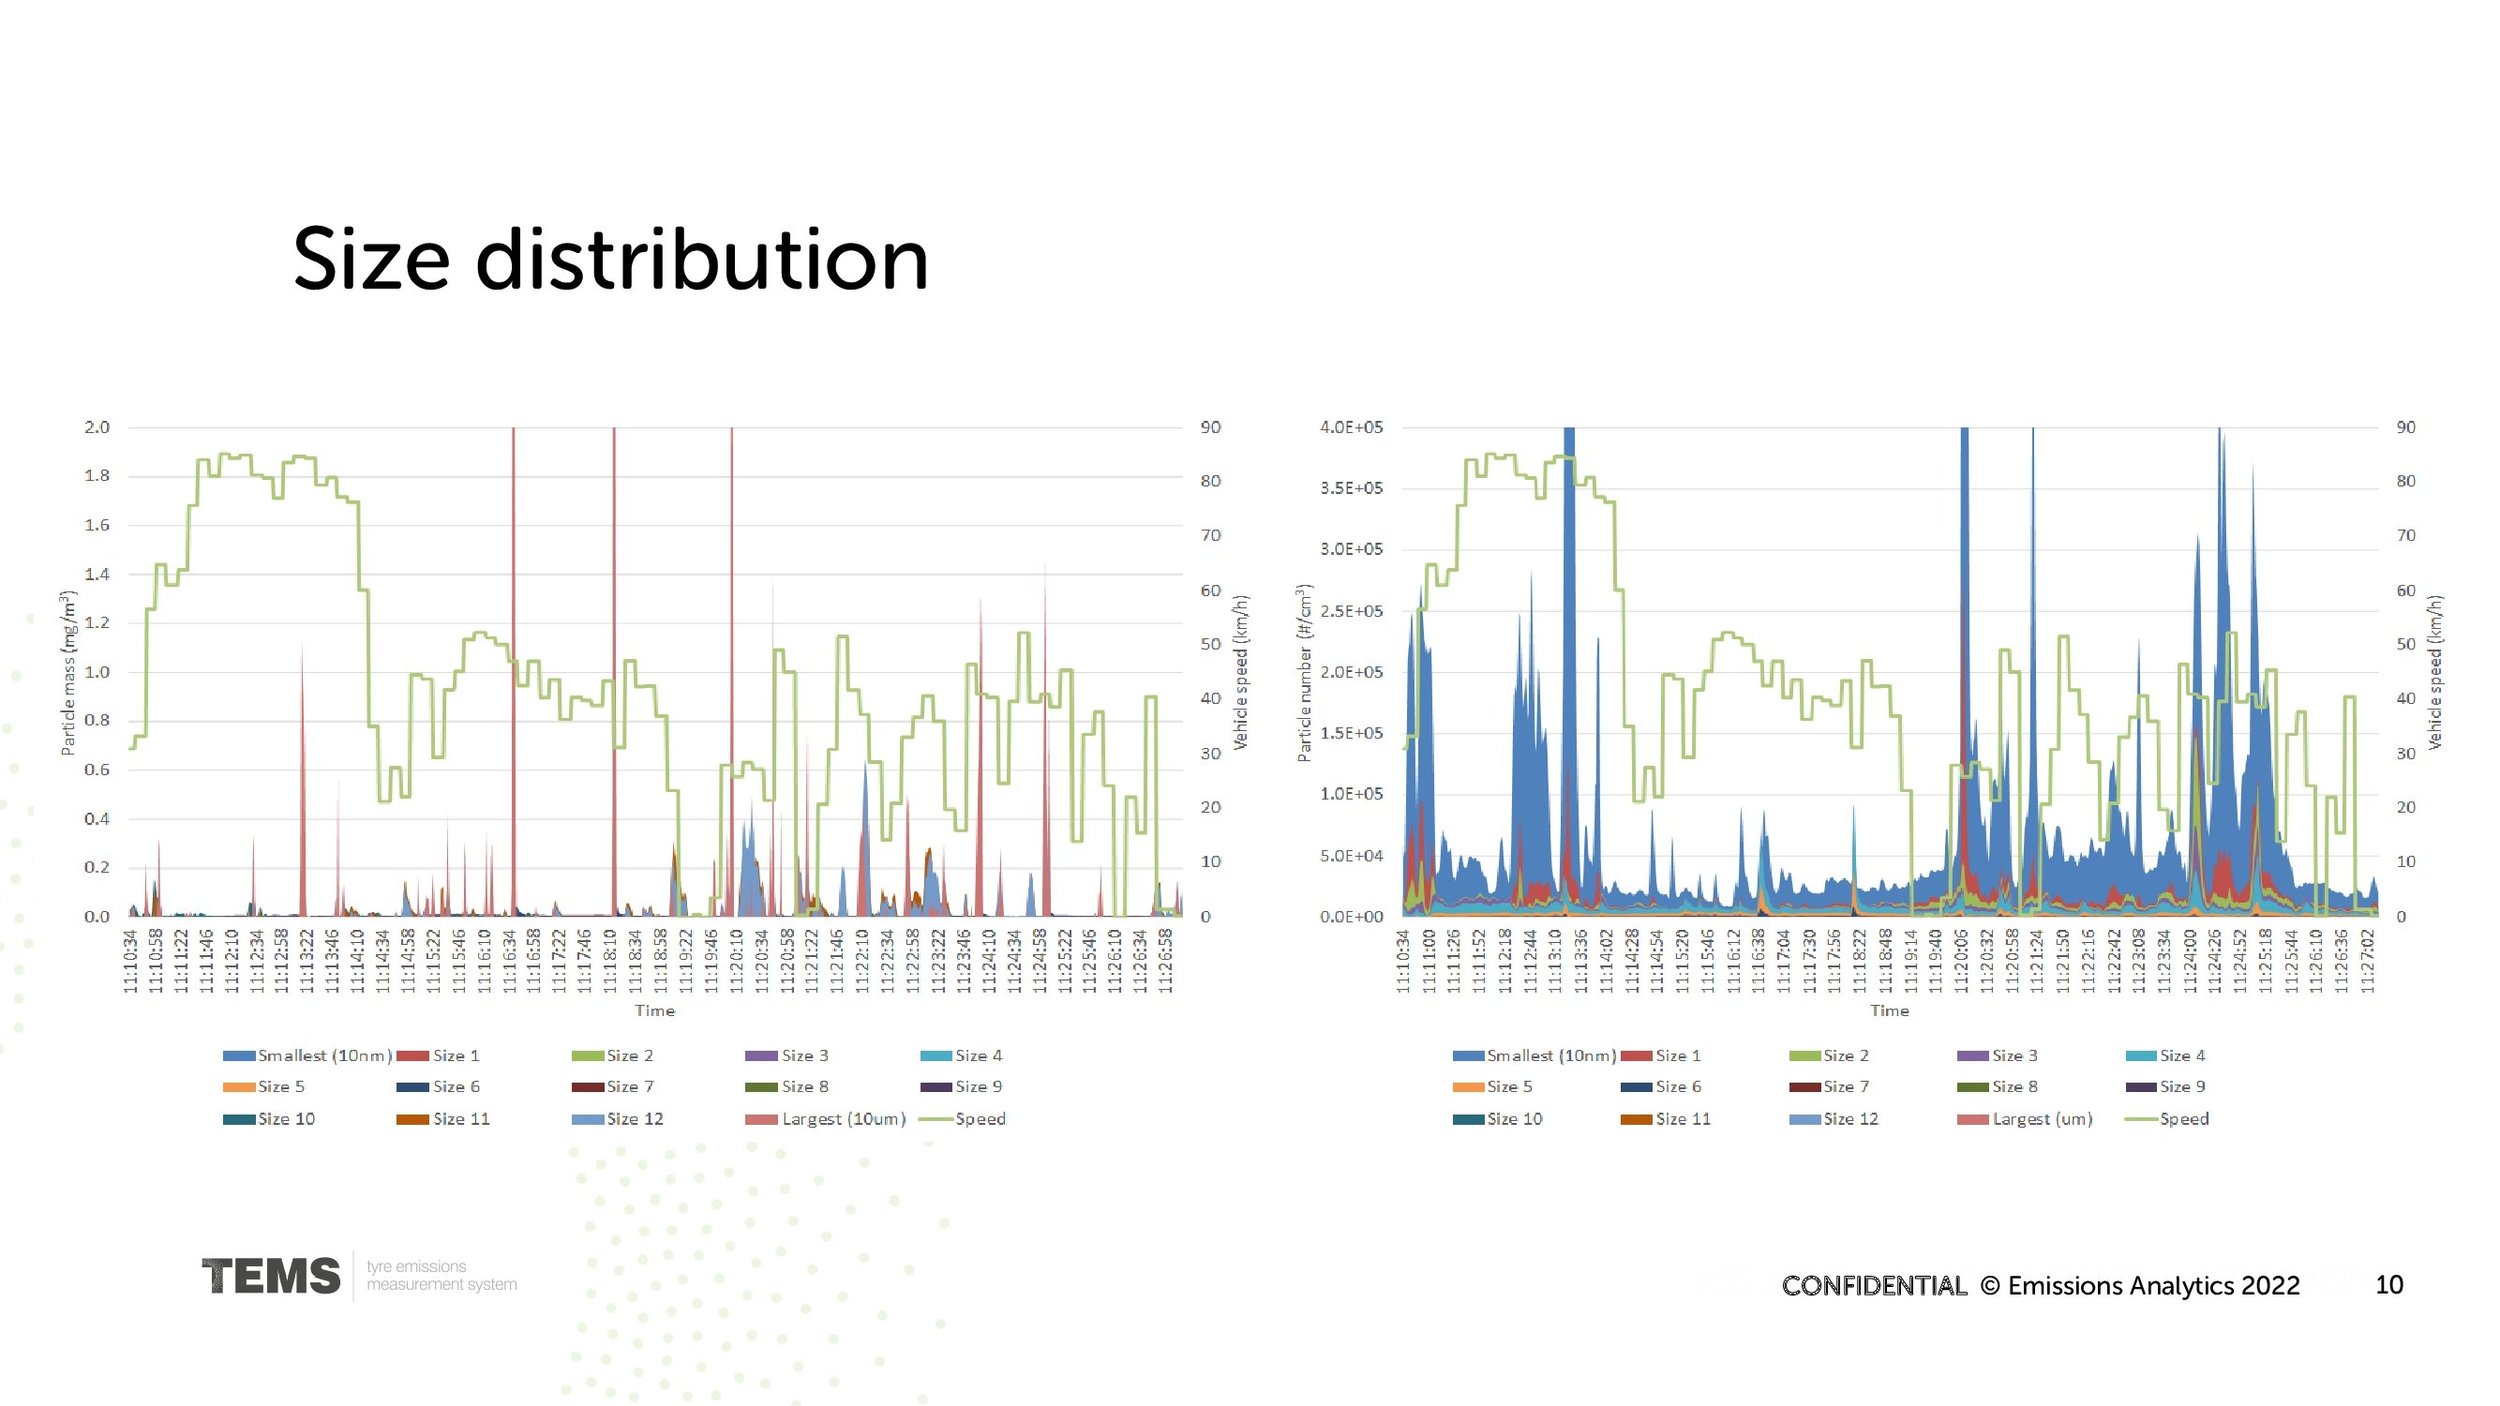
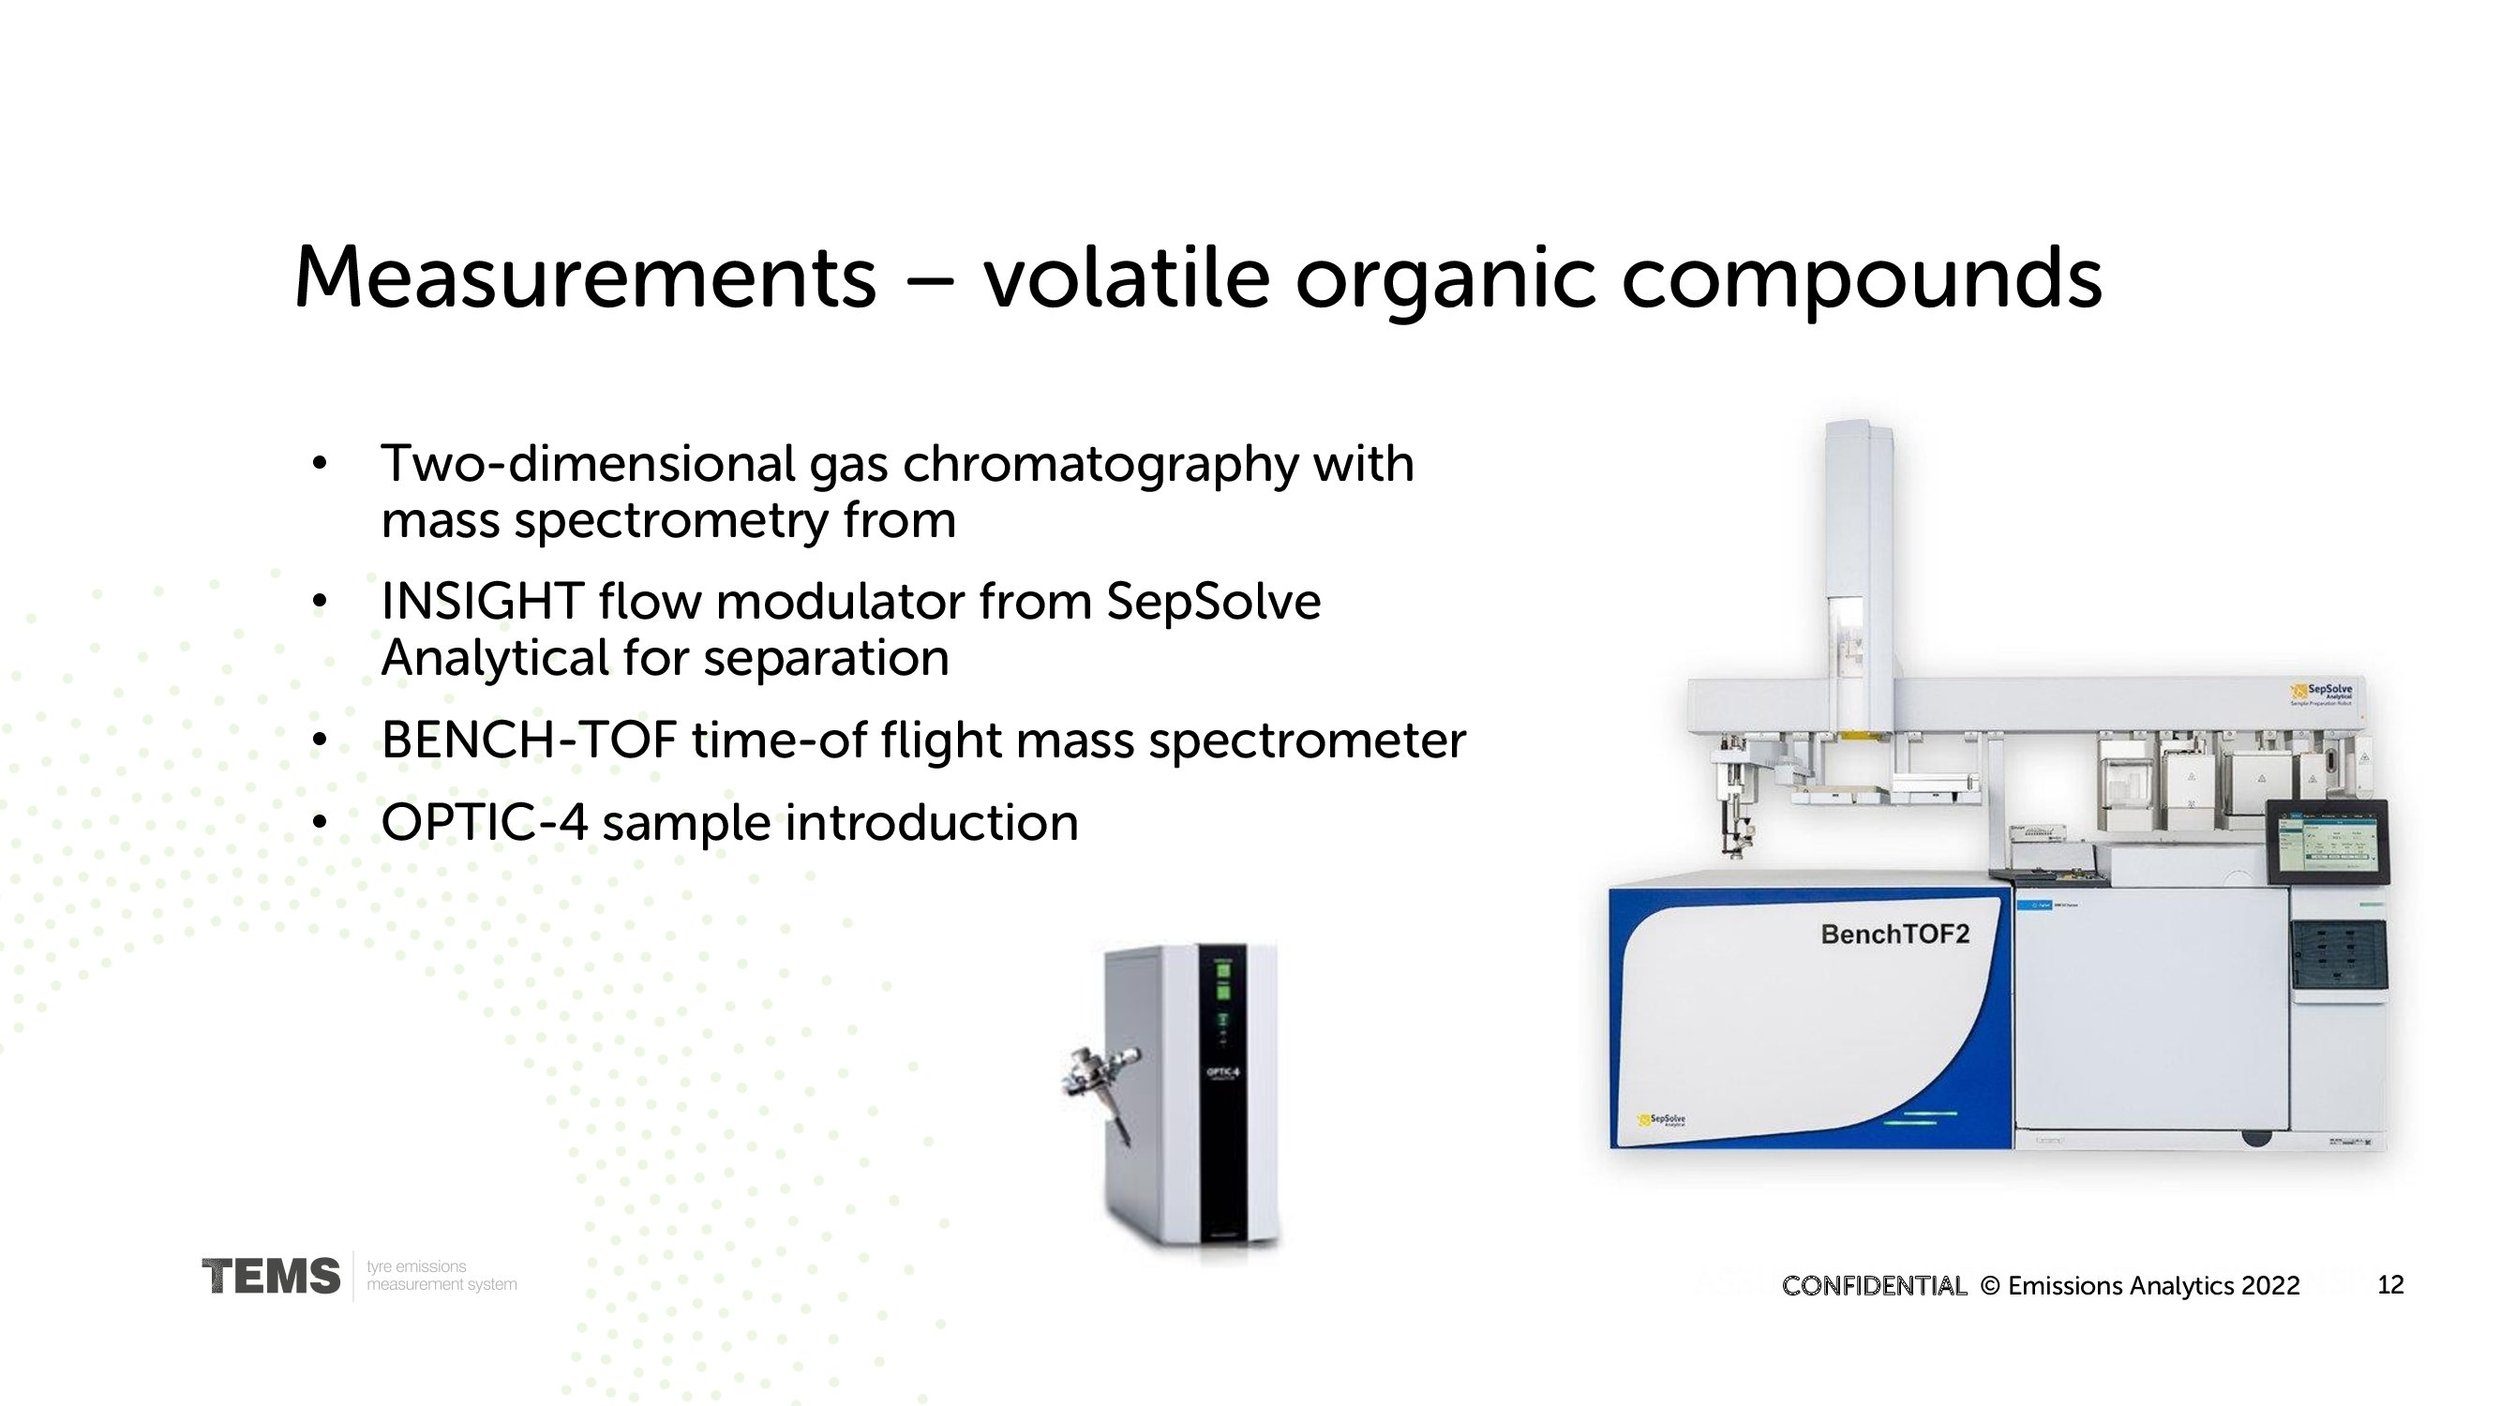
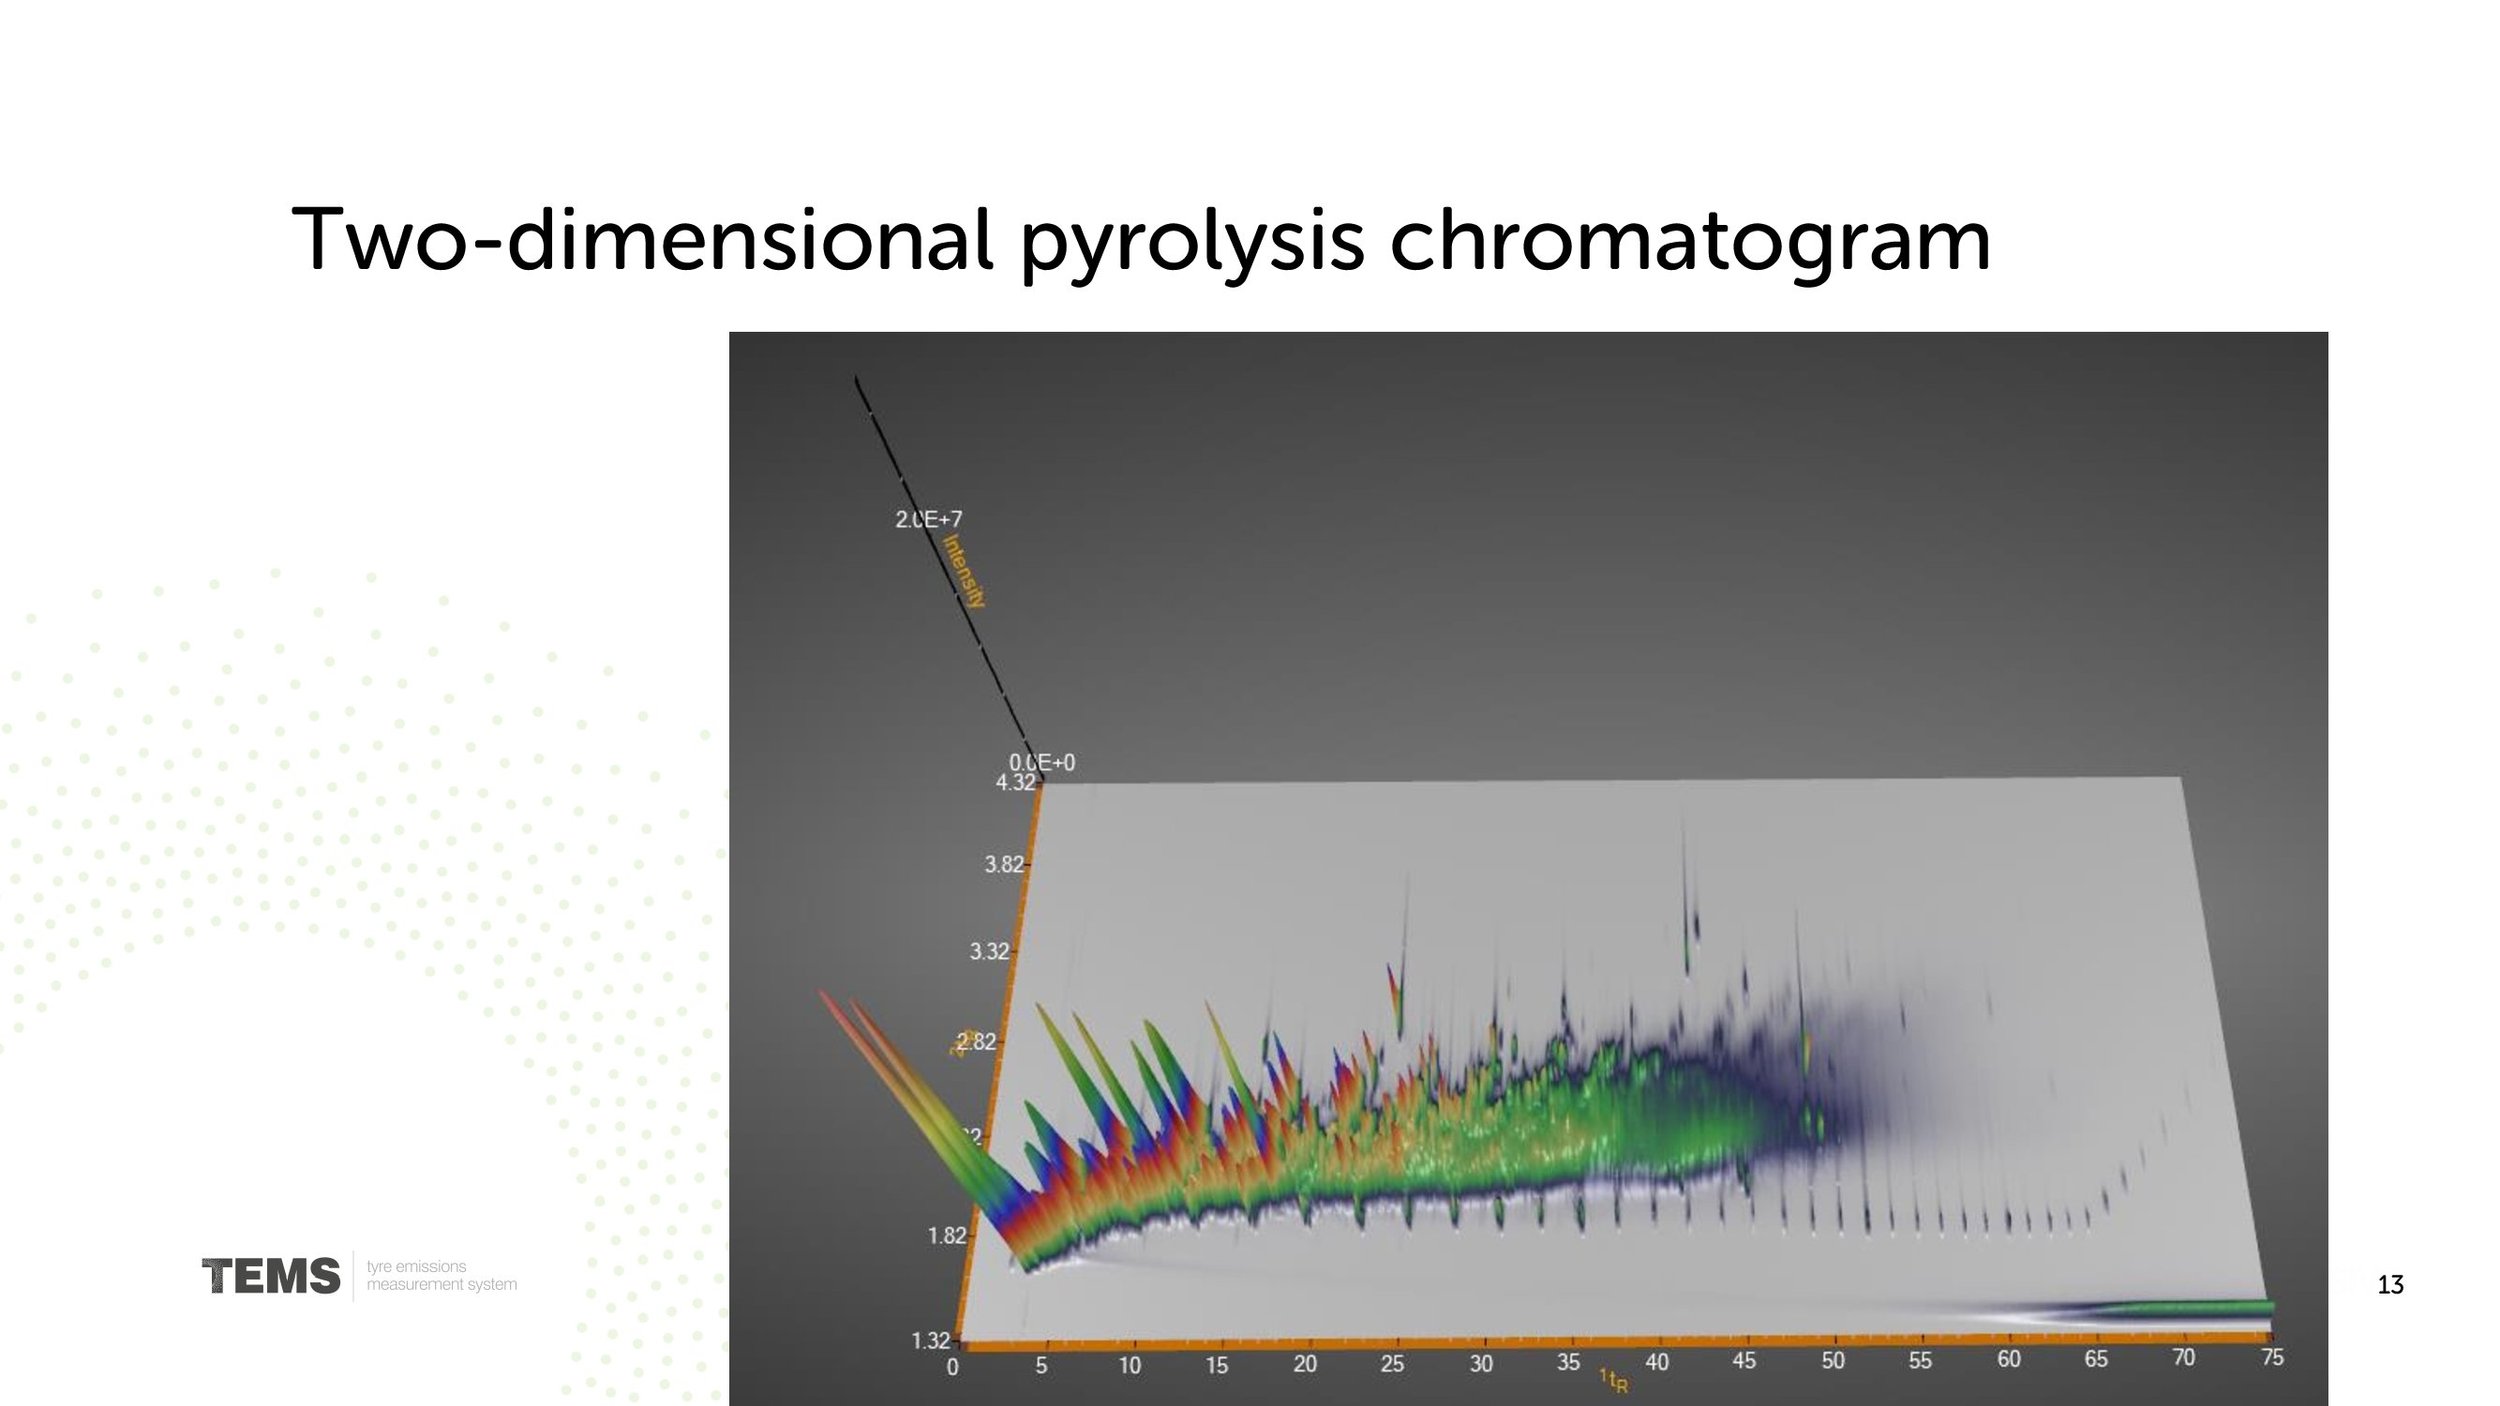
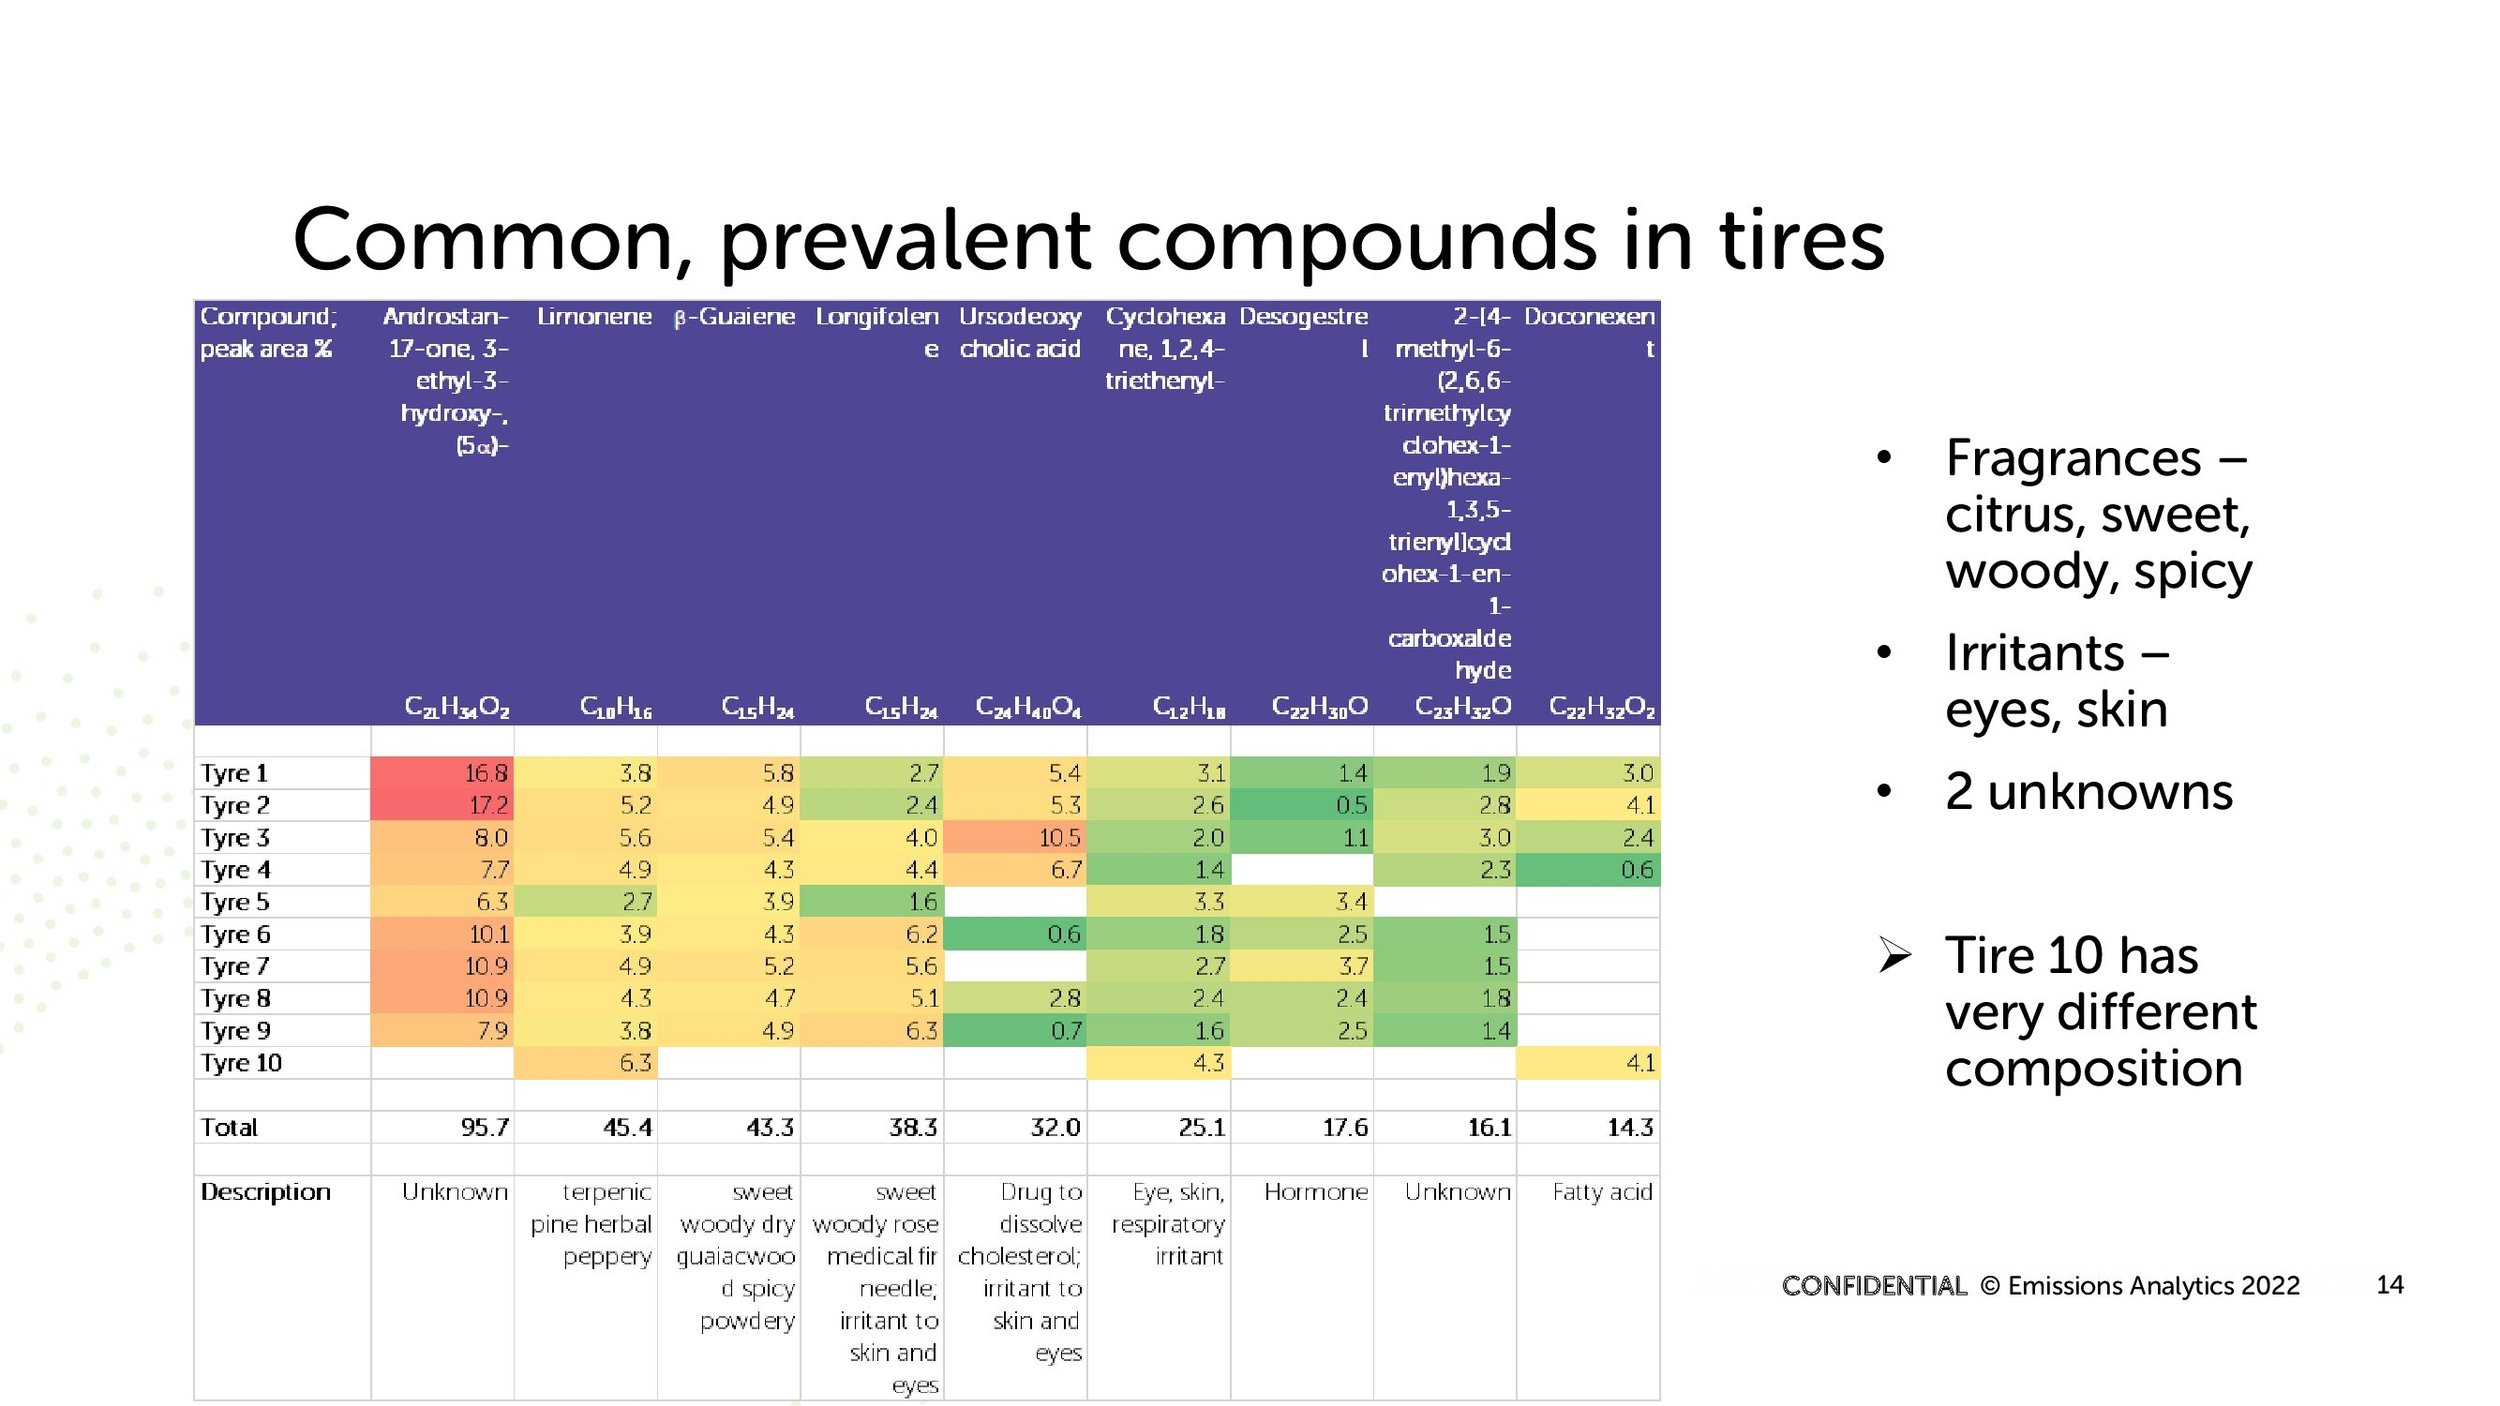
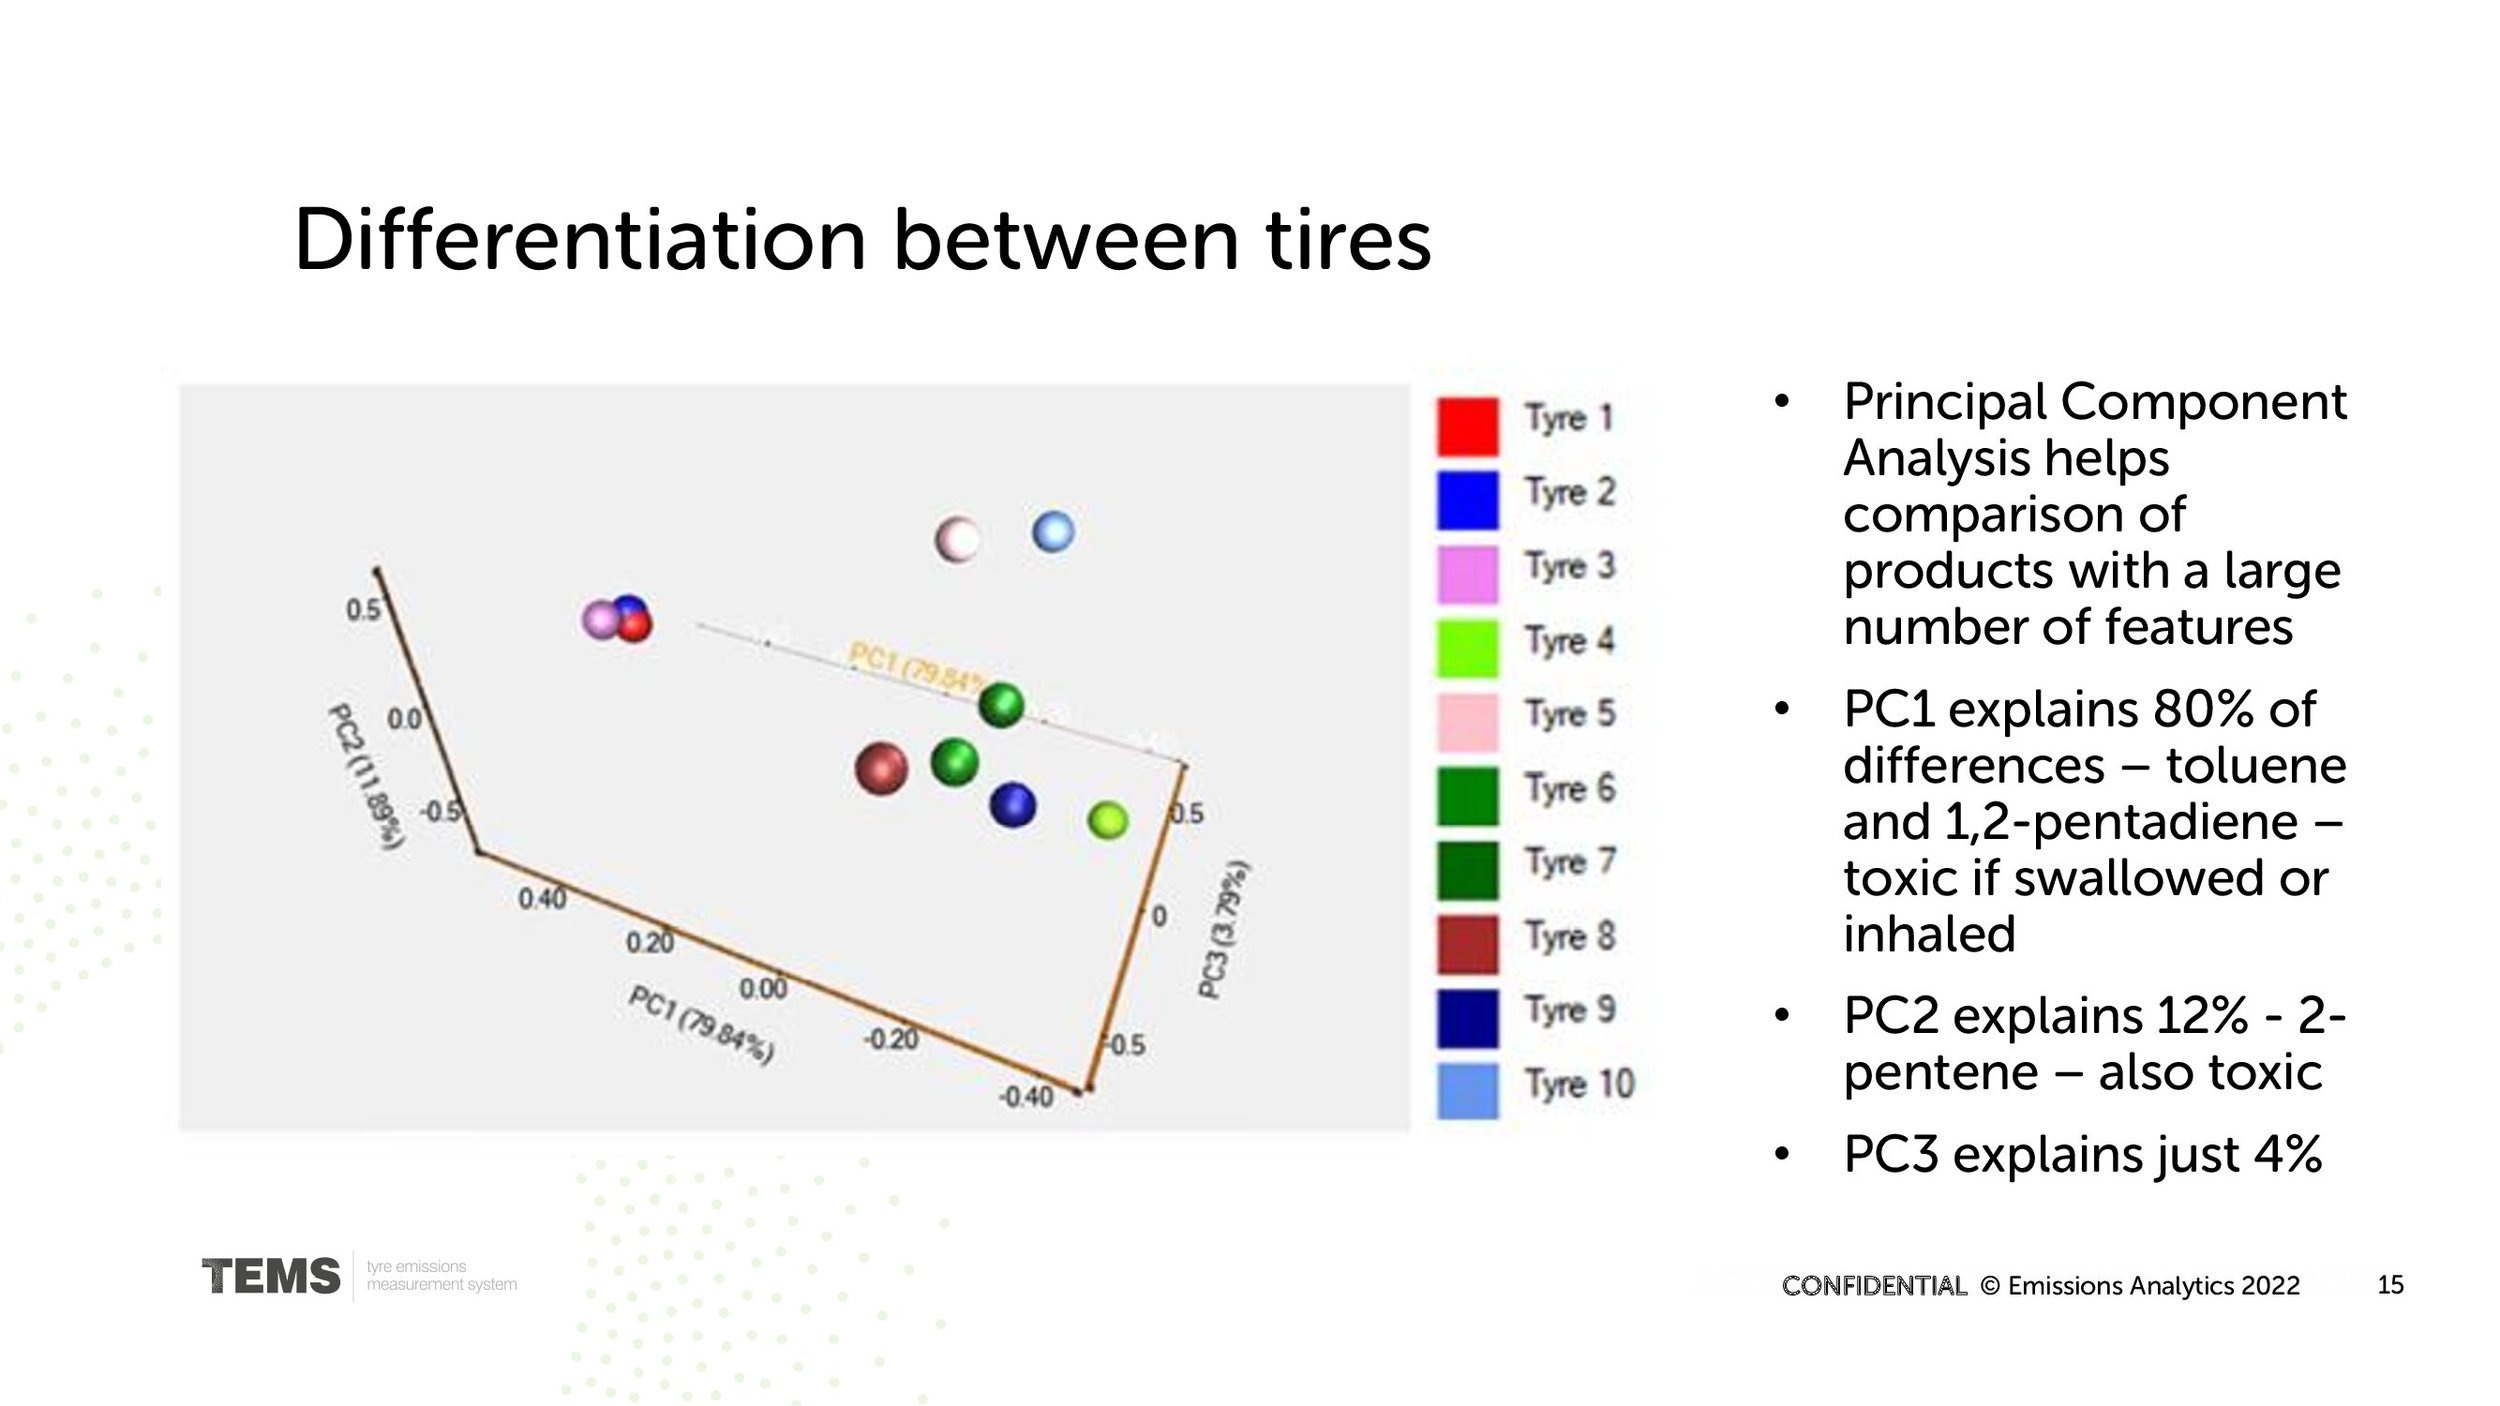
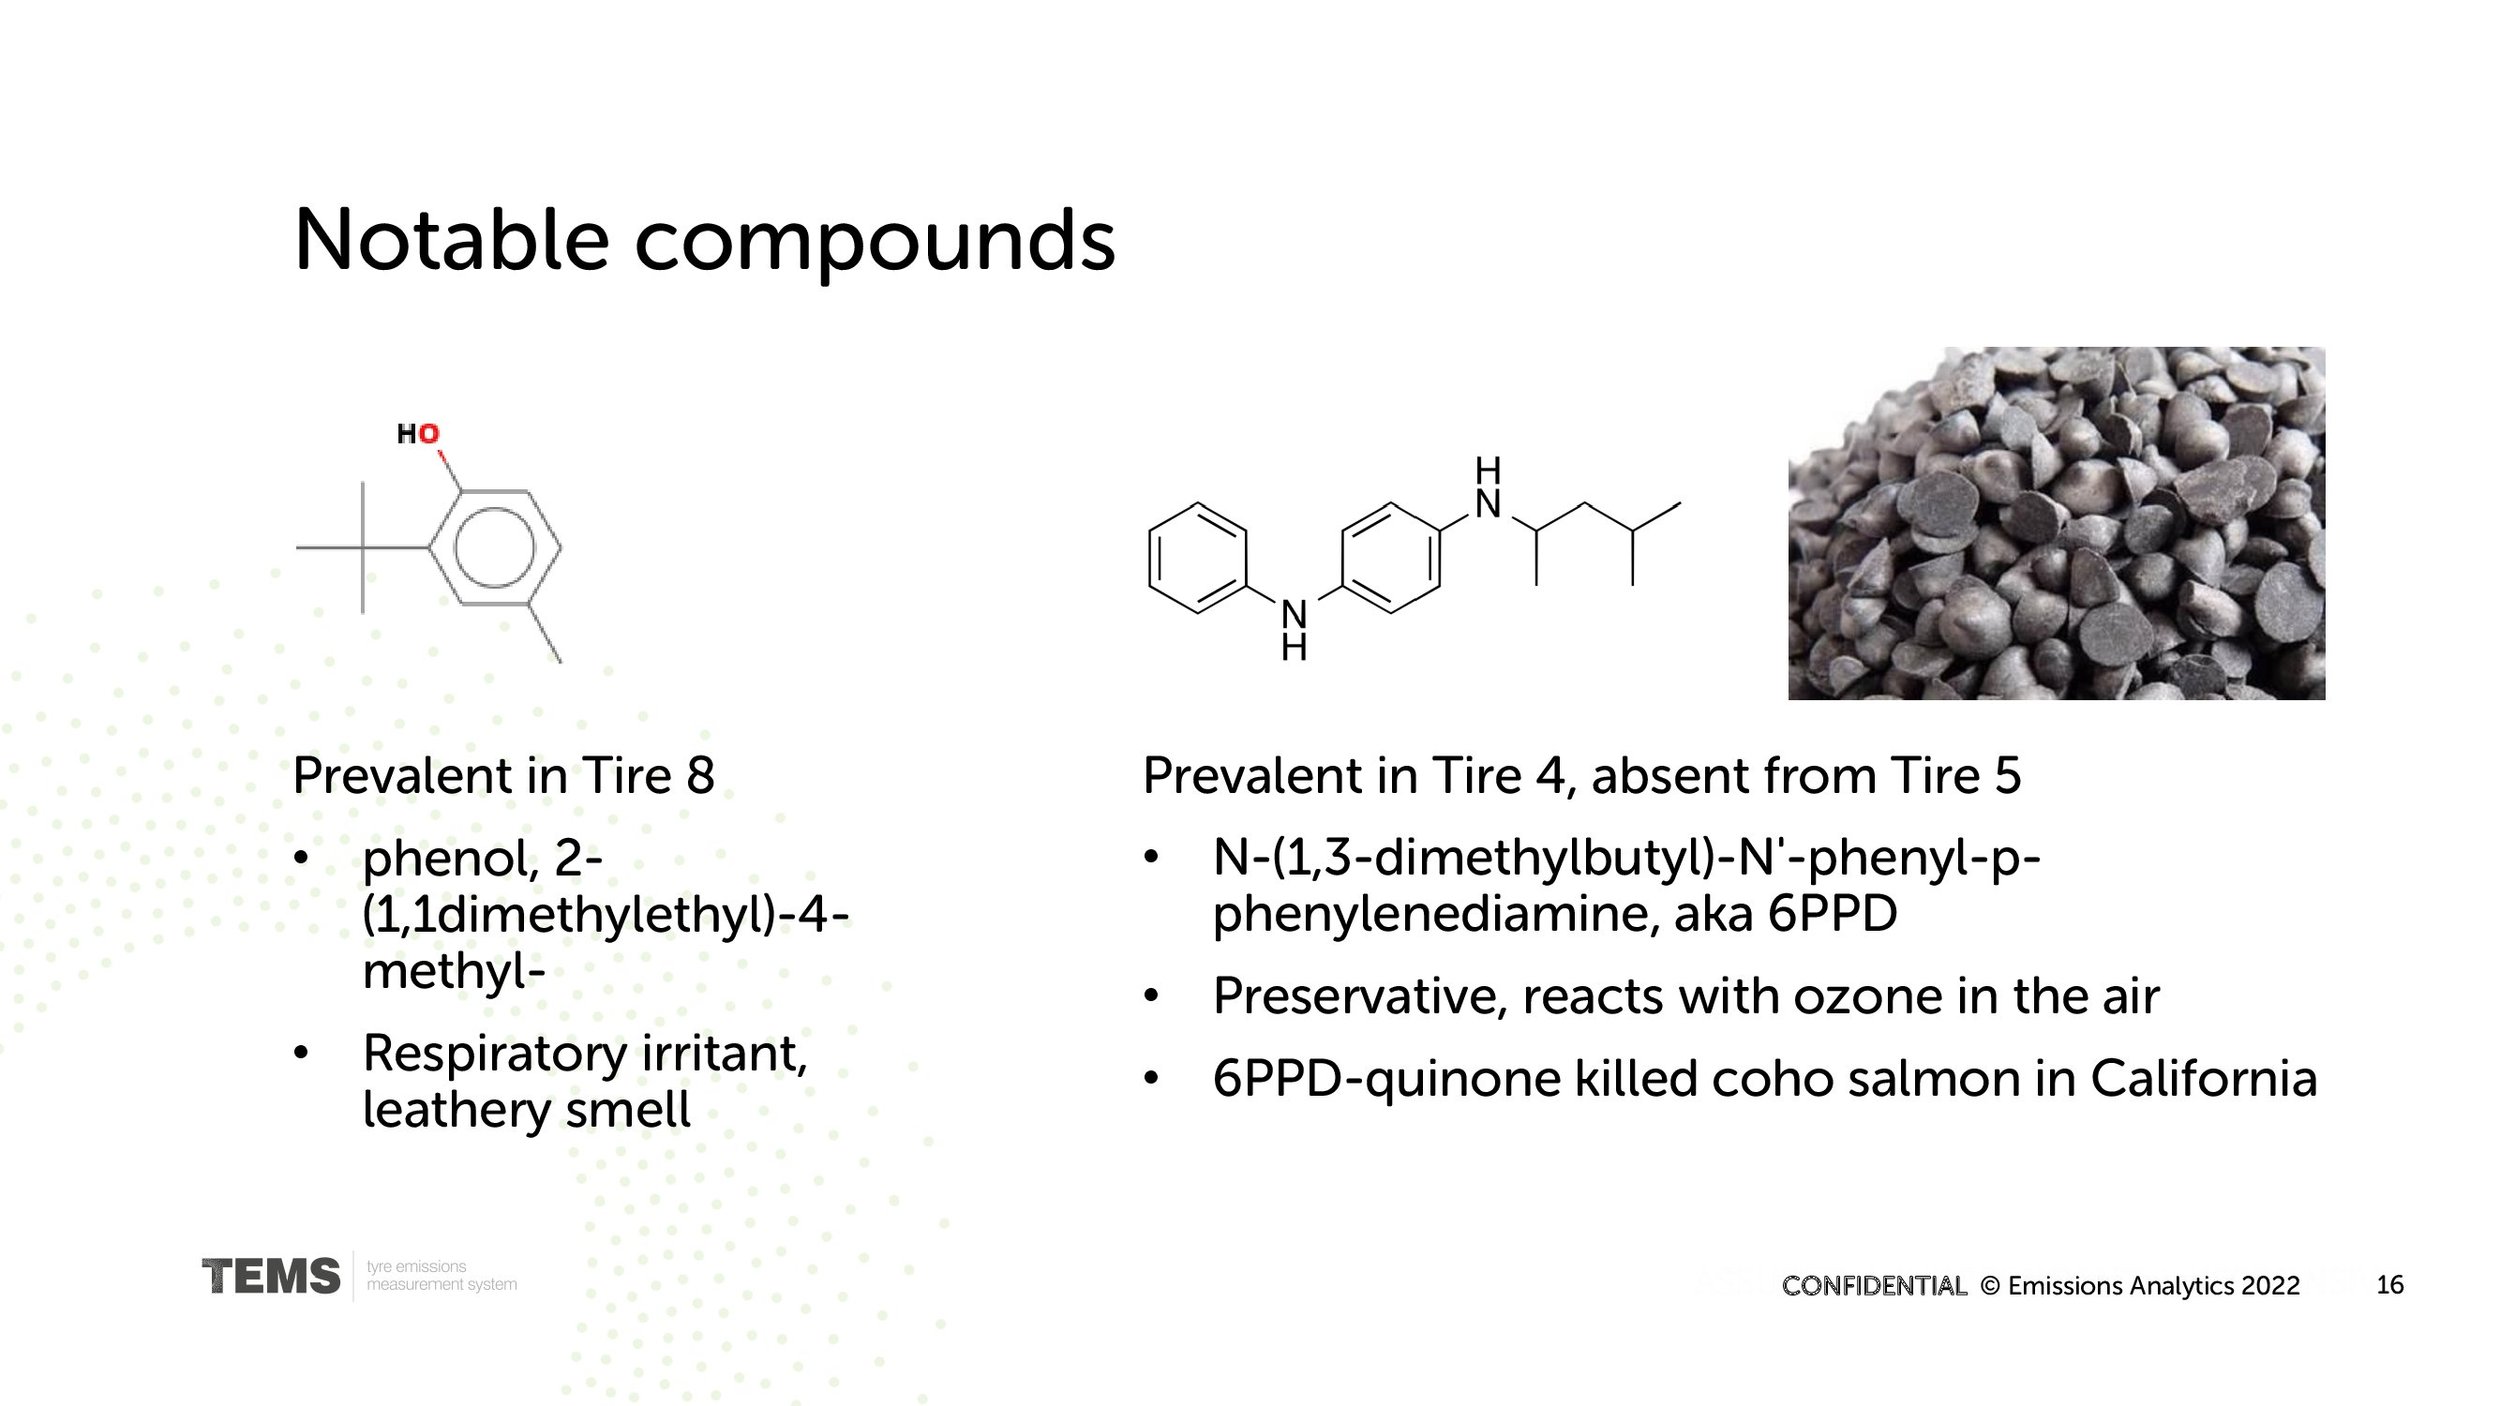
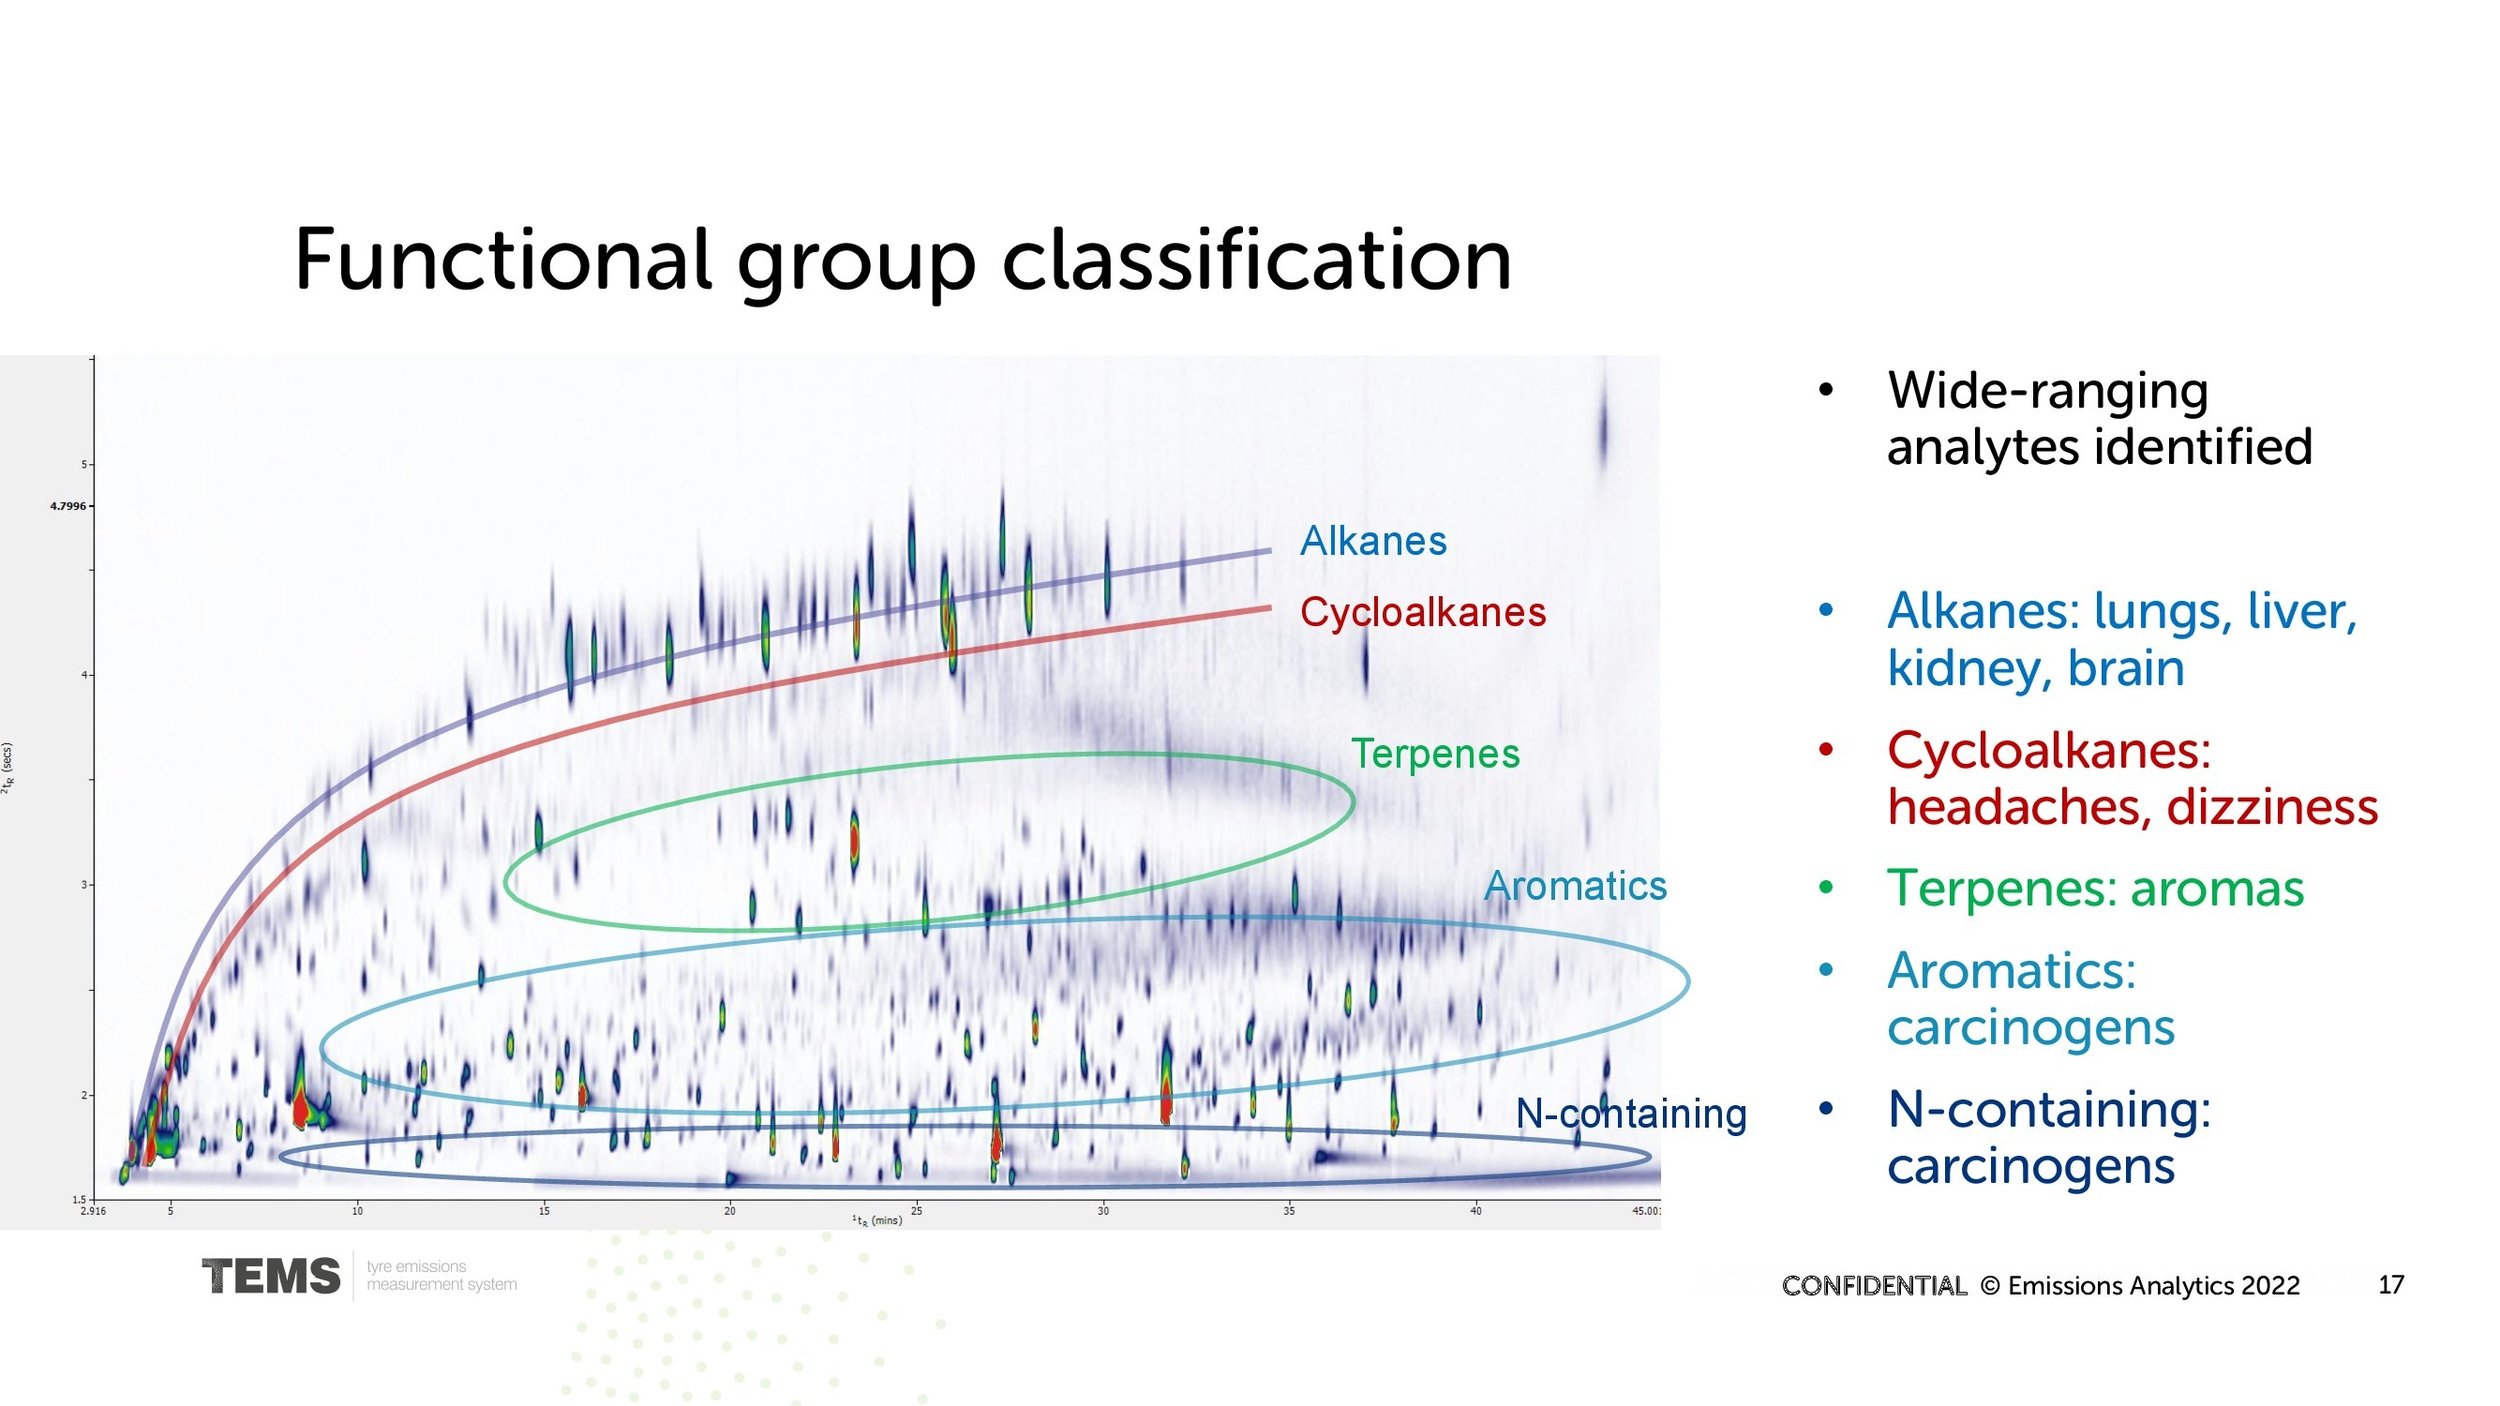
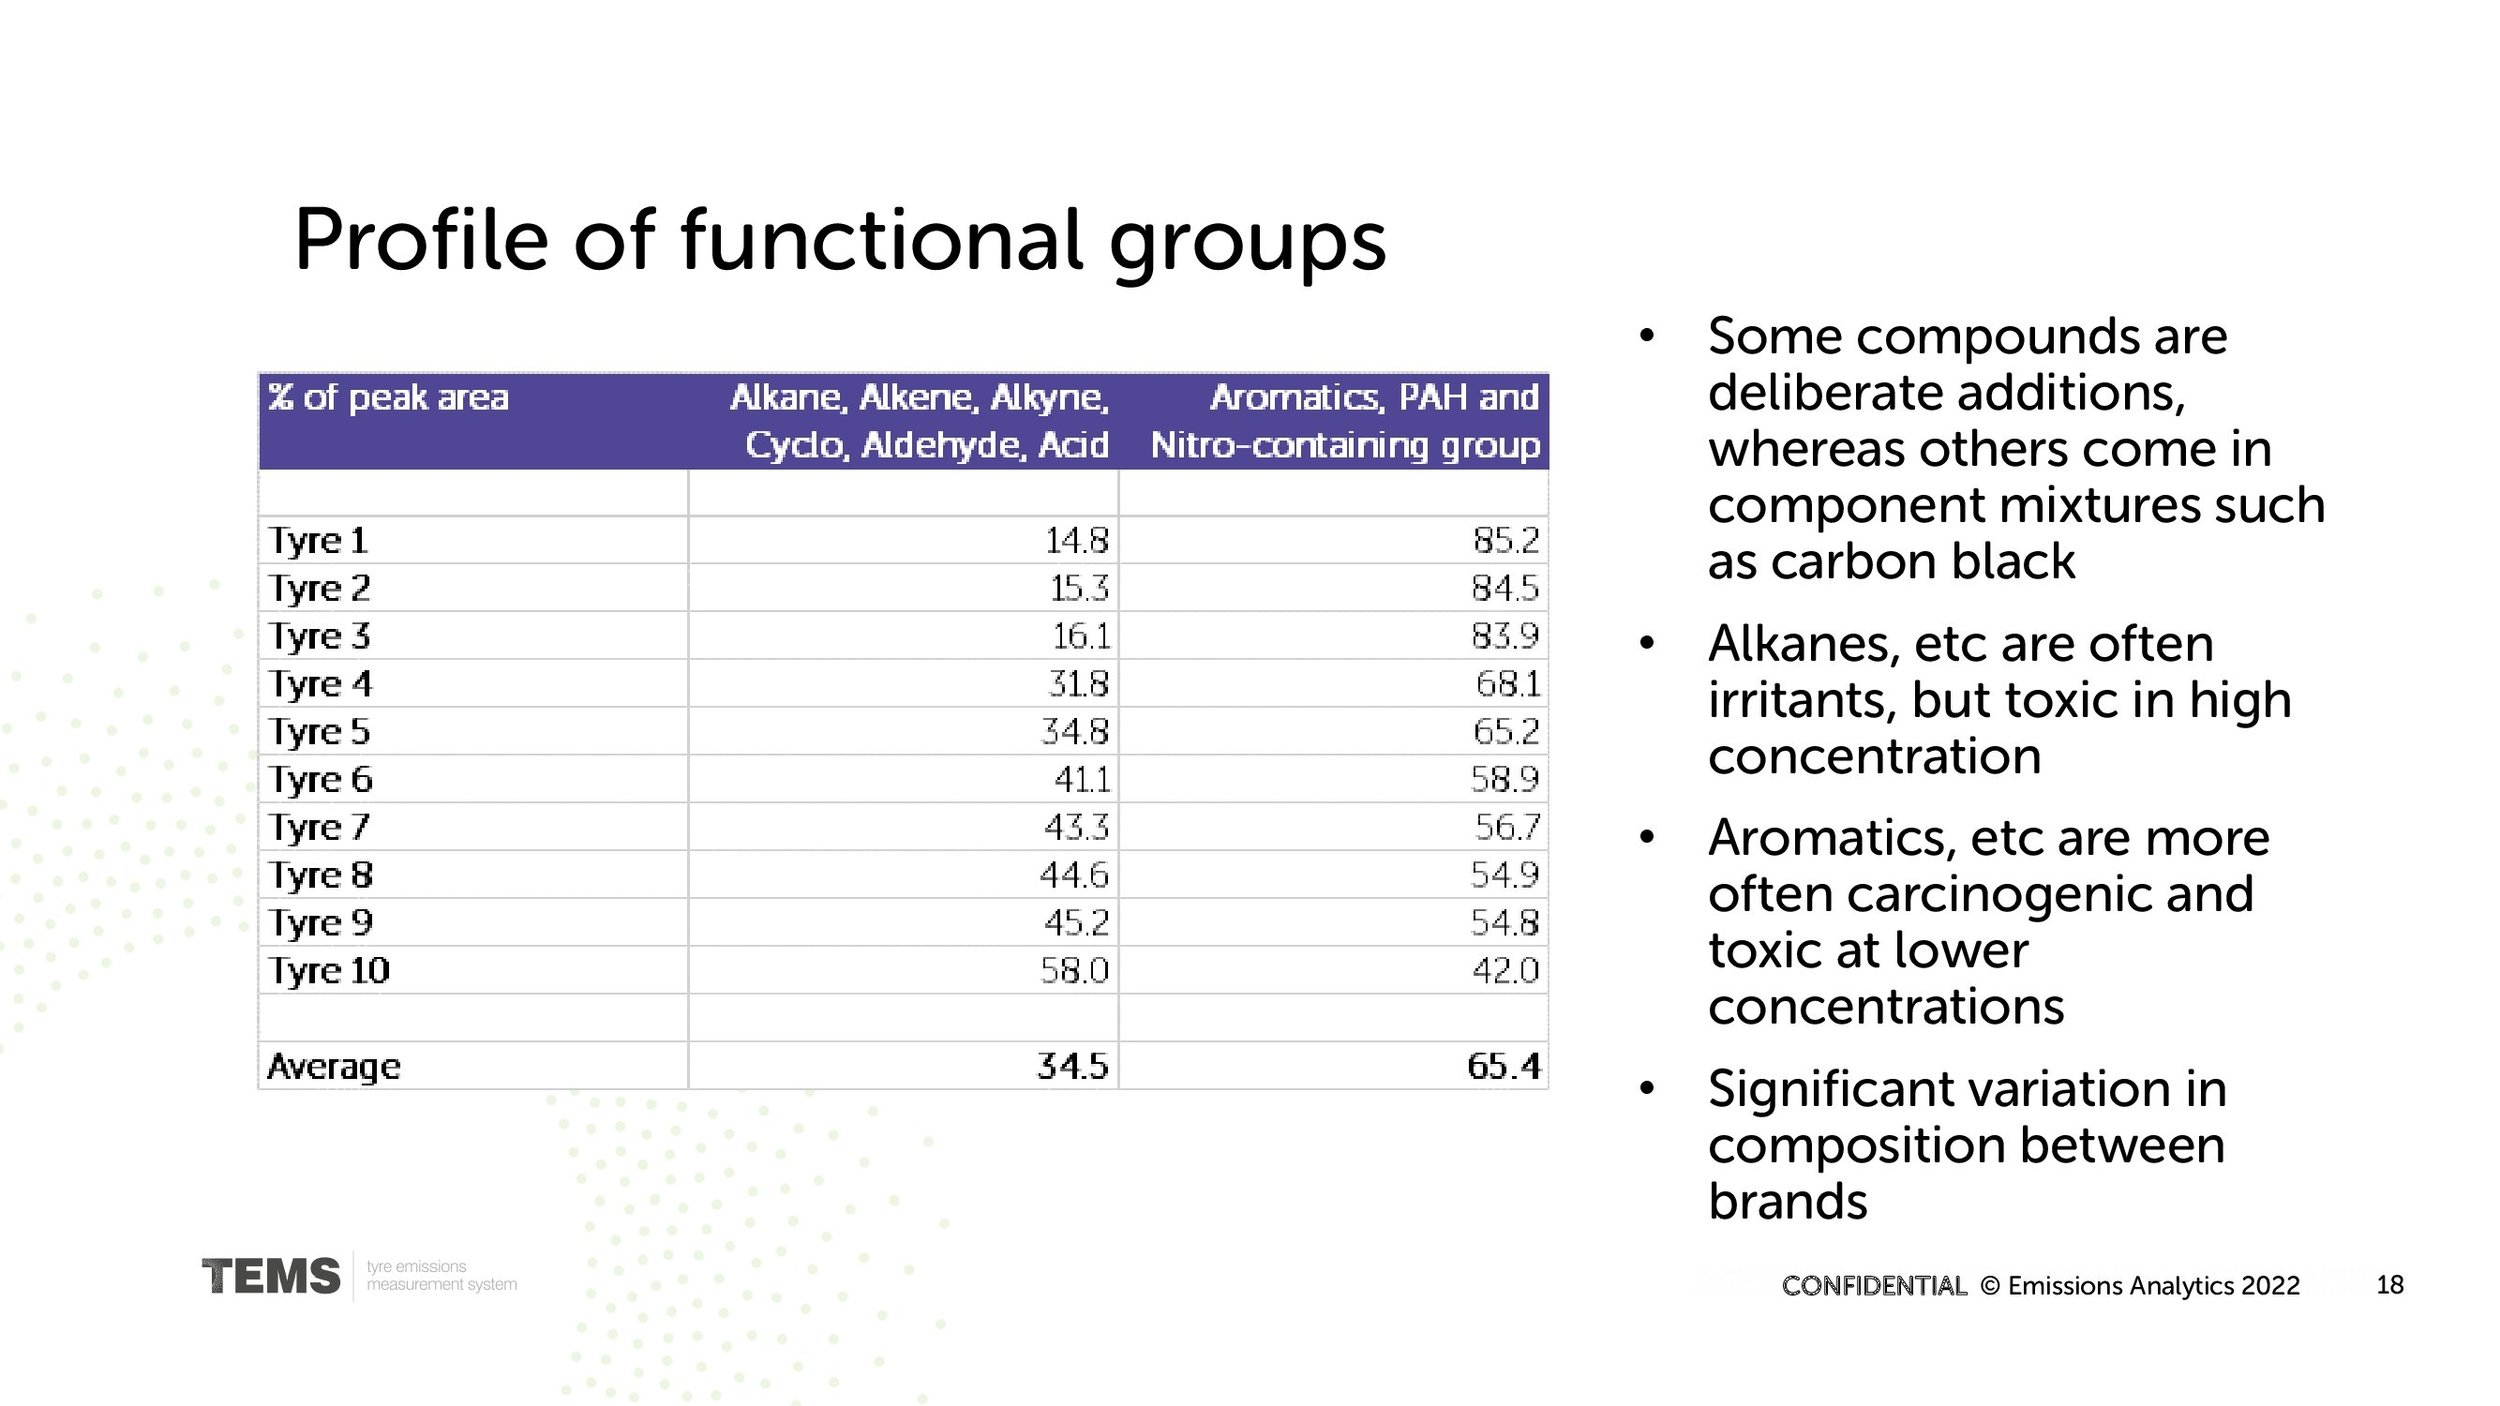
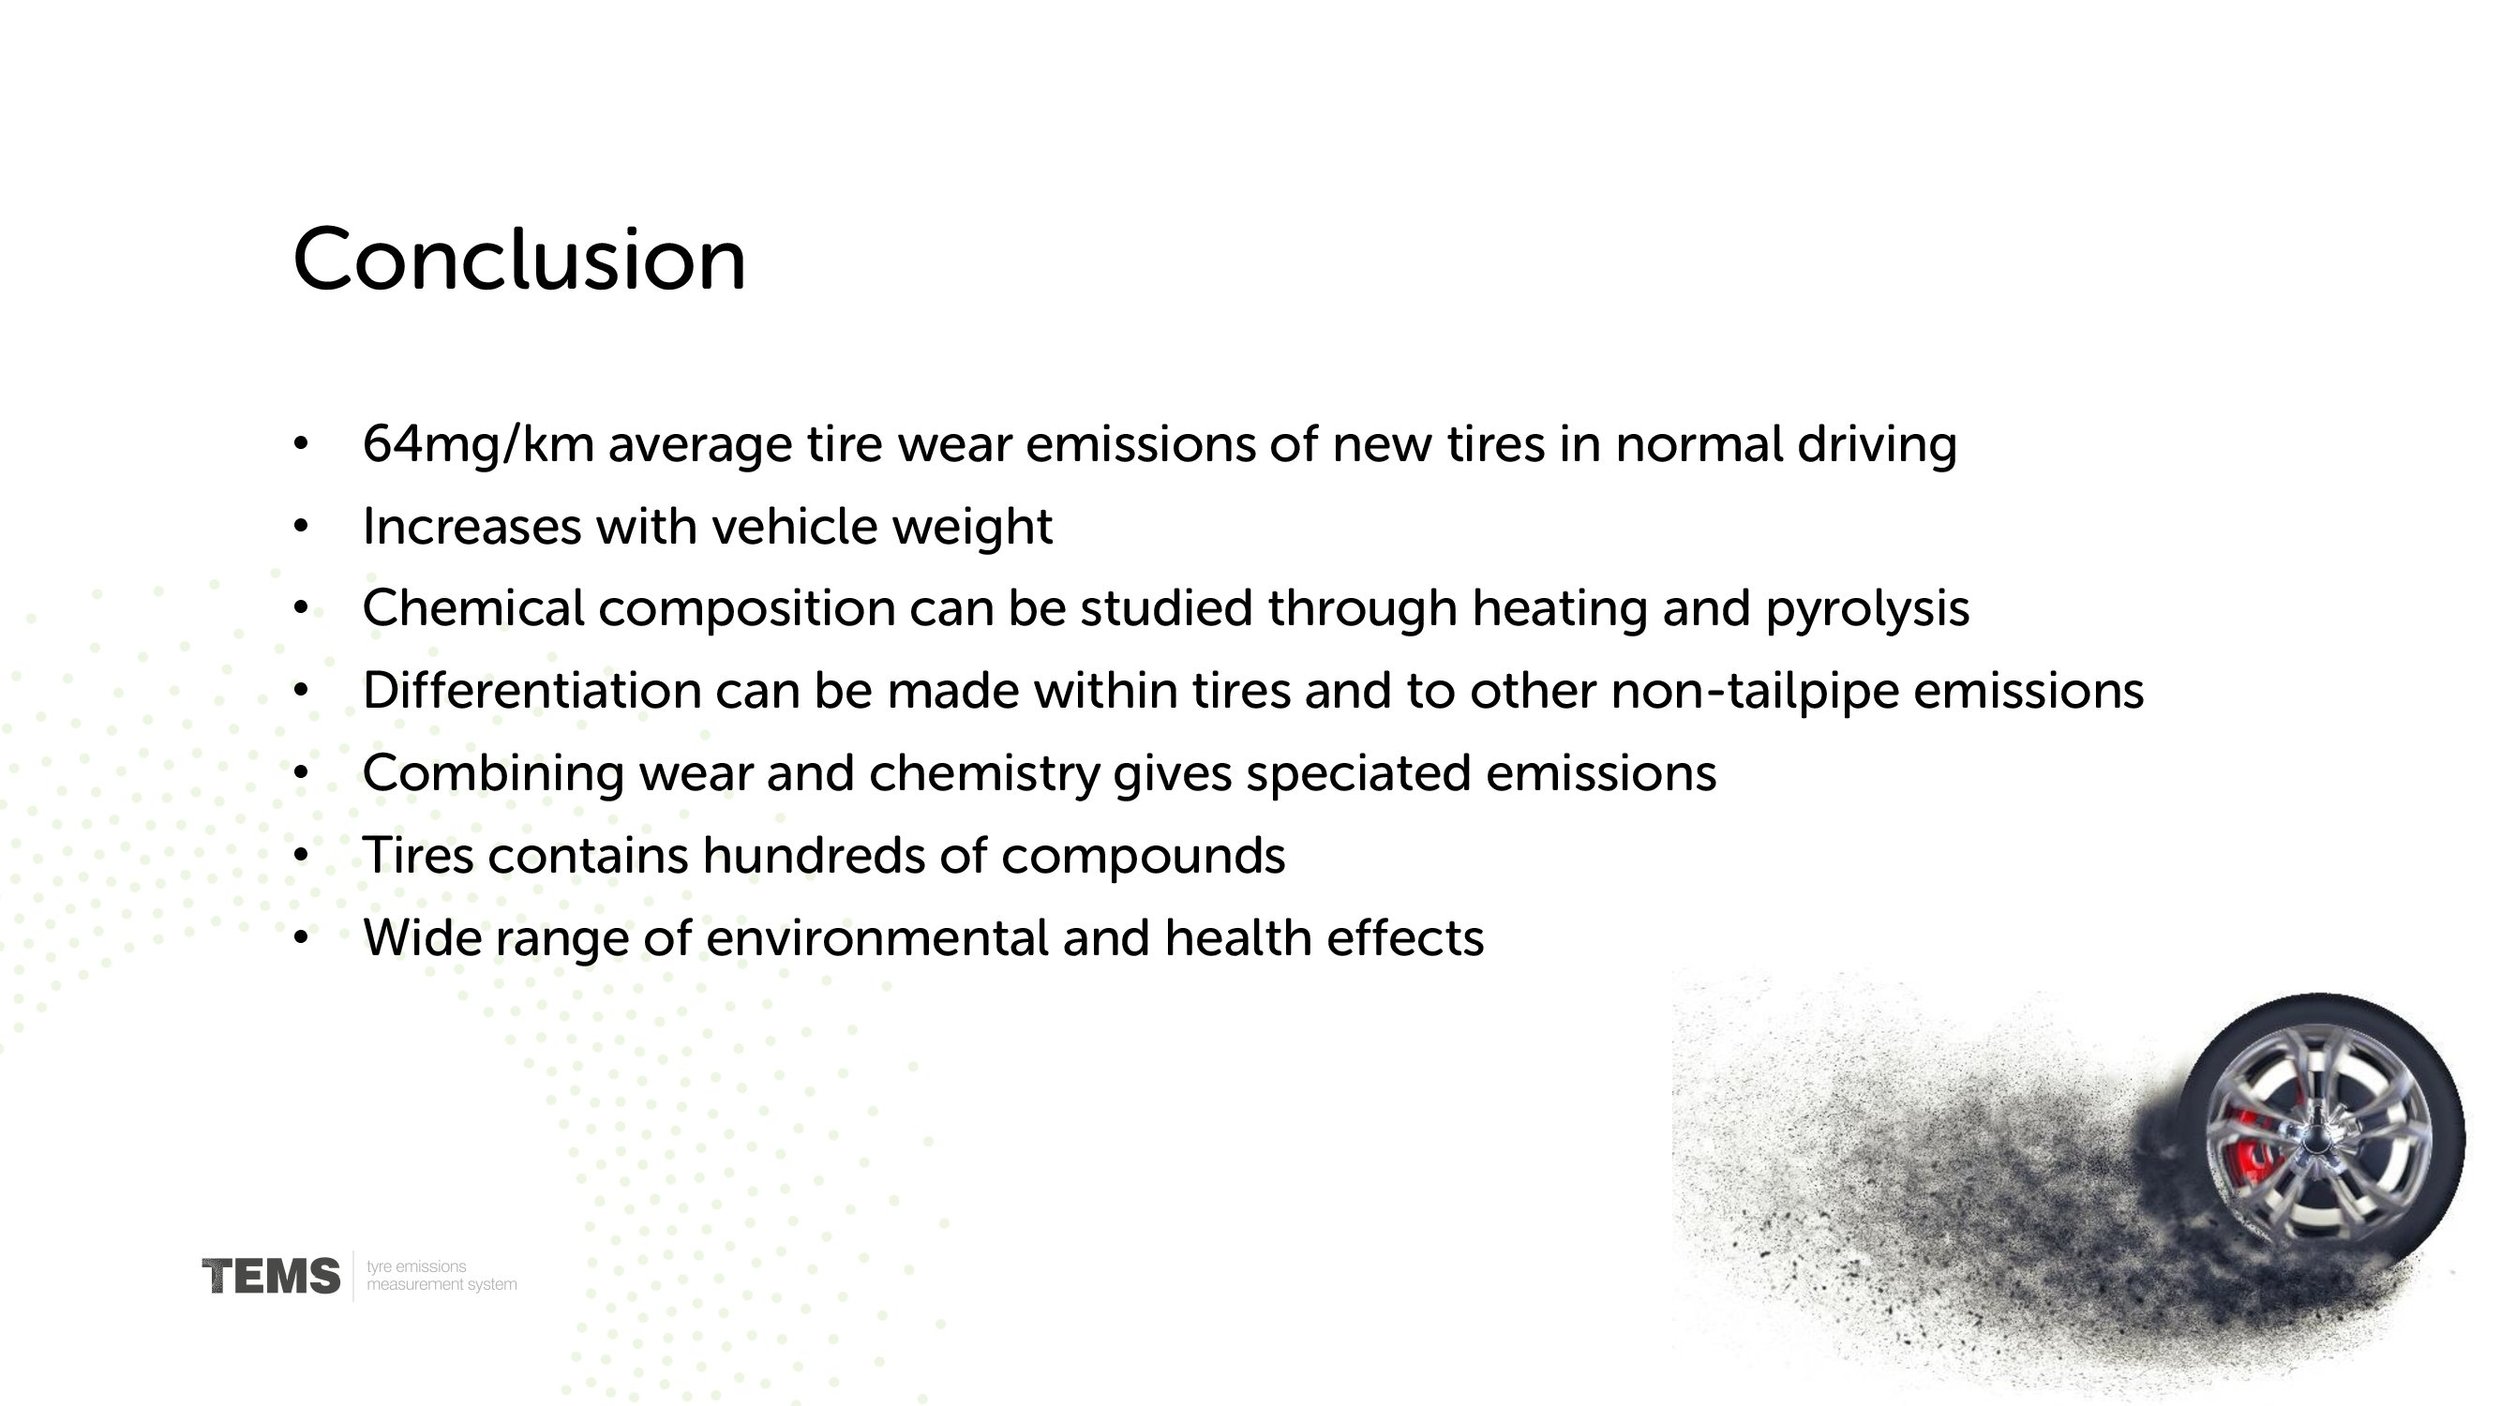

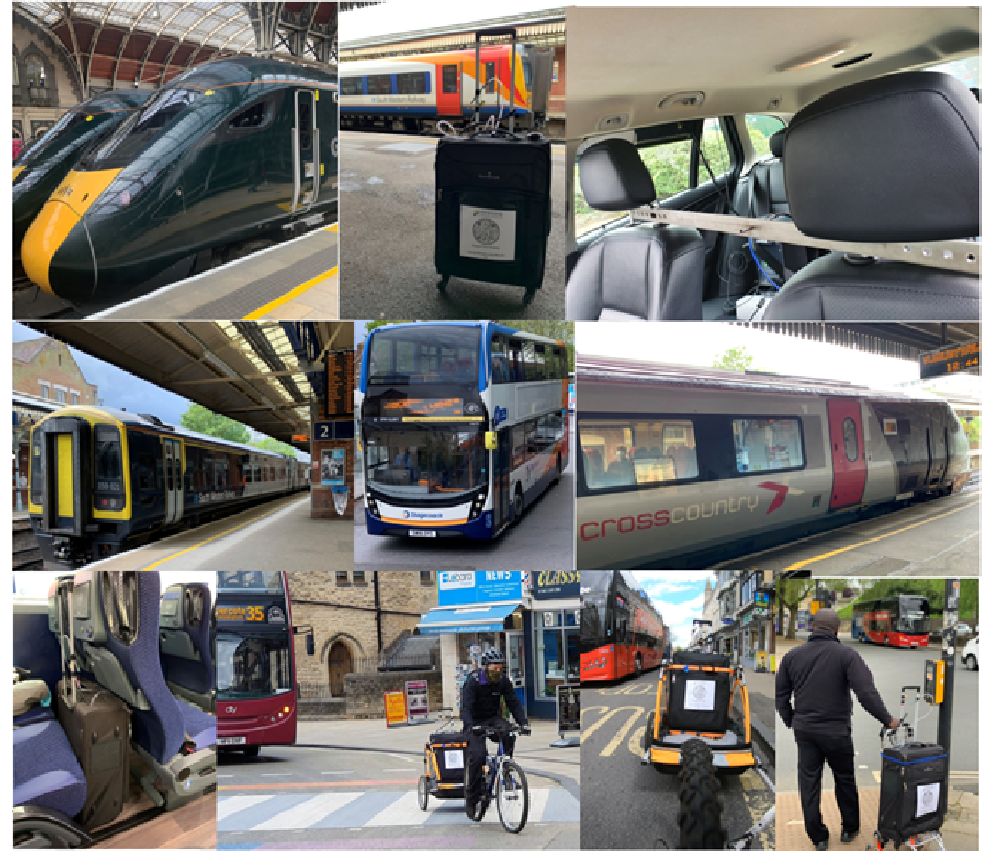
The great public transport squeeze
Public transport, almost by definition, works when it is packed. As demonstrated at the current time, with usage at around three-quarters of pre-pandemic levels, the economics of many parts of public transport are in crisis, not least at Transport for London.
Public transport, almost by definition, works when it is packed. As demonstrated at the current time, with usage at around three-quarters of pre-pandemic levels, the economics of many parts of public transport are in crisis, not least at Transport for London. A similar pattern is seen with environmental impact: per passenger, a full bus has lower carbon dioxide (CO2), nitrogen oxide (NOx) and particulate emissions than a car; but a near-empty bus is worse. But there is another, less well understood, aspect of public transport regarding the users’ exposure to pollution while travelling, which presents a further challenge to rebuilding these modes. Looking forward, not just do emissions and economics need to be considered, but also the comfort and health of passengers.
To study this, we tested a range of transport modes between central London and Oxford city centre, a distance of approximately 50 miles (80 km) as the crow flies. This project was funded by the TRANSITION Clean Air Network through the first round of its Discovery & Innovation Fund in 2021¹.

The main pollutants of interest for this study were particles – both mass and number – and volatile organic compounds (VOCs). These are likely to be the most problematic pollutants in confined spaces, and this selection mirrors the work on passenger car interior air quality work at the UNECE and CEN Workshop 103². To measure these, we used the V2000 from National Air Quality Testing Services for particles³. For VOCs, samples were collected in thermal desorption tubes – using both passive and active sampling – and then analysed in a two-dimensional gas chromatography system: GCxGC-TOF-MS from SepSolve Analytical and Markes International. Due to limitations in the study, most journeys were undertaken only once and, therefore, more data would be required to understand variability between exposures on different days.
The transport modes tested were the electric train, diesel train, diesel coach, diesel and hybrid bus, battery electric vehicle (BEV), diesel internal combustion engine (ICE) vehicle, bicycle and on foot. Most of these vehicles were relatively modern, as shown in the images above. The car journeys were point-to-point from London Paddington station to Oxford High Street, whereas the others – except bicycle and on foot – were multi-stage journeys, trying to achieve the most direct route. For example, the diesel train was direct between the cities with an added bus journey to Oxford city centre. The least direct route involved the London Underground, an electric train, then a diesel train and a bus.
Before getting into analysis of the vehicles, it is important to say that, generally speaking, active travel by bicycle or on foot led to among the lowest pollutant exposures, even in the city of Oxford, although there was significant variability between journeys. Although the traveller was exposed to spikes in pollutants, especially from other vehicles, the level of dilution with fresh air was high. However, cycling or walking is not a viable substitute mode for the whole journey from London to Oxford.
The table below shows the estimated total mass exposure to VOCs, per passenger, split into functional groups, for the different journeys, factoring in the trip duration and volume of air inhaled due to the activity level involved. Simplistically, the VOC functional groups have been presented in increasing order of potential toxicity, from alcohols at the lowest level to polycyclic aromatic hydrocarbons (PAHs) and nitrogen-containing compounds, which are often carcinogenic.
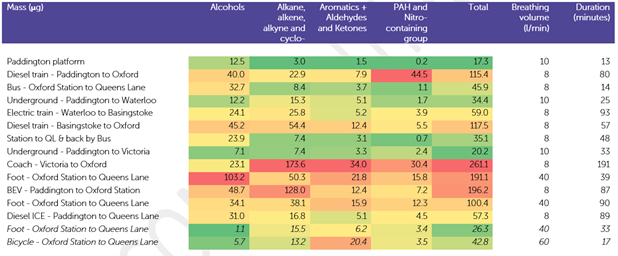
Overall, the coach generated the greatest VOC exposures, particularly in the alkane and aromatic groups. The highest PAH exposures were on the direct diesel train to Oxford. Electrified public transport typically saw low exposures, indeed lower than the BEV passenger car. In fact, the exposures in this brand-new BEV were almost four times higher than the nine-year-old diesel car. This may be due to the BEV being a smaller city car, whereas the diesel was a premium vehicle, which may have had a superior ventilation and filtration system. Furthermore, it is seen more widely that BEVs can have worse in-cabin pollution as energy is not applied sufficiently to the ventilation system in order to maximise range.
The coach saw the greatest overall exposures, not least because of the journey's long duration, with a significant proportion of the VOCs appearing to originate from personal care products – deodorants, shampoos, perfumes and so on – from other passengers, as shown in the table below. To perform this analysis, each VOC is allocated to a category based on its most likely source, and the unit of measurement reflects the total area under the peaks on the chromatogram. Although these personal care products are likely to be less toxic to humans at the concentrations measured, the coach also had the highest level of fumes from fuels and lubricants, which are likely to have come from other vehicles on the road, but allowed to enter and persist in the coach cabin.
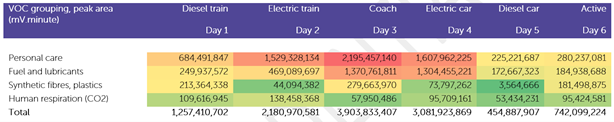
By far the cleanest vehicle, therefore, is the diesel car (a Mercedes-Benz), but the electric car is poor – the prevalence of VOCs from both personal care products and engine fumes in the BEV is consistent with the idea that the ventilation is poor in this budget car (a Vauxhall), and how important a good ventilation system is to balance filtration and air exchange rates in protecting the driver.
Is there evidence to support this when looking at the particle and CO2 results? The table below shows the average results for particulate number (PN), particulate mass (PM) and CO2. Broadly, the former two are measures of pollutant exposure, whereas CO2 is a proxy for air freshness and rate of air exchange. This immediately reveals the public transport dilemma – packing more people in tends to lead to stuffier air, just as passenger density is the key to greenhouse gas emissions reduction per passenger-mile.
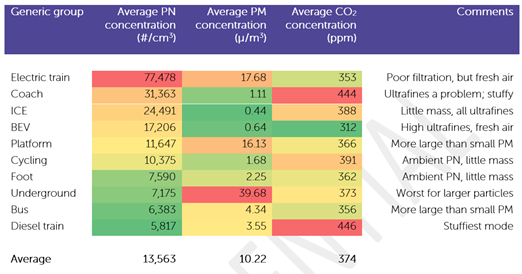
The London Underground journey – an electric train – has by far the highest PM exposures, which is likely to be fluff, metal from the tracks and human detrita. Ultrafine particles, as measured by PN, are relatively low there, in contrast to the electric train from London Waterloo to Basingstoke, which saw high particle levels. For particles, the results were similar between the two types of car, which suggests the issue is more that VOCs are off-gassing from the interior materials on the new BEV, and its ventilation system is not exchanging the air often enough to keep the concentrations down. The least fresh air was found on the coach and diesel train, which werebad not just for VOC exposures, but general comfort.
Thus far in this newsletter, we have described emissions in a vehicle-centric way. However, when the real-time data is considered in more detail, it is clear that a significant proportion of exposures on public transport are not when the vehicle is moving. Rather, the process of waiting for, boarding and alighting the vehicle, together with it letting on other passengers at stops, creates exposure spikes. The time series chart below takes the example of the journey via the Underground, electric train and then diesel train to Oxford.
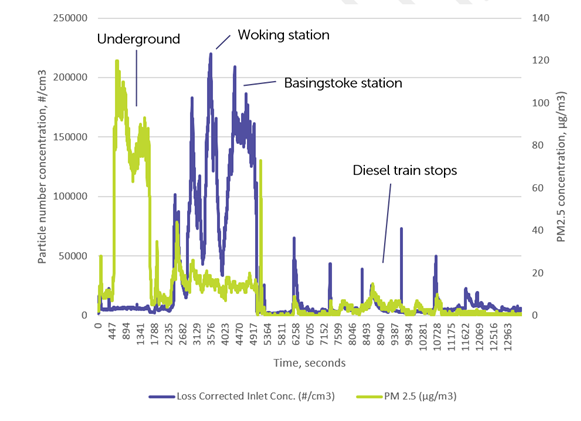
After the fluffiness of the Underground, getting onto the electric train at Waterloo showed a spike in both PM and PN, followed by PN spikes at various stations. The change, with a wait on the platform, onto the diesel train at Basingstoke had a large, persistent elevated level of PN and brief spike of PM. Much of this is due to a cocktail of diesel fumes and cooking smells from food concessions inside the station. The diesel train, once boarded, was cleaner, but with spikes at each station.
In short, public transport is getting squeezed between active travel and the car, both in economics and for health. It is not sufficient just to upgrade public transport vehicles to reduce VOC and particle exposures, but also the whole experience including interchanges, stopping patterns and waiting times. Public transport also needs to resolve the tension between wanting to squeeze as many people in for good economics and environmentals, and maintaining a good level of air freshness and comfort.
References
TRANSITION is a UK-wide network, led by the University of Birmingham in collaboration with nine universities and over 20 cross-sector partners, aiming to optimise the air quality and health outcomes of transport decarbonisation. The network (NERC ref. NE/V002449/1) is itself funded by UK Research & Innovation through its Clean Air Strategic Priorities Fund, administered by the Natural Environment Research Council. Raw data from the testing can be found in Centre for Environmental Data Analysis (CEDA) at https://catalogue.ceda.ac.uk/uuid/96c912c7c0094da2a8627d446cb06708.

Why battery durability matters for decarbonisation
Lifecycle carbon dioxide (CO2) modelling of battery electric vehicles (BEVs) typically relies on the critical assumption that the battery lasts the lifetime of the vehicle, which is around 14 years.
Are policy priorities correct?
Lifecycle carbon dioxide (CO2) modelling of battery electric vehicles (BEVs) typically relies on the critical assumption that the battery lasts the lifetime of the vehicle, which is around 14 years. However, we know that battery capacity declines over time, and manufacturer battery warranties tend only to cover the first eight years. What if battery packs last a shorter time than expected, requiring replacement during the vehicle lifetime or even leading to early scrapping of the vehicle? How would that affect the lifecycle CO2 of BEVs and impact, at the overall car parc level, our ability to achieve ambitious climate change goals.

Almost two-thirds, typically, of CO2 emissions in the manufacture of a BEV are associated with the battery , including sourcing raw materials. For an internal combustion engine (ICE) vehicle, even a mildly hybridised one, that fraction is less than 5%. Therefore, the life expectancy of the BEV battery pack is clearly crucial to the vehicle’s overall CO2 footprint – and residual valuation – in a way that is not true for primarily combustion cars.
Emissions Analytics has previously reasoned that the best route to decarbonisation for at least the next decade is to pursue a path of mass hybridisation. This is primarily due to the scarcity and cost of battery materials, which is now being seen as a result of accelerating demand and supply chain constraints. A further reason is the risk around consumer acceptance of BEVs at retail prices that are profitable for manufacturers. The argument is set out in more detail in a previous newsletter. The analysis uses a proprietary lifecycle model created by Emissions Analytics, based on a meta study of academic literature and information from manufacturers. The key input assumptions are set out in that previous newsletter – of note is that it is assumed that the grid is decarbonised by 50% from 2030, but manufacturing emissions remain constant. Battery life is assumed at eight years by default for our purposes here, reflecting manufacturer confidence levels as revealed by warranty durations.
In this newsletter, we compare three different vehicle sales scenarios: an ‘ICE baseline’ scenario with 50% gasoline and 50% diesel vehicles; a ‘BEV transition’ model with 75% BEVs in 2031 and 100% in 2035; and a ‘Hybrid strategy’ with 100% full hybrids (FHEVs) throughout.
The clear conclusion is that, in 2050, the deadline for net zero emissions for many countries including the UK, the cumulative CO2 emissions from the manufacture and usage of vehicles is similar whether we go for the direct BEV transition or the Hybrid strategy, as shown in the chart below.

Compared to the ICE baseline, the direct BEV transition reduces CO2 by 1% more than the Hybrid approach. The chart makes it clear how important electrification, generically, is to reducing CO2 from transport, but it raises the question whether the additional gains from the pure BEV model warrant the investment required – that investment not just being subsidies, tax incentives and government infrastructure investment, but also by the car buyers themselves due to higher purchase prices. This timespan, however, does not bring out the longer-term benefits of BEVs, which can be seen if we look at annual, rather than cumulative, reductions in CO2, as shown in the chart below.

As a result, after 2050, the cumulative advantage from the BEV transition gradually widens as old ICE vehicles drop out of the parc and the lower in-use CO2 of BEVs comes to the fore. By 2070, the lead in cumulative CO2 emissions of BEVs has reached 9% over the Hybrid strategy, and a full 34% compared to sticking entirely with ICE vehicles. This is a significant reduction, but 49.2 megatonnes of CO2 still come from an entirely BEV parc in one year – hardly “zero emission.”
If the assumption around an eight-year battery life is then flexed, we can see that it has a significant impact on the end result of electrification. If, in practice, batteries last on average as long as the chassis – 14 years – then by 2050 the BEV transition scenario would deliver 13% points more CO2 reduction than with eight-year battery life, a figure that rises to 16% points by 2070, as shown in the chart below. So, in 2070, the 9% CO2 reduction from faster BEV penetration over the Hybrid scenario is dominated by an additional 16% that could come from better battery life.

So, we conclude that, as long as we urgently electrify – whether BEV, PHEV or FHEV – we will achieve significant, and similar, CO2 reduction by 2050. Additional penetration of BEVs delivers extra CO2 reduction only after 2050, and it comes at a cost and with execution risk. Improving the lifespan of batteries makes a bigger difference to CO2 emissions in particular by 2050. Therefore, this suggests that policy needs to be more attentive to the quality of the current generation of BEV products than simply the number on the road.
In a pessimistic scenario where batteries only last on average of six years – which would be costly both in terms of CO2 and to the underwriters of manufacturer warranties – the Hybrid strategy would be 10% better in 2050 than the BEV transition, and still be better, by 6%, in 2070, as the constant renewing of batteries outweighed the lower in-use emissions of BEVs. This is not a likely scenario, but makes plain the sensitivity of our decarbonisation policy to a complex and opaque piece of engineering produced by the private sector.
It could be argued that recycling batteries would mitigate the problem of poor durability, and shift the evaluation more in favour of BEVs. While this might become true in the future, the recycling infrastructure does not yet exist at scale and the energy required to separate the chemical components, clean them up and then assemble into a new pack is also significant. It is currently unclear whether the saved mining emissions is greater than the CO2 overhead of the recycling. A further criticism of this analysis might be that the CO2 in manufacturing both the car and battery does not reduce over time in the model. This may happen, but is not certain. Equally, no benefit from reducing emissions from liquid fuel production, or the use of biofuels or synthetic fuels has been assumed.
So often, when talking of decarbonisation, the dates mentioned seem far in the future. Using the same model as above, we can make the numbers real and immediate by tracking the CO2 reductions since the start of 2020. Emissions Analytics compiles its “CO2 totaliser”, which compares the cumulative CO2 emitted by cars sold since January 2020 under our current BEV transition policy against the two alternative scenarios. The first comparison is to a car market that remains 50% diesel and 50% gasoline ICE. The second is to a market completely made up of FHEVs. The early moves by the UK into BEVs has currently led to more CO2 emissions than on both these alternative scenarios

The 3.3 million vehicles sold in the UK since January 2020 emitted in total 6.153 megatonnes more CO2 than would have been the case if all vehicles sold had been full hybrids, which typically have batteries between 1.5 and 5.0 kWh in capacity, and 2.360 megatonnes more than if all vehicles had an ICE. This is not surprising as BEVs – with batteries typically between 60 and 100 kWh – have much higher emissions from the manufacture, which is then offset by lower emissions during use. This makes plain that calling BEVs ‘zero emission’, solely because they have no tailpipe, is a nonsense. The surplus CO2 is even greater compared to a market made up only of FHEVs, because they have manufacturing emissions only slightly higher than ICE vehicles, but around 30% lower in-use emissions.
The annual CO2 budget for the UK is approximately 700 megatonnes, based on consumption emissions and including aviation¹. This value contrasts with territorial emissions, which only measure CO2 arising from activity in the UK – this is particularly relevant where a high proportion of vehicles are manufactured overseas. Around 27% of total emissions are from transport² and, therefore, the 6.153 megatonnes excess accounts for around 1.6% of total transport emissions.
In summary, with shoulders firmly to wheel of BEV rollout, lubricated with a flow of taxpayer subsidy, it would be right to tally up whether the approach is leading, or will lead, to significantly reduced emissions. In a market dominated by BEVs, we must be conscious that the dominant element of CO2 emissions is likely to become the replacement of batteries rather than the energy required to propel the vehicle. This supports the idea that policy should perhaps focus more on the longevity and durability of these batteries, rather than a singular focus on BEV market share. We have consciously simplified the options to illustrate this underlying point, including not factoring in the potential for PHEVs due to the sensitivity of their emissions to user behaviour.
After all, the aim is surely to reduce CO2 emissions and slow global warming, rather than to promote BEVs as inherently better products – if they were so superior, they would not require subsidy at all.
Are cars sinful?
This is no polemic for or against the car. Nor about petrolheads. Nor environmentalists. This is about the chemicals that are to be found inside cars, and the importance of good ventilation, to avoid occupants gently steeping in a cocktail not of their own making.
This is no polemic for or against the car. Nor about petrolheads. Nor environmentalists. This is about the chemicals that are to be found inside cars, and the importance of good ventilation, to avoid occupants gently steeping in a cocktail not of their own making. The SIN is the ‘Substitute It Now!’¹ list developed by the International Chemical Secretariat, a largely government funded organisation in Sweden² – a list of over one thousand chemicals with harmful health or environmental effects, which they suggest should be removed from consumer products. But do we find any of these in modern cars?

This is not a new problem, but one the significance of which we are only beginning to understand. As discussed in previous newsletters, the emissions from vehicle exhausts have improved significantly over the last ten years. Initially it was mainly seen as particulate reduction, as the widespread cheating on nitrogen oxide (NOx) emissions – of which Dieselgate was emblematic – was only resolved from around 2018 when official laboratory results were validated with an on-road test called Real Driving Emissions. The remaining pollutants of most concern in the exhaust are carbon dioxide (CO2) and a range of volatile and semi-volatile organic compounds (VOCs and SVOCs).
At the same time, the construction of vehicles has become more sophisticated. While generally to the benefit of consumers in terms of utility and design, the potential impact on the health and comfort of vehicle occupants has not been fully considered. The increased use of glues in vehicle manufacture and superior construction methods creating an almost perfectly sealed cabin come with downsides. Significant hurdles in understanding the consequences have been difficulties in measuring the compounds of interest, and the lack of standards to measure vehicle interior air quality (VIAQ). This is beginning to change, led by South Korea and Japan, which collectively regulate nine different VOCs in the cabin.
Emissions Analytics has been working on this from both angles. It has been an active participant in a standardisation workshop under the Comité Européen de Normalisation (CEN)³, aiming at measuring the air quality inside light-duty vehicles in terms of particle ingress from outside and CO2 build-up. In parallel, it has been developing methods for measuring the presence of VOCs and SVOCs in cabin air, and how they might be emitted from the interior materials. The two areas are linked because the worse the ventilation and filtration system, the greater the likelihood of the accumulation of noxious organic compounds. Multiply that by the length of time typically spent in vehicles and the human exposures could be greater than to ambient air pollution.
To get a measure of the problem, if we chemically analyse the interiors of cars, do we find any of the compounds on the SIN List? We took a small sample of recent model year vehicles in Europe and analysed a range of interior materials, including dashboard plastic, seat material and carpets. Each sample was analysed using two-dimensional gas chromatography coupled with time-of-flight mass spectrometry, with sample introduction via microchamber – a system provided by Markes International and SepSolve Analytical.
One vehicle in particular gave interesting results: a top-selling, European-made small car from 2020. We tested the carpet in the boot and footwell, dashboard plastic and the seat covering material. Across these sample locations, 16 of the SIN List compounds were identified, as shown in the table below. The metric is the percentage of the peak area – in other words, the area under the compound’s peak on the chromatogram expressed as a proportion of the total peak area of all organic compounds identified. It is a reasonable approximation of the relative abundance of the SIN List compounds in each sample.

While just 1.23% of the organic compounds found in the dashboard plastic were on the SIN List, this exceeded 11% for the footwell carpet. Furthermore, its most prominent compound was diethyl phthalate. Generally, phthalates are a synthetic substance commonly used to make plastics more flexible. A growing body of research suggests that many of the compounds in this group have undesirable health effects, including reducing fertility. As a result, regulations are beginning to restrict their use, for example, under REACH in the EU, the concentration of four target phthalates cannot together exceed 0.1% by weight in consumer goods. Diethyl phthalate is not one of these four, and the research on its health effects is currently limited, but its high concentration in the footwell carpet should warrant additional focus.
Beyond phthalates, a way to assess the health dangers of the other compounds on the SIN List is to look at the ‘hazard statements’ produced under the Globally Harmonized System of Classification and Labelling of Chemicals (GHS), an international consensus system developed by the United Nations for classifying and labelling hazardous chemicals. Hazard statements provide standardised wording as to the nature and degree of the threats. For example, ‘H350’ indicates a chemical that may cause cancer. An individual compound can have multiple hazard designations.
If each of the compounds identified in the vehicle are scored according to the number of hazard designations, and these are then grouped generically, we obtain the totals shown in the table below. Included in this assessment are those assessed as ‘persistent bioaccumulative toxic’ compounds, which is a separate hazard category. These compounds do not break down easily in the environment or living creatures and so progressively build up.

At a high level, it can be seen the most prevalent health effects are irritation or damage to the skin, eyes, throat and lungs. The boot carpet has the largest number of designations, and contains a relatively high level of octamethylcyclotetrasiloxane, which is suspected of damaging fertility. The harms are not just to humans, for example naphthalene is also highly toxic to fish and other aquatic life.
The number and extent of these compounds present in common materials in vehicle interiors points to action needed by manufacturers to address the potential toxicity to occupants. Beyond the SIN List, we have also identified a ‘PFAS’ in the same vehicle’s seat material.
Per- and polyfluoroalkyl substances (PFASs) are manmade organofluorine compounds, first created in the mid twentieth century and which became popular for their water repellent, stain resistant and non-stick features. The problem is that they do not break down readily in the environment, hence being described as “forever chemicals”, or persistent organic pollutants. This bioaccumulation means that it is believed that they are gradually building up inside most living creates as well as the wider environment.
The health effects of PFASs were brought to wide public attention for the first time in the 2019 film Dark Waters, where compounds based on perfluorooctanoic acid (PFOA), a subset of PFASs, were released from an industrial source in West Virginia, USA. The evidence as to the environmental effects has continued to accumulate. An article in December 2021 in Environmental Science & Technology shows that these persistent compounds do not simply get washed into the sea and diluted into insignificance. Rather, waves crashing on the shore recirculate the chemicals into the air and onto land⁴. This increases the human exposure and associated health effects, which include cancer, thyroid conditions and colitis.
The compound identified was 1H‚1H‚2H‚2H-perfluorooctan-1-ol – chemical formula C8H5F13O – a chain of eight carbon atoms with 13 fluorine atoms attached. The chromatogram from the seat sample below shows this compound. Of the total peak area of organic compounds, it accounted for 0.61%. The hazard classification says that it may cause damage to organs through prolonged or repeated exposure.
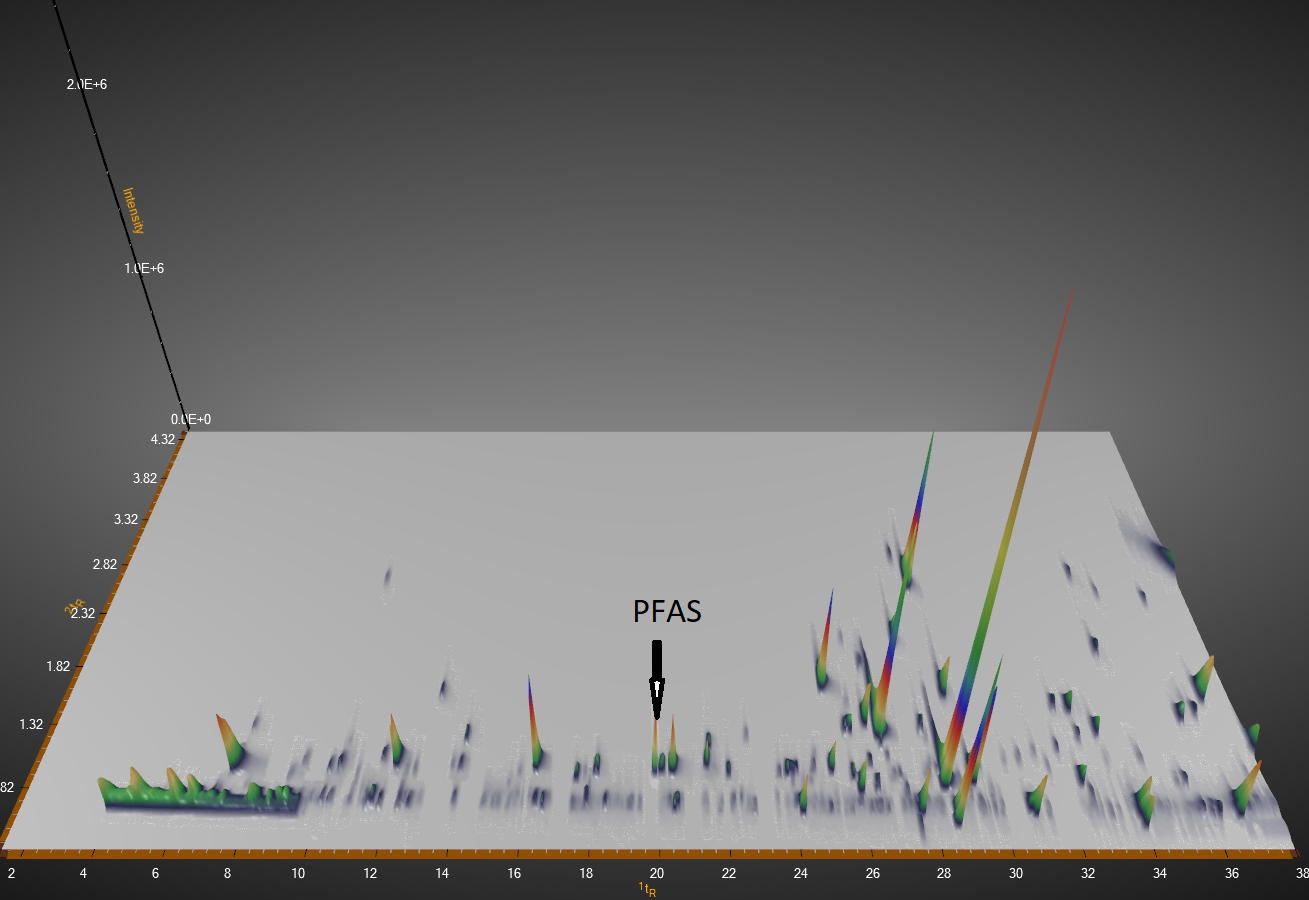
It should be added that it is not being claimed that exposure to this seat covering will have direct health effects. Nevertheless, by the persistent nature of these compounds, they are very likely eventually to end up in the environment, be recirculated and potentially inhaled or ingested by humans or animals. PFASs from a car seat add to this gradual and irreversible accumulation.
In the longer-term, the objective should be to engineer these compounds out of vehicles, where there are viable alternative components. Growing regulations around materials, from REACH in Europe and from the Environmental Protection Agency in the US, together with emerging regulation of vehicle interior air quality led by Korea, Japan, Russia and China, will force the pace. But how should vehicle owners mitigate the effects in the shorter run?

The concentration of VOCs in cabin air generally increases as the vehicle heats up. A car parked in the sun will see more chemicals released from the interior materials into the air, recondensing once the vehicle cools back down. To this chemical soup is added particles and NOx that enter the car through the ventilation system as the vehicle moves, plus the CO2 exhaled by the occupants.
Although not the most glamorous part of a car, a good heating, ventilation and air conditioning system is the best way to limit exposure. The benefits of maintaining fresh air in confined spaces has been brought to prominence through the Covid pandemic. The ideal is to keep the ventilation on fresh air mode – rather than recirculation – but this relies upon excellent filtration to minimise the particle and NOx ingress. In balancing this trade-off, the best vehicles are many times better than the worst, as described in previous newsletters. Therefore, rating vehicles in a fair and comparable way is urgently needed.
Fortunately, both the car and filtration industries have been actively involved in standardisation of test methods, including through CEN Workshop 103, initiated by the AIR Alliance⁵, which is due to publish its work soon. Together with the work on vehicle interior air quality through UNECE, it is quite possible to see how these new tools in measurement and evaluation can bring about healthier, and perhaps SIN-free, cars for both the occupants and the wider world.
Archive
- AIR Alliance 3
- Air Quality 38
- Audio 3
- Climate Change 14
- EQUA Index 21
- Electrified Vehicles 28
- Euro 7 3
- Fuel Consumption/Economy 20
- Fuels 4
- Infographic 18
- Media 4
- NRMM/Off-road 3
- Newsletter 103
- Podcast 7
- Presentation/Webinar 18
- Press Release 19
- Regulation 16
- Reports 4
- Tailpipe Emissions 49
- Tyre Consortium 2
- Tyre Emissions 26
- Vehicle Interior 6