

The even more hidden life of tyres...
If the ‘bio’ components in liquid fuels are not well understood – as discussed in our last newsletter – the composition of vehicle tyres verges on mysterious.
If the ‘bio’ components in liquid fuels are not well understood – as discussed in our last newsletter – the composition of vehicle tyres verges on mysterious. Fuels have attracted close focus over the last few decades primarily because of the pollutants, especially particles, released when the fuel is combusted in an engine. More recently, the subject of upstream carbon dioxide emissions from the production of fuel has risen up the agenda with concern about climate change. In contrast, although tyres clearly shed significant amounts of material into the environment, their wear has not been regulated and, therefore, where the tyre particles go and what they do to humans and the environment has generated little interest.
Tailpipe emissions continue to fall and, in respect of particles, leave tyre wear emissions somewhere between ten and a thousand times greater than the tailpipe emissions from a typical car, according to earlier Emissions Analytics’ research. This, together with the increasing weight and torque of new vehicles, has led at last to a focus on tyre wear emissions. As a result, a number of important questions are now being posed.

First, what is the rate of tyre wear emissions in real-world driving, quantified either as mass or number – the latter being important to capture potential large numbers of ultrafine, near-massless particles? Second, to what extent do particles measured in the environment come from tyres? Third, what is the chemical composition of tyres, and how does that differ between brands? Fourth, what pollutants do tyre wear particles leech into the environment once released? This newsletter considers approaches that could be used to build a better understanding on these points.
From previous Emissions Analytics' newsletters – for example, https://www.emissionsanalytics.com/news/whats-in-a-tyre – the total mass loss from the four tyres of a vehicle averages around 64 mg/km when the tyres are new, falling to about 32 mg/km over the full life of the tyres. Approximately 90% of the mass shed is from larger particles up to at least 10 µm in diameter, whereas around 90% of the particle number is ultrafines down to 10 nm and below. Wear rates differ by a factor of around two to three times between the fastest and slowest wearing.
While we have a good understanding of the rate at which tyre wear particles are shed from vehicles, we have little idea where the particles go. Broadly, they will end up in soil or water, although some maybe trapped in storm water filtration systems. The distance the particles travel from the carriageway depends on factors such as the particle mass and they can therefore accumulate on the verge or be blown to neighbouring fields and gardens. Particles that fall to the carriageway typically get washed into drains and end up in rivers and the sea. According to a 2017 report, 28% of primary microplastics in the ocean are from tyres¹. The proportion that become airborne eventually settles on soil or water. Therefore, it should be expected that tyre material is observed in samples of water and soil taken in almost any location.
A potential method for estimating the amount of tyre material in a sample from the environment is to use fingerprinting. The complicating factor is that a tyre particle released into the environment will get mixed up with many other sorts of material. By using a pyrolysis technique – burning a sample in the absence of oxygen – leads the tyre material to break down in a predictable way, creating a ‘pyrogram’. Emissions Analytics has been building a reference database, or ‘library’, of the pyrolysis products from a wide range of new tyres. By matching the patterns from the environment samples, it is possible to start to understand what fraction of the sample is from tyres – a process that is called ‘source apportionment’.
In principle, this can be used not just to see tyre material generically, but also the presence of wear from particular tyre brands, where they offer unique chemical fingerprints. It should be noted that pyrolysis causes some of the compounds to break down – albeit in predictable ways – and therefore chemicals observed after pyrolysis are not necessarily the same as those in the tyre when new, although they may indicate compounds that will be released as tyres naturally degrade over time.
To illustrate the approach, Emissions Analytics tested samples from ten different tyre brands using a pyrolysis front end on its two-dimensional gas chromatography and time-of-flight mass spectrometry laboratory, supplied by Markes International and SepSolve Analytical. This allows excellent separation, identification and quantification of organic compounds in the sample.
The table below shows the top five most prevalent compounds from the pyrolysis of the ten samples. The metric is the ‘peak area’ percentage, which is the area under the peak for each compound as a share of the area under all the peaks on the chromatogram added together. It is not an explicit quantification, but nevertheless a good indication of relative importance.

A number of the most prevalent compounds offer a characteristic odour, including limonene², β-guaiene and longifolene. These come from natural sources and include sweet, woody, dry, guaiacwood, spicy and powdery smells. Most of these compounds are not clearly toxic, although cyclohexane‚ 1‚2‚4-triethenyl- is an irritant to eyes and skin, and desogestrel is a hormone. Two of the most prominent, androstan-17-one‚ 3-ethyl-3-hydroxy-‚ (5α)- and 2-[4-methyl-6-(2‚6‚6-trimethylcyclohex-1-enyl)hexa-1‚3‚5-trienyl]cyclohex-1-en-1-carboxaldehyde, are complex compounds that have unknown characteristics. Overall, these compounds are relatively high-order, complex, heavy hydrocarbons and oxygenates.
One of the brands has a noticeably different mix of chemicals in its composition: Tyre 10. As can be seen in the above table, it only has three of the top compounds present, whereas most of the compounds are present in the other brands. Furthermore, the Tyre 10 sample contained a number of prominent compounds that were unique to it. These included cis-Thujopsene – a terpene that is an essential oil found in conifers – linolenyl alcohol³, eicosapentaenoic acid⁴, sorbic alcohol⁵ and the unknown bicyclo[3.1.1]hept-3-ene-spiro-2‚4'-(1'‚3'-dioxane)‚ 7‚7-dimethyl-.
Therefore, using this approach, the pyrolysis results from environmental samples can be compared to these reference measurements to estimate both the generic presence of tyre wear material, but also potentially the approximate split between different types of tyre. As relatively complex hydrocarbons, they do not generally occur naturally, although it should be noted that there are potentially other sources of some of them, such as from industry. It is therefore important to get as much detail on the tyre composition as possible, in order to uncover specific chemical markers that can be used for robust source apportionment.
The same analyses can be used to probe into the chemical composition of tyres and understand the differences between different tyre brands. The chart below is a plot using ‘principal component analysis’ (PCA) to understand what groups of compounds – the principal components – account for the most difference between the tyres. The aim of the method is to reduce the number of dimensions to something we can easily understand from samples that typically contain over one thousand organic compounds. It trades a little accuracy to aid understanding.
The first principal component accounts for 80% of the observed differences. The second component gives a further 12%, with 4% from the third principal component. In these dimensions, there are three broad groupings: Tyres 1, 2 and 3 are separated from the rest in the first dimension, Tyres 5-10 in the second dimension, while Tyres 4, 5 and 10 separate in the third dimension.
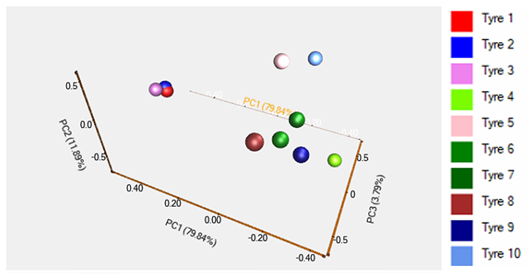
Tyres 1, 2 and 3 are closely clustered and share a number of compounds in common that are less prevalent in the others, including toluene, 1,3-pentadiene and methylenecyclopropane. The first two of these present potential toxic danger if swallowed or inhaled. Tyres 5 and 10 occupy a similar position distinct from the other samples and disproportionately share 2-pentene and 1,4-cyclohexadiene, 1-methyl- in common, which present similar toxic risks. A compound with a leathery smell that can be a respiratory irritant is phenol, 2-(1,1-dimethylethyl)-4-methyl-, which stands out in Tyre 8.
Interestingly, a particular compound, 1,4-benzenediamine, N-(1,3-dimethylbutyl)-N'-phenyl, was present in relatively high concentrations in Tyre 4 and present in all the others except Tyre 5, from which it was absent. This compound is better known at 6PPD. A study published in 2020 in Science6 linked 6PPD-quinone to the widespread deaths of coho salmon in California. 6PPD-quinone is produced by 6PPD reacting with ozone in the air.
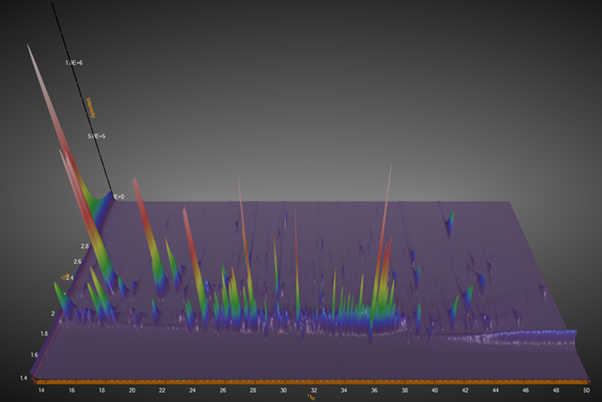
The fourth question originally posed was what tyre wear particles released may be leeching into the environment over time. While a microchamber or liquid extraction method may be more appropriate, we can nevertheless get some idea of what could be occurring from the pyrolysis results. The two-dimensional chromatogram below gives a visual idea of the large number or organic compounds in a tyre, with each peak representing one compound.

These compounds can be put into generic groups to assist understanding. In this case, we used two broad categories: aliphatics and aromatics. The aliphatics contain ‘saturated’ (lots of hydrogen atoms compared to carbon) alkanes, alkenes, alkynes, carbonyls and acids. The aromatics are mainly cyclic, based on benzene rings.
The table below shows the relative prevalence of compounds in these two groups. As a broad statement, the alkane group contains many compounds that are often irritants to human organs, whereas the aromatics group includes many suspected carcinogens. Therefore, at a simple level, the lower the proportion of aromatics the lower the human toxicity is likely to be. To be more precise, the individual compounds contained in each group can be identified using this method, which may identify compounds toxic even at very low concentrations.

Overall, this initial data suggests there is good cause for significantly accelerated research on tyre wear emissions. The rate of particle loss into the environment is orders of magnitude higher than from the tailpipe. Knowledge of where the particles end up is currently limited. As tyre manufacturers are naturally commercially coy about the chemical make-up of their tyres, it has been historically hard to assess whether the particles present a material problem of human and wildlife toxicity, as they sit and leech into the water and soil. The method described above is one approach that is emerging that could help accelerate the understanding so badly needed.
References
1. Portals.iucn.org/library/node/46622
2. cyclohexene‚ 1-methyl-4-(1-methylethenyl)- ‚ (S)-
3. 9‚12‚15-Octadecatrien-1-ol‚ (Z‚Z‚Z)-
4. cis-5‚8‚11‚14‚17-Eicosapentaenoic acid
5. 2‚4-Hexadien-1-ol
6. Science.org/doi/10.1126/science.abd6951

The inevitability of hybridisation?
While the direction of vehicle powertrain policy and strategy is firmly oriented towards full battery electric vehicles (BEVs), the results of Emissions Analytics’ latest testing and lifecycle modelling suggests that hybridisation may prove to be the dominant outcome, whether intended or not.
While the direction of vehicle powertrain policy and strategy is firmly oriented towards full battery electric vehicles (BEVs), the results of Emissions Analytics’ latest testing and lifecycle modelling suggests that hybridisation may prove to be the dominant outcome, whether intended or not. As real-world emissions results collide with consumer preference and fiscal reality, the efficiency of hybrids in reducing carbon dioxide (CO2) emissions is likely to shine through over the next decade, even if BEVs and other new technologies come to dominate in the longer-term.
Put another way, at the moment it appears that battery electric vehicles (BEVs) are neither sufficiently clean nor a strong enough consumer proposition to achieve mass adoption without significant subsidy. They are certainly not zero emission, not least due to the construction process and tyre wear emissions. Hybrids, in contrast, reduce tailpipe CO2 emissions materially now – albeit somewhat less than BEVs – and have few utility disadvantages for consumers. Therefore, would it be optimal to follow a hybridisation strategy for, say, the next ten years and then segue to BEVs after that, once they are cleaner and have fewer consumer disadvantages?

The typical objection to this is that BEVs already in the fleet will automatically become cleaner as the grid decarbonises. While this is true, the greatest source of CO2 from BEVs is in the manufacture, which is fixed and incurred upfront. Therefore, every BEV manufactured now may crystallise enough CO2 today to outweigh the subsequently lower CO2 of operation, compared to typical hybrid vehicles.
Taking the latest sales figures for new cars from the UK’s Society of Motor Manufacturers and Traders (SMMT), and putting them together with recent test results for exhaust and non-exhaust emissions from Emissions Analytics, it possible to evaluate the progress in decarbonisation.
Before turning to CO2, it can immediately be seen that BEVs deliver little overall advantage for air quality. While NOx emissions remain positive for internal combustion engines (ICEs), the levels are significantly lower than for earlier models. This is true to the extent that, if the car fleet were made up entirely of these latest diesel and gasoline cars, there would be no air quality legal violations. For particle mass emissions, exhaust filters on ICEs typically reduce emissions to less than 1 mg/km. In contrast, tyre emissions from ICEs are around 32 mg/km over a lifetime, whereas the BEV tyre wear rate – other things being equal – are 21% higher at 38 mg/km. Adding exhaust and non-exhaust emissions together, BEVs are slightly higher emitting than ICEs and full hybrid electric vehicles (FHEVs).
With BEVs not required for air quality compliance, their primary environmental purpose is CO2 reduction. The table below estimates the CO2 emissions saved compared to the benchmark gasoline ICE for each alternative powertrain, based on 16,000 km of annual driving and the latest market shares of each. The greatest aggregate CO2 reduction is from BEVs, which have 8.4% market share. Hybrids, collectively, with 34.0% market share, account for around three-quarters of the reduction of BEVs.

These BEVs include around 5.5 million kWh of battery capacity, compared to 1.0 million kWh in all the hybrids together. Therefore, for every kWh of battery capacity, BEVs delivered 3.0 g/km of CO2 reduction, compared to 13.7 g/km for hybrids, both judged against the gasoline ICE benchmark. In other words, hybrids have been 4.6 times more efficient at reducing CO2 as a function of the currently constrained battery material supply.
Had the battery material from the 92,420 BEVs sold been used in hybrids – assuming average battery capacities of 60 kWh and 2.6 kWh respectively – an additional 2.1 million hybrids could have been built, enough to cover all new cars sold in the whole of 2021 in the UK. In that hypothetical scenario, the CO2 reduction from the annual operation of the hybrid vehicles would be 940 kilotonnes greater than from the BEVs.
To analyse more fundamentally the differences between the powertrains, it is necessary to consider lifecycle CO2 emissions, including vehicle manufacture, operation and end-of-life processing. To that end, Emissions Analytics has developed its own proprietary model; for the purposes of this analysis the key assumptions are:
15-year, 175 km vehicle lifespan
60 kWh BEV battery size
150 kg/kWh of CO2 in battery production
300 g/kWh of CO2 for BEV charging.
Considering the cumulative CO2 emissions to 2070, it is possible to compare six different scenarios as shown in the table below. The three powertrain scenarios are an ICE-led baseline, a direct migration to BEVs, and an interim switch to FHEVs until 2030 and then migration to BEVs. Each of these scenarios has two versions: one calculated based on current CO2 intensity of electricity generation and BEV manufacture, the other with that intensity reducing by 50% from 2030.

The reason for BEVs being hardly better than FHEVs on current CO2 intensity is that the manufacture emissions of the vehicle and battery are still relatively high, and the average grid electricity across Europe still includes significant gas and coal.
Therefore, we can deliver an extra 8% point reduction in CO2 compared to the baseline by switching straight to BEVs, if a 50% reduction in CO2 intensity is achieved from 2030. According to the fifth carbon budget under the UK’s Climate Change Act, the country can emit 1,725 million tonnes of CO2-equivalent between 2028 and 2032. The added benefit given by the direct migration to BEVs is over 10% of that carbon budget – which demonstrates how every percentage point of reduction in CO2 is important.
On the surface of this analysis, BEVs look like the optimal strategy, even though the gap to the FHEV strategy is closer than reported elsewhere. However, this neglects consideration of risk. Rolling out hybrids would be relatively low risk due to limited resource requirements, consumer resistance and taxpayer subsidy requirement. Furthermore, the BEV estimates of CO2 reduction are sensitive to many factors, including:
Speed and degree of decarbonisation of battery and vehicle manufacture
Speed and degree of decarbonisation of the grid
Improvements in battery energy capacity and therefore vehicle range
Longevity of batteries and BEVs as a whole
Geopolitical security around scarce battery materials
Environmental and ethical issues around mining
Degree to which vehicle miles travelled in BEVs replace ICE miles, or are additive due to the lower marginal cost
Ability to develop a transparent and standardised lifecycle model to be able objectively to verify CO2 reduction claims.
Each of these could have a material impact on the analysis and resulting CO2 reduction, both positively and negatively. However, as high-certainty methods of CO2 reduction are a pressing policy need, it may be better to ‘bank’ the lower-risk 24% reduction from ten years of hybrids, and then migrate to BEVs and other lower-CO2 powertrains.
Returning to the topic of currently scarce battery materials, the FHEV strategy requires 39 GWh of battery capacity for vehicles sold in the ten years to 2030. In contrast, the BEV strategy requires 570 GWh, or 15 times more. From a practical, ethical and geopolitical point of view, this is significant.
There is, further, a paradox with BEVs: once bought, from a CO2 point of view it makes sense to drive them a lot so the embedded emissions in the construction can be amortised across the maximum usage. It may even be better to drive incremental miles in the car rather on some forms of public transport. This is, therefore, linked to the question of taxing BEVs such there are no perverse incentives to drive on the road more, and creating replacement revenues for the declining taxes on gasoline and diesel.
Putting together this rate of CO2 reduction and the current utility compromises, it suggests that BEVs are not yet good enough value a product to get rapid adoption without significant subsidy. With new internal combustion engines now sufficiently clean that they are not contributing to air quality violations and the readily available alternative in hybrids, it appears that the optimal policy is to concentrate on them for the coming years while BEVs and other low-CO2 powertrains get ready for mass adoption. Greater competition would be good for consumers in the long term, especially where greater proportions of the added value in the vehicles arise domestically, whatever the country. Vast sums of taxpayer subsidy – billions, if not tens over billions, of pounds over time – could also be avoided.

Failing this, it is likely that we end up at hybridisation by another route: at the household level. This is because consumers may hold on to old ICEs to cover longer journeys, heavier payloads, sporty driving and the like. These older vehicles may also have higher NOx emissions, being Euro 6 prior to the introduction of Real Driving Emissions, or earlier. Governments may try to force these off the road through higher taxation, but this is unlikely to work as the low depreciation rates of these older vehicles will make for cheap motoring in almost any scenario.
In summary, surely it would be better to take the pragmatic route and hybridise everything as soon as possible?
This conclusion is not dissimilar from that articulated in a facsheet from the International Council on Clean Transportation in July 2021, which said, "Hybridization can be utilized to reduce the fuel consumption of new internal combustion engine vehicles registered over the next decade, but neither HEVs nor PHEVs provide the magnitude of reduction in GHG emissions needed in the long term."
But, the numbers suggest we replace "can" with "should", to lock in the CO2 savings now.
The rise of unregulated exhaust pollutants
When the various pandemic lockdowns across Europe failed to bring about the overall improvements in air quality that might have been expected, Emissions Analytics’ interest focused in on volatile organic compounds (VOCs) and their potential role.
But which ones really matter on the road?
When the various pandemic lockdowns across Europe failed to bring about the overall improvements in air quality that might have been expected, Emissions Analytics’ interest focused in on volatile organic compounds (VOCs) and their potential role. While nitrogen oxide (NOx) emissions fell with traffic levels, often ground-level ozone (O³) rose, leading to similarly bad air quality from a human health point of view, just of a slightly different complexion. In fact, this should not have been a surprise as the complex interaction of NOx, VOCs and O³ has long been studied¹. The South Bay in Los Angeles has grappled with this problem since motor vehicles proliferated, and many US air quality regulations have stemmed from the experiences there.

Recent newsletters from Emissions Analytics have, therefore, looked at sources of VOCs including vehicle tyres (What's in a tyre?) and materials (Euro 8: Rethinking Vehicle Emissions Fundamentally). This newsletter returns to the tailpipe to see what VOCs and other currently unregulated pollutants are being emitted in real-world, on-road driving. This is aimed at taking understanding beyond the ‘total hydrocarbons’ that are regulated using a laboratory test in Europe, and non-methane hydrocarbons that are regulated in a number of territories including the US. This research is being conducted against the backdrop of the current discussions around the proposed new ‘Euro 7’ regulation, which may include some hitherto ignored pollutants including particular species of VOCs.
Measuring a wide range of organic compounds and other volatile species at the tailpipe is a challenge due to the large number of different compounds – many hundreds, if not thousands – as well as their volatility, which can make them hard to capture. While this can be done in the laboratory, it is an even greater challenge on the road. Traditional portable emissions measurement systems (PEMS) measure total hydrocarbons (THC) using a flame ionisation detector (FID). This can deliver robust measurements, but it creates some operational challenges, not least from the need for a supply of combustion gas. Furthermore, only a single figure for total hydrocarbons is produced; it does not include non-hydrocarbon VOCs and does not separate the different species of hydrocarbons.

To address these challenges and limitations, Emissions Analytics has developed a proprietary, patent-pending system, that harnesses sample collection from the exhaust onto tubes while driving, which are then analysed later using laboratory gas chromatography. Using this, we can measure the concentrations of VOCs as well as semi-volatile organic compounds (SVOCs) – together covering compounds from with two carbon atoms (C2) up to at least 44 carbon atoms (C44) – formaldehyde (CH2O), nitrous oxide (N₂O), sulphur dioxide (SO2) and many others. Therefore, both the breadth of compounds measured and the speciation challenges are solved. Furthermore, the measurements can be highly sensitive, picking up very low concentrations, which may be critical for highly toxic species. The chromatogram below illustrates the large number of distinct compounds that are present in a typical exhaust, with the height of the peaks generally indicating relative amounts.
When deployed together with a traditional PEMS unit, with its capability for measuring total exhaust flow, the concentrations of VOCs can be turned into mass values. Combined with the GPS speed data, the distance-specific emission rates can be calculated, giving mg/km figures as is the basis for regulating most gaseous emissions.
The limitation of this approach is that the sample collection on tubes is cumulative over the test cycle and, therefore, there is no second-by-second signal. This creates two problems. First, when the average concentrations are multiplied by the total exhaust flow, the result is biased due to the highly variable nature of both the target gas concentration and exhaust flow at the instantaneous level. Second, the result is a combined value for the whole test cycle, without any breakdown between different driving modes.
Our approach addresses both limitations. The sample bias issue is overcome using a proprietary on-board constant volume sampling and proportional flow dilution system. To give a breakdown of the combined cycle into useful sub-sections, a geofencing system automatically switches between different sample tubes to sample, for example, urban, rural and motorway driving separately.

A notable advantage of the sample tube approach, from a practical and analytical point of view, is that it separates sample collection from sample analysis. This reduces the complexity of the vehicle test itself, which improves the success rate. Having the sample captured on a tube means that it can be analysed later, in batches for efficiency, and each sample can be analysed multiple times, which is useful for validation and uncertainty analysis. For the purposes of our tests, we use a two-dimensional gas chromatography (GCxGC) system coupled with a time-of-flight mass spectrometer (TOF-MS) from SepSolve Analytical and Markes International. The GCxGC achieves a separation of the hundreds of compounds that would not be possible in a one-dimensional system. The TOF-MS is crucial for identification of the compounds, as well as quantification, which is aided by other detectors such as a FID and electron capture detector (ECD) for N₂O.
Putting these techniques into practice, Emissions Analytics tested eight recent gasoline vehicles in Europe. All were 2020 or 2021 model years, with four standard internal combustion engines, two mild hybrids, one full hybrid and one plug-in hybrid – drawn from eight different brands. All were tested on the standard EQUA Index test cycle set out in previous newsletters and the basis of all data in the Emissions Analytics’ subscription database. While similar to a certification Real Driving Emissions (RDE) test, it has a wider range of dynamic driving and is about twice as long.
The N₂O results are set out in the table below, split between urban, rural and motorway driving. In each case the highest and lowest emitting cars are highlighted. Greatest emissions were seen in rural driving, with urban driving the lowest.

Emissions of N₂O are potentially important as the gas is a much more powerful greenhouse gas than carbon dioxide (CO2). Over a 100-year horizon, it has warming potential 265 times greater2. Therefore, small amounts of N₂O could undermine the extensive efforts to reduce primary CO2 from engines. On average, across the eight vehicles and three driving modes, the N₂O emissions were 2.1 mg/km. Converted to an equivalent CO2 this is just above half a gram. Real-world CO2 emissions of these test vehicles averaged 142 g/km. Therefore, these N₂O emissions were equivalent to well below 1% of total CO2 – within the measurement error of the CO2 value.
Formaldehyde is a pollutant of concern as it is believed to be carcinogenic and causes a wide range of irritation in humans, including to skin, eyes and lungs. The results from the same eight vehicles are shown below.

Again, highest emissions were seen in rural driving. Although the exact human health effects depend on factors such as the dilution and dispersion of the emissions, it can be seen from the data that there is about a factor of four difference between the cleanest and dirtiest cars.
Turning to other VOCs and SVOCs, the tubes captured over 500 different compounds from each vehicle. Some of these were common to most or all, but other compounds were characteristic of specific vehicles. Taken together, each vehicle has its own chemical signature. The table below shows the top compounds that were common to each vehicle, together with their toxic effects. It should be noted that the actual effects on humans depend on the concentrations experienced.

By way of contrast, the differentiating compounds are shown below. The compound listed is the most abundant chemical with particular prevalence in that vehicle.

On this first pass, therefore, there is good reason to move beyond the simple measure of total hydrocarbons and non-methane hydrocarbons in various regulations around the world. The next stages are to consider the absolute quantities of the compounds, model their dispersion in the environment, understand their toxic effects, and study their propensity to create secondary organic aerosols, i.e. solid airborne particles created as the SVOCs react in the atmosphere.
These initial results demonstrate the capability to identify and measure a wide range of VOCs and SVOCs in real-world driving – compounds that can have a wide range of deleterious effects on human health and the environment. The N₂O results may call into question the priority of adding this pollutant to the new Euro 7 regulation as the effects on global warming may be insignificant and come at the price of higher priced cars with the added regulatory burden. Better to focus on the ongoing effects of VOCs, whether the direct effect on humans and the biosphere, as precursor to ozone and smog, or as they lead to formation of airborne particles matter – which we will look at in a later newsletter.
Video: Euro 7 and beyond
Our CEO & Founder, Nick Molden conducted a webinar on Euro 7 and beyond. Watch the replay here.
Our CEO & Founder, Nick Molden conducted a webinar on Euro 7 and beyond.
In this presentation, Nick discusses:
Trends in air quality
Policy context of Euro 7 and US regulation
Principles of the EQUA Index test method
New pollutants being measured: N2O, formaldehyde and speciated VOCs and SVOCs
How real-world data collection is conducted
Initial test results
How EQUA Index database can be used for performance benchmarking.

What’s in a tyre?
This matters because tyres shed a lot of material into the environment.
What’s in a tyre?
Thousands of chemicals derived from crude oil, many of them volatile organic compounds, apparently.
This matters because tyres shed a lot of material into the environment. Emissions Analytics’ estimates suggest that around 300,000 tonnes of ‘rubber’ are released every year from passenger cars in Europe and US alone, the equivalent of over forty million brand new, entire tyres. These particles go into the air, soil and watercourses. If you were to stack all the tyres manufactured in the world in a year on their side, it would reach the moon.

While there is a tyre labelling scheme in the EU, it only rates rolling resistance, wet grip and noise. These are clearly vital to the performance and safety of tyres, but it leaves the ratings blind to the environmental consequences of the tyre wear emissions. There are restrictions on toxic chemicals that can be included in the manufacture of tyres under the European REACH regulations, but the number of chemicals affected is limited.
While we have been occupied with reducing exhaust emissions to control air quality problems, other sources of pollutants have not received the same attention historically. Now that tailpipe emissions of modern internal combustion engines (ICEs) in both Europe and US are generally well below regulated limits for pollutants, focus is now turning to ‘non-exhaust emissions’, which cover tyres. Emissions Analytics’ testing shows that, in normal driving, tyre wear emissions are about one hundred times greater than tailpipe particle mass on a modern ICE vehicle. In legal but extreme driving, enough to reduce significantly the lifespan of a vehicle’s tyres, that factor increases to around one thousand.
In addition to tyres, non-exhaust emissions cover material from brake and road wear, as well as resuspended solids, whipped up from the carriageway by the moving vehicle. Of these, tyre wear emissions are probably the largest and fastest-growing component. Brake wear emissions are forecast to fall as regenerative braking becomes more widespread. Road wear and resuspension rates are only partly related to the passing vehicle, including its weight, but are probably more determined by the road material and condition, and what particles are blown onto the road from multiple surrounding sources. Tyre wear emissions are likely to grow as vehicles continue the long-term trend of becoming heavier, although this may at some point be offset by using more lightweight construction materials.
Understanding tyre wear emissions provides a challenge as they are heterogenous. Unlike, for example, nitrogen oxide (NOx), which is a unique compound that can be measured as a mass or volume, particles from tyres come in an infinite combination of shapes, sizes and densities. Moreover, the particles are made up of a wide array of chemical compounds, and these chemicals may also stick – or adsorb – to the surface of the particle. In this way, particles can act as the distribution vector for other compounds.
An emerging approach to characterising tyre wear emissions is, therefore, to measure both the wear rates and chemical make-up of the particles. This enables a quantification of the amount of individual chemicals that are released into the environment. This information can then be put together with toxicity ratings to assess the potential effect on human health, wildlife and biodiversity. For the semi-volatile organic compounds particularly, the effect of these on secondary organic aerosol formation – in other words, gaseous emissions that condense to become airborne particles over time – can be evaluated.
To begin to understand the degree and nature of the tyre wear emissions problem, Emissions Analytics recently tested a range of different tyres. Full sets of tyres of eight different brands and types were selected and installed on the same test vehicle, a 2012 rear-wheel drive Mercedes C-Class. The wheel alignment and tyre pressures were checked. Each set of tyres was driven for over 1,000 miles, around 90% by distance being conducted on the motorway. The four wheels – i.e. leaving the tyres on the rims to avoid damage – were weighed at the start and end, and the distance-specific loss of mass was calculated. The results are shown in the chart below.

Across the brands, the average mass loss was 64mg/km for the vehicle, adding all four tyres together. Wear on the rear tyres was greater, accounting for 71% of the total on average, strongly influenced by this being a rear-wheel drive car. The wear rate on the fastest abrading tyre was 2.3 times higher than the slowest. Therefore, tyre choice by manufacturers and consumers can have a material impact on emissions rates.
The wear rate is faster when tyres are new, for the first few thousand miles. Thereafter, the wear rate appears to decline at an approximately logarithmic rate. Over a lifetime, therefore, the average wear rate may be half the figures above. If we assume that the average vehicle travels around 16,000km per year, the rates above mean that each car sheds around 0.5kg per year on average over its lifetime. As there are almost 600 million vehicles in Europe and the US, this is equivalent to 300,000 tonnes of particles. An average tyre weights around 8kg, hence the total amount shed is equivalent to almost 40 million whole tyres. These figures do not include tyre wear from heavy-duty vehicles, which would also be significant.
The effect of particles on human health and the wider environment is an on-going and active area of research. It is complex to isolate the causal links. In terms of air pollution, it is generally accepted that there is a connection between particle mass emissions and diseases such as cancer and heart disease from prolonged exposure. The effects in terms of particle number are less clear-cut, although the EU regulates these at the tailpipe from a precautionary motive. The aim of this newsletter is not to review the evidence, but rather to contribute early findings on the chemical composition of tyres studied so far by Emissions Analytics.
Tyres are highly-engineered products and made up of a complex mixture of substances. For light-duty vehicles, the majority of the content of the tyre tread and walls comes from crude oil derivatives, with only a minority of natural rubber. Therefore, to understand the composition of tyres, it is necessary to employ a technique that can separate these out. We decided to focus on the organic compounds rather than metals, and employed our two-dimensional gas chromatography equipment coupled with a time-of-flight mass spectrometer (GCxGC-TOF-MS from SepSolve Analytical and Markes International, see https://www.emissionsanalytics.com/tyre-emissions). The gas chromatograph achieves separation by passing a sample through a long ‘column’, and the mass spectrometer does the compound identification. Two dimensions, both of time, are required to separate compounds that ‘elute’ in the same place in a one-dimensional chromatogram. Taking an example tyre, we heated samples to 100˚C and analysed the compounds released to obtain the following two-dimensional chromatogram.

Broadly, compounds cluster in different areas depending on common chemical characteristics. Some frequently used groups are illustrated above. Alkanes (e.g. pentane) typically affect the lungs, liver, kidney and brain. Cycloalkanes (e.g. cyclohexane) lead to headaches and dizziness. Terpenes (e.g. limonene) are generally less problematic and are responsible for aromas, unlike aromatics (e.g. benzo(a)pyrene), which are often carcinogens, as are nitrogen-containing compounds (e.g. quinoline). This is a significant simplification for the purposes of illustration.
Each shaded area on the chromatogram indicates a distinct chemical, with the intensity of the colour reflecting its abundance. The measurement breadth of the equipment is from compounds containing two carbon atoms (C₂) to at least C44. This covers what are called volatile organic compounds (VOCs) and semi-volatile organic compounds (SVOCs). Just this one sample contains well over a thousand distinct compounds of these types.
The next stage is to identify as many of the compounds as possible and understand if they are problematic for health or the environment. Zooming in on the nitrogen-containing part of the chromatogram, it is possible to identify a number of potentially problematic compounds, as shown below.

N-Phenyl pyrrole, quinazoline, 4-tert-butyl-2-chlorophenol at certain levels of exposure can lead to symptoms in humans including skin, eye and respiratory irritation. In addition to these effects, quinoline and 3-methyl-quinoline have potential carcinogenicity and mutagenicity in humans. Quinoline and 1,2-dihydro-2,2,4-trimethyl affect aquatic environments more than humans.
This suggests that potentially concerning compounds are present in tyres, but if we compare the composition of different tyre brands it is also possible to see that the mix of chemicals differs. This reflects the many formulations used by different producers, but also means that tyre selection can lead to different environmental and health effects. The chart below illustrates the point by comparing four different tyre types. Each sample was pyrolysed to release as many compounds in the underlying materials as possible, and then analysed using Principal Component Analysis.

Tyre Brand B is strongly differentiated from the other three tyres by the presence of 1-methyl-2-pentyl-cyclohexane – a cycloalkane. Although it does not have any particular toxic indications for humans, it is potentially possible to relate the presence of this defining compound to other characteristics such as rolling resistance, noise or wet grip.
Where toxic compounds are identified by this approach, it does not guarantee that they are present in amounts that could cause harm. Therefore, the final stage is to quantify each in the sample, so the total amount in a tyre can be worked out. However, even if the amounts are small in one tyre, due to the large amount of material released each year in total – as calculated above – even low concentrations could lead to deleterious effects at the macro level.
All in all, this initial testing has demonstrated that it is possible to measure tyre wear explicitly, without it being combined with brake or road wear, and the separation capability of the two-dimensional gas chromatograph can help identify thousands of constituent compounds. The results themselves then show that there are relevant and material differences in the wear rates and chemical make-up of different brands and models of tyre. Therefore, choices of tyre when the car is first sold and at subsequent tyre changes are directly relevant to the vehicle’s environmental impact, and requires deeper and urgent study.

Euro 8: Rethinking Vehicle Emissions Fundamentally
Just as European regulators are consumed by finalising the touted 'Euro 7' regulation, it is perhaps the right time to consider the longer-term trajectory for vehicle regulation. There is a tension in the narrative around Euro 7.
Just as European regulators are consumed by finalising the touted 'Euro 7' regulation, it is perhaps the right time to consider the longer-term trajectory for vehicle regulation. There is a tension in the narrative around Euro 7. At points it has been talked about as the “final” set of emissions regulations, but now the message is being put out that the intention is not to “kill” the internal combustion engine (ICE). Unless foreshadowing the end of the ICE, it would be bold and presumptuous to call Euro 7 the final regulation.
In reality, Euro 7 is unlikely to be the final regulation, not because of the end of ICEs, but because vehicles of all types, including battery electric vehicles (BEVs) emit lots of substances from sources other than the exhaust. This newsletter set out those additional sources, and what shape a subsequent Euro 8 regulation might conceptually take. This is consistent with Emissions Analytics’ mission to establish the true, real-world environmental impact of vehicles. BEVs, it should be kept in mind, exist only for their greenhouse gas reduction potential, not for meeting air quality laws, as the regulated pollutant emissions out of the current generation of ICEs are low.

Why are BEVs not required to meet air quality laws in Europe? Since the introduction of the Real Driving Emissions (RDE) on-road validation of certification values introduced mid-way through Euro 6,gaseous tailpipe pollutant levels are now confirmed as low in average driving. For some, they were low even before RDE. The average nitrogen oxide (NOx) emissions from RDE diesel vehicles are 45mg/km and falling, compared to the regulatory limit of 80mg/km. Mean carbon monoxide from RDE gasoline vehicles is 157mg/km compared to the limit of 500mg/km. Total hydrocarbons (THC) from RDE gasoline vehicles are now typically below 10mg/km compared to the limit of 100mg/km. Particle mass emissions are now very close to zero on current diesel and direct injection gasoline vehicles, with a limit of 4.5mg/km on the PMP procedure.
Of the regulated pollutants, therefore, all seem well controlled, except for ultrafine particle emissions – measured through the particle number (PN) standard – and potentially particles more generally from port fuel injection gasoline cars. The widening of the size range of particles measured, down to 10nm, likely to be proposed in Euro 7, will offer a valuable tightening of this part of the regulatory regime.
For the Euro regulations themselves, greenhouse gases are not regulated – except indirectly for methane (CH4) through THC – as the fleet average carbon dioxide (CO²) targets act separately. Whether promoting BEVs is the optimal way to achieve these targets was the subject of a previous newsletter: www.emissionsanalytics.com/news/hybrids-are-better. Relevant here is the potential addition of methane and nitrous oxide (N2O) under Euro 7, even though they are primarily greenhouse gases rather than air quality pollutants. They are both more potent greenhouse gases than CO², although survive for a shorter time in the atmosphere: 28 and 265 times higher potency respectively on a hundred-year time horizon1. Therefore, only small amounts of N2O emissions could nullify much of the hard-won CO² reduction.
So, on the surface of it, Euro 7 could be the last regulation for pollutant emissions, while greenhouse gases are actively addressed through the CO² targets. What may be neglected, however, is volatile organic compounds (VOCs) from the exhaust. These compounds are numerous, small in volume but potentially highly toxic in their human health effects. Therefore, their current regulation in the laboratory as non-methane hydrocarbons (NMHC) may be insufficient: not only that the limit is high at 68mg/km, but also that it does not apply to diesel vehicles. Furthermore, by only considering the total, there is no visibility on whether that total is made up of toxic or innocuous compounds.
The University of York in the UK has been at the forefront of studying this area, highlighting particularly the role of these compounds in the atmospheric chemistry that leads to ground-level ozone and secondary organic aerosol particle formation². Therefore, these compounds do not just have direct effects on human health, but indirectly lead to poor air quality. While oxidation catalysts in the exhaust of gasoline vehicles may be highly effective in converting VOCs, their effectiveness against the heavier, semi-volatile organic compounds (SVOCs) such as the carcinogenic polycyclic aromatic hydrocarbons (PAHs) is less clear. Generally, also, these ICE vehicles suffer from relatively high VOC and SVOC emissions when the engine is cold.
From this, we can conclude that Euro 7 perhaps should not be the final regulatory stage, so long as ICEs are still sold, which is likely to be through to at least 2035 in Europe. While Euro 7 is looking at regulating a small number of highly volatile compounds such as formaldehyde, the broader spectrum of organic compounds is not currently being actively considered. This is important when you put it in the broader picture of the environmental impact of vehicles. Specifically, there are instructive parallels with the emissions from tyres and from materials inside the vehicle cabin – both of which are very lightly regulated currently. Tyres will be a topic of a later newsletter, so here we will focus on the vehicle interior.
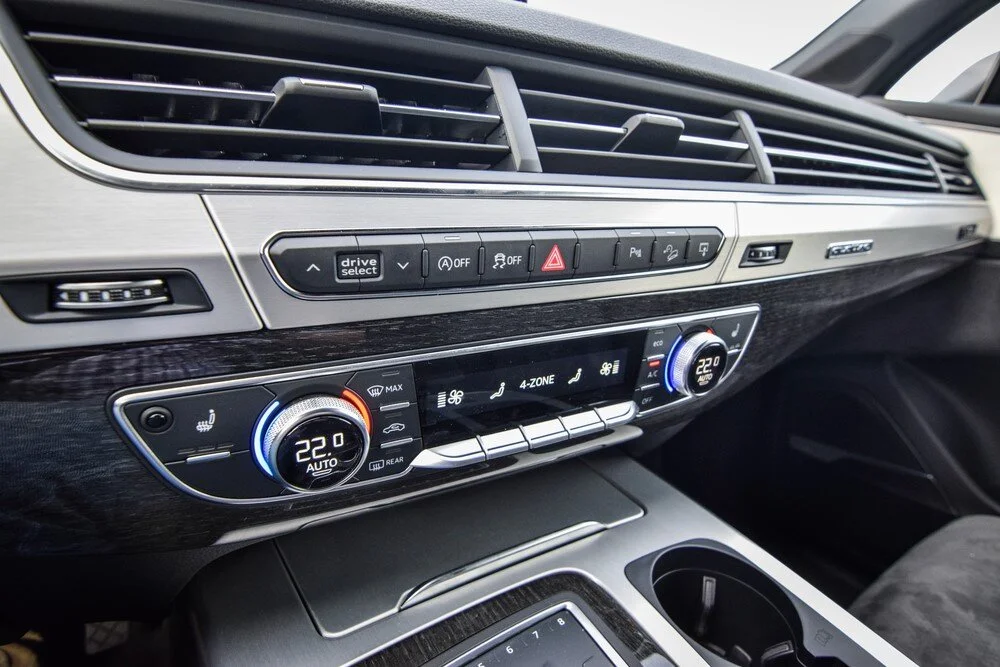
In our last newsletter (From performance to experience), we reviewed the evidence for concentrations of particles and CO² in the cabin during on-road driving. It concluded that the quality of air inside the cabin is highly dependent on the quality of the ventilation system and its filter. For some vehicles, in-cabin particle concentrations were many times higher than outside on average, and the use of the recirculation mode led to steep rises in CO² concentrations to the point of potentially having cognitive effects on the driver.
But that is not everything. The single biggest complaint from new car buyers in China is about the ‘new car smell’, which is caused by a mix of VOCs. These VOCs may have health effects that go well beyond simply causing malodours. The source of the new car smell is VOCs being released from interior materials and glues used to put the vehicle together. Sources of VOCs go beyond that too, including those that enter the cabin from outside (which in turn come from other vehicles, home heating, industrial sources and so on), fuel evaporating from the tank and emissions from the body and clothing of human occupants. What is important is to be able to differentiate the toxic from the harmless VOCs – the toxic ones being more likely to come from combustion of fossil fuels or materials derived from fossil fuels, such as plastics and adhesives.
To study this, Emissions Analytics has recently opened a testing laboratory with two-dimensional gas chromatography and time-of-flight mass spectrometry from Markes International and Sepsolve. This allows us to test for tailpipe and in-cabin VOCs with excellent separation, identification and quantification. Taking one of the early car tests, a sample of air was taken and 617 different compounds were identified, with 25 being particularly being abundant. These compounds can be illustrated on a two-dimensional chromatogram, as shown below. The horizontal dimensions are the two axes of separation and each peak represents one compound, with the area under the peak broadly reflecting the amount present.

Looking in more detail at the most abundant compounds, it is possible to relate each to the risks to human health, as shown in the table below, with a colour classification reflecting the toxicity.

In addition to these, formaldehyde was identified through a separate process using high-performance liquid chromatography. Formaldehyde is another respiratory irritant and a contributory factor in asthma and some cancers.
The vehicle was a recent model year mid-range European gasoline passenger car. These effects are a combination of irritants that would lead to various degrees of discomfort while in the vehicle. A longer time spent in the car would correlate with a greater health or comfort effect. The 617 compounds identified can be put into the following generic groups, corresponding to the coloured areas on the chromatogram for ease of interpretation (with the axes being the two dimensions of separation and the colour corresponding to the intensity of the peak). These groupings give an area percentage which can be used for the characterisation of compounds. This is a simple interpretation, while more detailed analysis can quantify the amount of each compound.

Therefore, this vehicle contained a large number of compounds that are respiratory irritants and cause organ damage, together with a material number of carcinogens.
China is planning to regulate eight targeted compounds in the vehicle interior, although the timetable for implementation has slipped. Emissions Analytics identified six of the eight target compounds in its test, particularly formaldehyde and toluene. Moderate concentrations of benzene and ethylbenzene were present, with lower amounts of acetaldehyde and styrene. Japan, Korea and Russia also regulate similarly limited repertoires of these VOCs.
The main control in Europe for these VOCs is through the ‘REACH’³ restrictions on substances that can be use in product manufacturing. Currently only eight PAH compounds are restricted – according to their concentration in the final product – primarily as carcinogens: benzo(a)pyrene, benzo(e)pyrene, benzo(a)anthracene, chrysene, benzo(b)fluoranthene, benzo(j)fluoranthene, benzo(k)fluoranthene and dibenzo(a,h)anthracene. These restrictions apply to products including tyres and plastic components than come in contact with the human skin, including some parts of the vehicle interior.

The most progressive approach to measuring vehicle interior VOCs, focusing on materials, is the Vehicle Interior Air Quality group at the UNECE. In 2020, it finalised a revision to Mutual Resolution 3 that standardises measurement of these compounds and offers a platform for future regulation by national governments. Substances tested under this protocol are VOCs ranging in volatility from n-C⁶ to n-C¹⁶ together with carbonyl compounds formaldehyde, acetaldehyde and acrolein.
In summary, both the tailpipe and vehicle cabin are likely to contain a wide range of volatile and semi-volatile organic compounds, some of which can have high toxic effects on humans, as well as other effects on animals, aquatic life and biodiversity. This is an important and urgent topic for future study, especially at a time when the levels of traditionally regulated tailpipe pollutants are getting so low. In short, the focus should be on particles, VOCs and greenhouse gases, whether they come from the tailpipe, cabin materials or tyres

Unless this wider view of vehicle emissions is taken, and the structure of the Euro regulations fundamentally reframed, they could hold as much currency as a 7 Euro coin.
Footnotes:
- https://www.ghgprotocol.org/sites/default/files/ghgp/Global-Warming-Potential-Values%20%28Feb%2016%202016%29_1.pdfof-air-pollutants/emissions-of-air-pollutants-in-the-uk-particulate-matter-pm10-and-pm25,
PM2.5
- http://www.envchemgroup.com/jacqui-hamilton.html
- https://echa.europa.eu/regulations/reach/legislation
From performance to experience
Could vehicle interior air quality become the differentiator of the future?
Cars used to be about speed, power, performance and freedom. Different models often used to offer dramatically different performance and looks.
Could vehicle interior air quality become the differentiator of the future?
Cars used to be about speed, power, performance and freedom. Different models often used to offer dramatically different performance and looks. But, not so any more. We are currently in an era of the generic sports utility vehicle (SUV) and identikit low emission vehicles. Electric vehicles “all look alike”, as suggested by the head of BMW recently¹.
But can this last? Will consumers want to buy such seemingly bland offerings, and can manufacturers profit from the undifferentiated? Perhaps we are already beginning to see early signs of a shift. Electrification may turn out to be less about emissions reduction, but rather emblematic of the change in the fundamental proposition of the car away from performance and towards experience. Performance is increasingly constrained through traffic and emissions policy, so consumers may want to make the increasingly dull experience of driving at least more comfortable.
Historically, operating a car delivered ample private benefit and enjoyment, at the expense of an alarming array of environment and health impacts: climate effects through carbon dioxide (CO²) emissions; air quality from tailpipe nitrogen oxides (NOx), particulates and carbon monoxide (CO); air and marine pollution from tyre and brake wear; ozone formation from evaporation of volatile organic compounds (VOCs) from fuel in the tank and construction materials; and noise and many others.
Battery electric vehicles (BEVs) are perceived to be the antidote to this: quiet and pollution free. This is of course not quite true: BEVs create CO² emissions in their manufacture, some noise and perhaps higher tyre wear emissions. Nevertheless, we could get to the point where the environment affects the BEV driver more than the BEV affects the environment.
How could this be true? Road transport collectively is only a minority contributor to air quality problems in 2019 – perhaps only 12% of particles² and 33% for NOx³. The majority of pollution comes from domestic heating, industrial sources and agriculture. This polluted air can enter the vehicle cabin through its ventilation system, exposing the driver to the resulting health risks and discomfort. Therefore, it may well become increasingly the case that the car driver is more a victim of pollution than the cause.

Even without BEVs, there are already some aspects of the internal combustion engine (ICE) which foreshadow this trend. First, due to the efficacy of exhaust after-treatment systems, the levels of CO and NOx are so low in real-world operation that the impact on the environment is negligible. For example, under the latest European Real Driving Emissions (RDE) regulation, the average real-world emissions are 157mg/km from gasoline vehicles and 36mg/km from diesels for CO; and 9mg/km from gasolines and 45mg/km from diesels for NOx. Second, as demonstrated previously by Emissions Analytics, diesel particulate filters (DPFs) are so efficient that there are often fewer particles coming out of the tailpipe than there are in the air of a polluted city such as London⁴.
With this background, consider the scenario where the powertrain element ceases to be a major differentiator between mainstream BEVs. Power may be limited to maximise range, torque could be capped to reduce tyre wear emissions, and tyres may become skinnier to reduce rolling resistance but at the cost of handling. As and when connected and autonomous vehicles hit the road, this pattern may become even more pronounced. Furthermore, the cost of electricity – as low as three cents per kilometre – could mean the operating costs become almost irrelevant. Mainstream cars cease to have a performance dimension. Add to this the relatively few standardised manufacturing platforms and you have vehicles of increasingly similar performance. In this world, how will manufacturers differentiate their products and make decent profits?
Design undoubtedly will remain a key element, both for aesthetics, build quality and cost. Beyond that, with the background of historical air pollution problems and now Covid-19, it may well become the vehicle interior air quality that becomes a major differentiator. What once were major sources of pollution, could now become protective automotive bubbles.
Tesla’s launch of its ‘Bioweapon Defense Mode’ in 2016 was perhaps early evidence of this trend. The data presented by the company for its efficacy involved exposing a vehicle to high levels of particle pollution in an emissions chamber and showed that concentrations of particles by mass⁵ in the vehicle cabin fell from 1,000ug/m3 to undetectably low levels within two minutes, from which they concluded it could protect the vehicle occupant from biological attack⁶.
Grand claims need verifying, especially as to whether laboratory test results carry over into real-world conditions, so Emissions Analytics tested this model on a 2019 Tesla X in the UK. The test followed the protocol set out in an SAE paper published in 2019⁷.
The Tesla X is now equipped with a High-Efficiency Particulate Air (HEPA) filter as standard. In simple terms, the ventilation system has the typical ‘fresh air’ and ‘recirculation’ modes, but also the bioweapon mode too. This HEPA filter is enormous, as shown in the picture below – the installation requiring most of the width of the ‘frunk’. It is approximately 100cm long, 30cm tall and 3cm deep – a volume of over 9,000cm³. This compares to filter volumes on typical mass market cars of 1,000-2,000cm³.

The filter may be large, but it certainly works. In our test, interior concentrations were 94% lower than externally on fresh air mode, and 92% lower on the bioweapon mode during an on-road test – statistically indistinguishable from one another. This is the best performing vehicle we have tested so far. The principal difference between Tesla’s test and ours was that we measured ultrafine particles down to 15nm rather than particle mass. Together, the data suggests excellent protection from both bigger and smaller particles.
To put these results in context, Emissions Analytics tested 97 recent model year light-duty vehicles in the US in partnership with Edmunds⁸. Of all these, the best performing was a 2019 Honda Civic, which reduced particle concentration by 73%. Emphasising the significant differences, the worst performing vehicle was a 2019 Lexus ES, for which particles inside the vehicle were 254% higher than outside. Of the 97 vehicles, 44 had higher concentrations inside than out. This is an unregulated area at the moment, so there is no compliance issue, but there certainly is a potential health issue from chronic particle exposure.
A common driver strategy for protection from exterior pollution – often initiated when the driver senses a malodour – is to engage the recirculation mode on the ventilation system, which wholly or largely circulates, with varying degrees of filtration, existing interior air. This is effective in protecting from pollution ingress from outside, but has the side-effect of allowing CO² to build up in the cabin from the respiration of occupants. Although research is scarce in driving situations, the effects of elevated CO² on cognition have been shown, which leads to the reasonable belief that above 1,000ppm – compared to a background of just over 400ppm – there may be effects on driver safety as well as comfort⁹.
Returning to the Tesla, on fresh air mode, CO² increased by just 8%, while on recirculation the increase was 97%. Impressively, the bioweapon mode saw just a 17% increase. The average increase across the 97-vehicle test on recirculation mode was 15% on fresh air and 79% on recirculation.
From this, it is clear that there is a trade-off between protecting the vehicle occupant from particle ingress into the vehicle on fresh air mode and CO² build-up if recirculation is engaged. While this holds true at the level of the individual vehicle, it is not true at the market level. In other words, there are some models that are good at both, and some bad at both. The chart below plots each of the 97 models tested, plus the Tesla X, for particle infiltration on fresh air mode against CO² build-up on recirculation.

For particle number, the values are the ratio between concentrations in the interior and exterior air, so a value of one means they are the same on average. For CO², a value of zero means there is no increase in interior concentrations compared to the baseline. On this latter measure the Subaru Impreza showed the worst performance, in contrast with the best from the Chevrolet Suburban – as indicated on the chart.
In short, there is a wide diversity of results and no obvious pattern, whether it be by manufacturer, vehicle size or powertrain. The most conspicuous activity currently is from premium manufacturers, whose buyers perhaps have the greatest awareness or appreciation of clear cabin air. Beyond that, there appears to be little understanding of the issue in the absence of any useful consumer information.
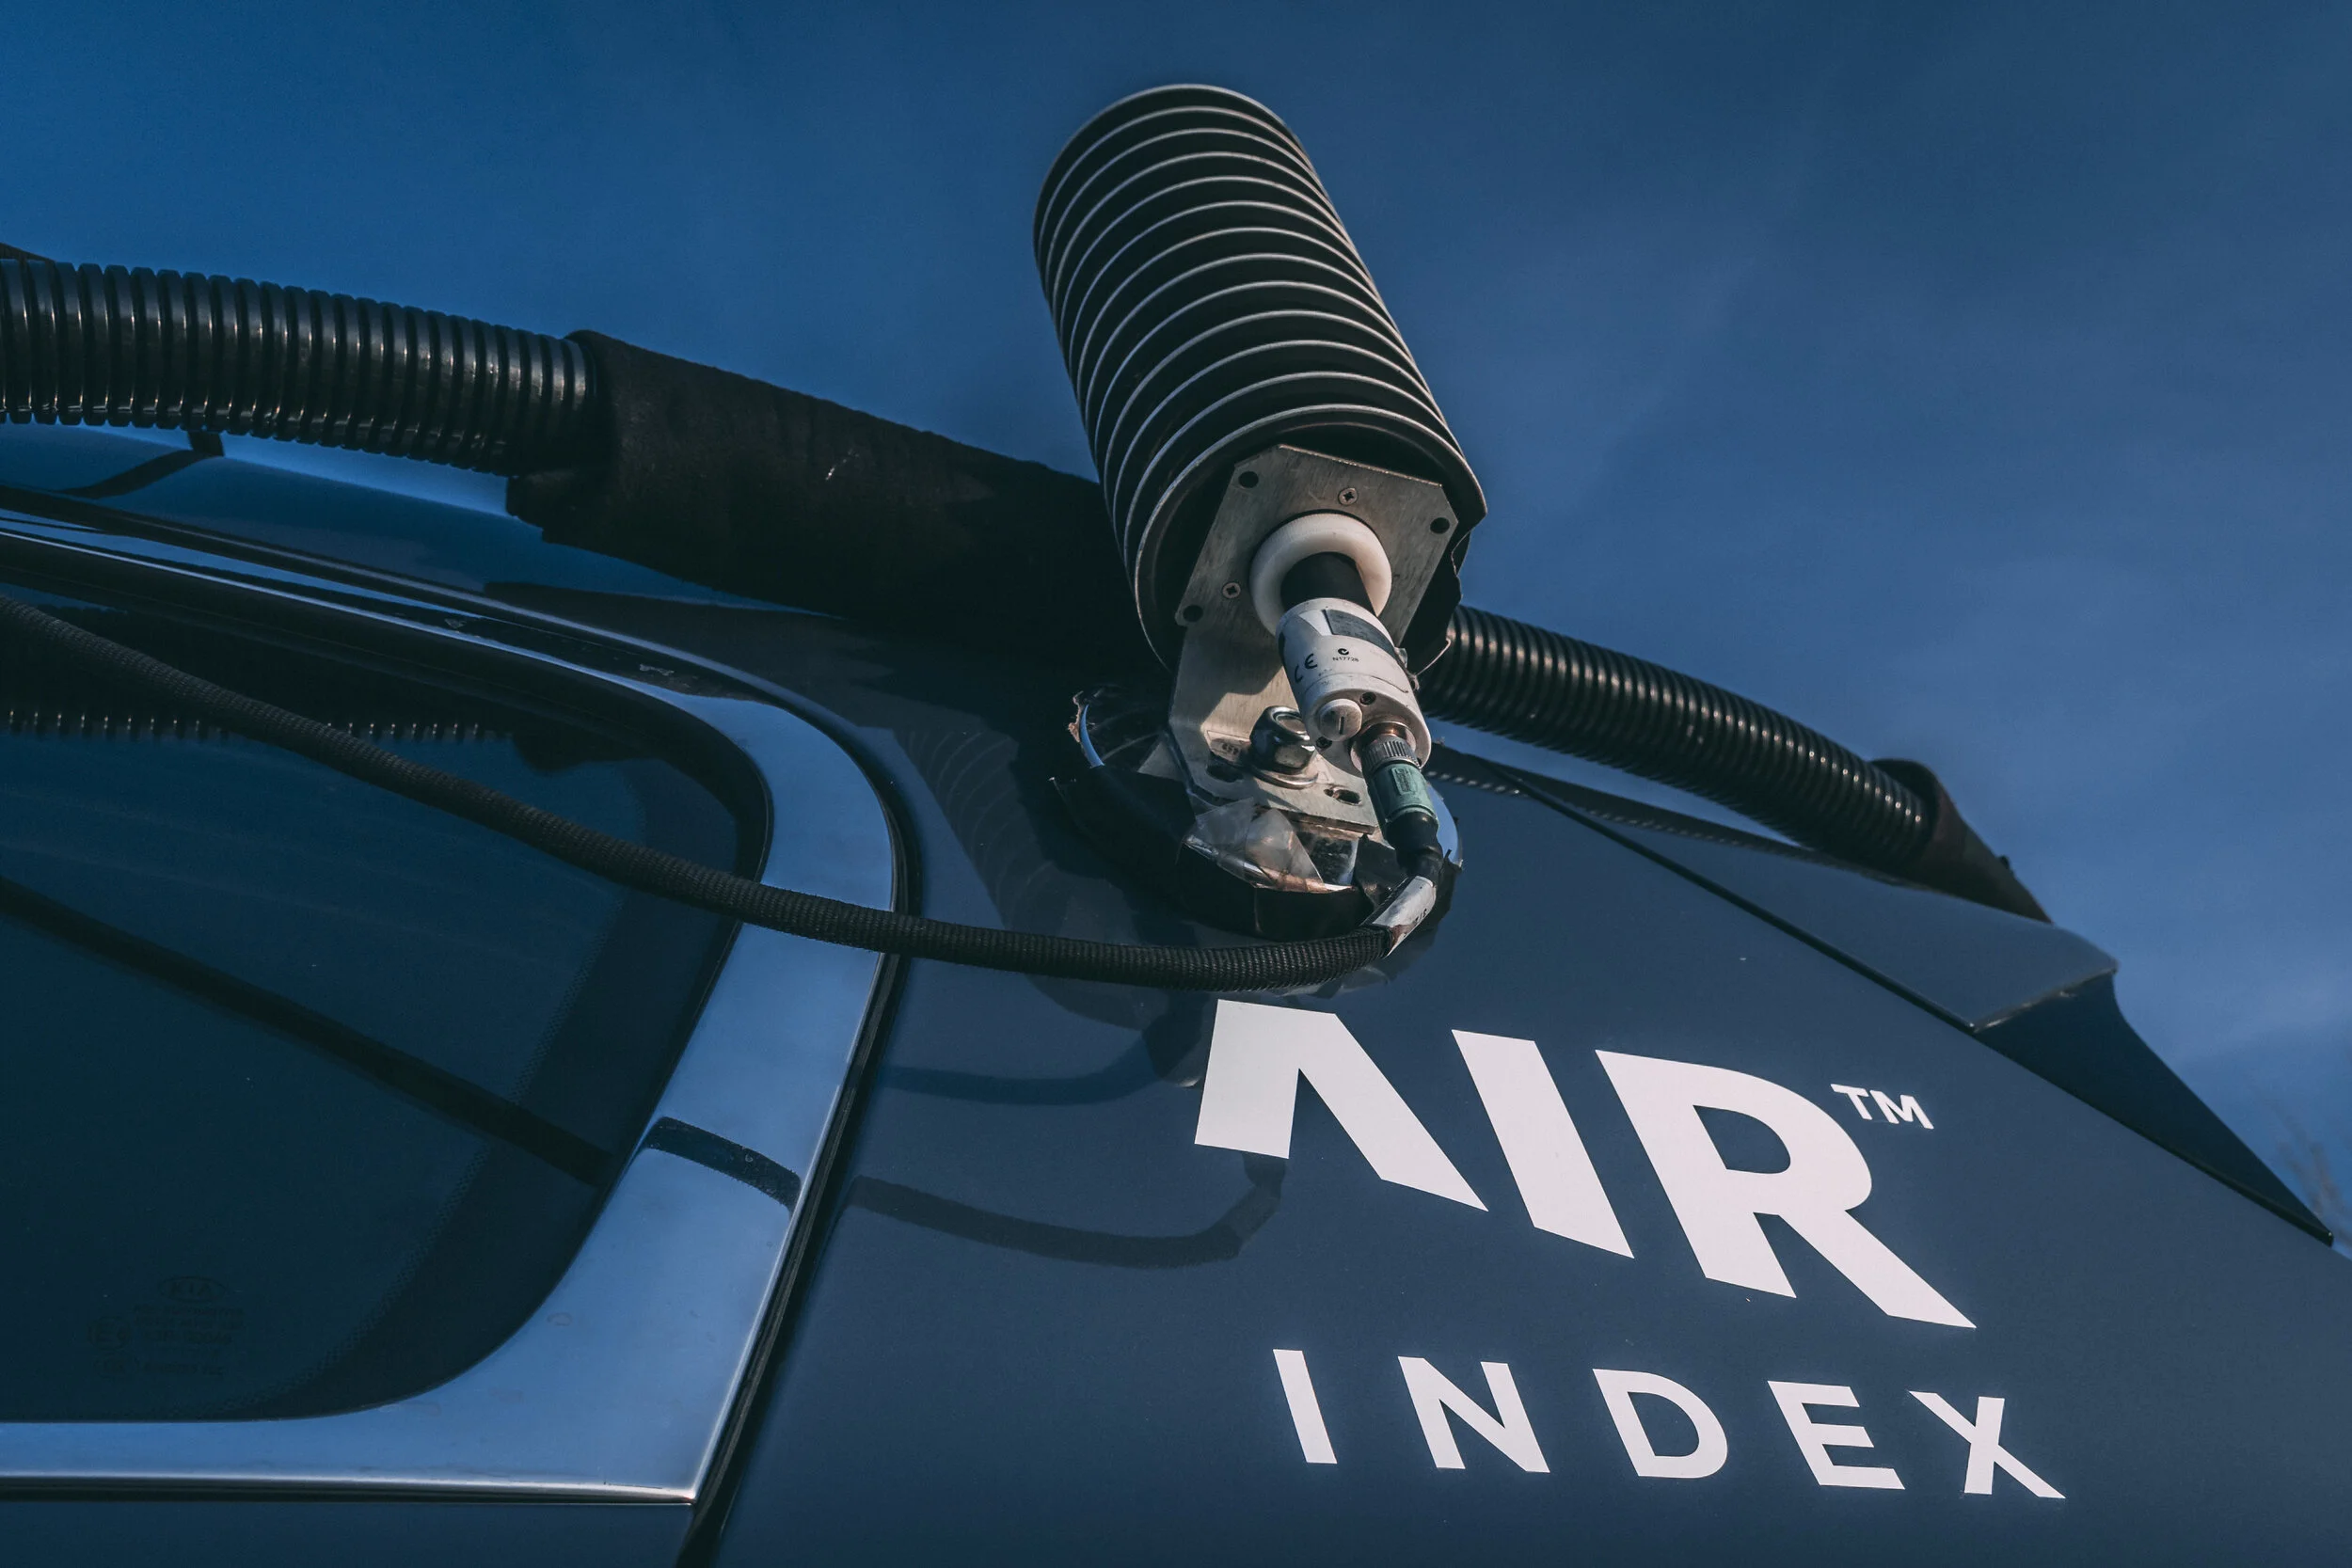
To help address this, Emissions Analytics is actively involved in a group aiming to standardise the measurement methodology for in-cabin pollution¹⁰. The group was initiated by the AIR Alliance, which already publishes ratings for tailpipe pollution¹¹. Along with Emissions Analytics, the group includes a number of vehicle manufacturers, academics, and filter and ventilation suppliers. Once completed, recognised and repeatable testing should enable ratings to be published that will both inform car buyers and, indirectly, incentivise manufacturers to improve interior air quality.

The Covid-19 pandemic brings these issues to the fore, as the virus is a particle of approximately 100nm in size. While ingress of live virus particles from outside into the vehicle is unlikely, reducing the chance of one infected occupant transmitting the virus to another is more relevant. Therefore, the rate at which air is recirculated and re-filtered matters. In this context many initiatives have appeared from vehicle manufacturers, suppliers and after-market companies. One example has been trailed by Jaguar Land Rover, using hydroxyl radicals to ‘purify’ cabin air¹². While this may be true in terms of neutralising a coronavirus, surplus hydroxyl radicals can also react to form toxic secondary oxygenated gases and aerosols¹³, and so it is vital to perform a broader, perhaps untargeted, assessment of the effects of such systems. Systems should be compared to the efficiency of filter-based systems such as on the Tesla X, to judge what value the hydroxyl radicals are adding – a judgement that will be allowed once there is a standardised method through CEN Workshop 103.
Thus, perhaps the future market for vehicles will be one of the quality of the experience rather than the magnitude of the performance. BEV range anxiety may be quelled and the charge-up infrastructure made omnipresent. Cheap, renewable energy will make efficiency almost irrelevant. The gradual strangulation of the road space for cars, combined with connectively between vehicles and automation thereof, may leave occupants stripped of the joy of the driving experience, but consequently more demanding in terms of the quality and healthiness of the experience. And this differentiation in experience, comfort, quality and design may be the route to profitability for manufacturers.
Footnotes:
https://www.emissionsanalytics.com/news/2020/1/28/tyres-not-tailpipe
PM2.5, i.e. all particles up to a diameter of 2.5μm
https://www.tesla.com/en_GB/blog/putting-tesla-hepa-filter-and-bioweapon-defense-mode-to-the-test
DPham, L., Molden, N., Boyle, S., Johnson, K. et al., “Development of a Standard Testing Method for Vehicle Cabin Air Quality Index,” SAE Int. J. Commer. Veh. 12(2):2019, doi:10.4271/02-12-02-0012

Video: CRC Oral Presentation March 2021
Our CEO & Founder, Nick Molden recently spoke at the annual CRC Real World Emissions Workshop.
Our CEO & Founder, Nick Molden recently spoke at the annual CRC Real World Emissions Workshop.
In this presentation, Nick discusses: ‘Are gasoline vehicles being promoted over diesels as an artifact of the pollutants measured?’

Video: The Situation with Air Quality in Europe
Following our successful We have forty million reasons for failure, but not a single excuse newsletter, our Founder & CEO, Nick Molden delves deeper into the situation with air quality in Europe.
Following our successful We have forty million reasons for failure, but not a single excuse newsletter, our Founder & CEO, Nick Molden delves deeper into the situation with air quality in Europe.

We have forty million reasons for failure, but not a single excuse
Rudyard Kipling’s description of Great Britain’s painful experience in the Boer War could easily have been written for Europe’s troubled recent experience in vehicle emissions control, air quality and associated public health.
Rudyard Kipling’s description of Great Britain’s painful experience in the Boer War could easily have been written for Europe’s troubled recent experience in vehicle emissions control, air quality and associated public health.
The forty million reasons are the forty million diesels still circulating on the roads of the UK and Europe, emitting more than treble the regulatory limit for nitrogen oxides (NOx) in real-world operation1. Of these, an estimated eight million are Euro 6 diesels. None of these are restricted from a single city in Europe, or taxed in a penal way. In Germany, rather than legislating to clean them up, the government has legislated to prevent them being targeted2. The original source of the problem – the European Union regulatory framework – has been directed not at cleaning up this lasting problem, but only at new cars. NOx emissions from this latest generation of vehicles – certified under the Real Driving Emissions (RDE) regulation – account for just 1% of the total, which leaves the 99% coming from previously sold vehicles. The centrally directed, improved, regulation has hardly touched the problem.

Unless these older vehicles are cleaned up, poor air quality will persist. With the average lifespan of a vehicle in Europe being 14 years, and high-emitting vehicles having been sold through to at least 2018, the problem is not about to disappear automatically through fleet turnover. A particularly egregious example is the Mercedes Citan 1.5-litre diesel van from 2019, which emitted 902mg/km of NOx in real-world driving – 8.6 times the regulatory limit – and which may remain on the road long after the UK’s 2030 ban on new internal combustion engines.
Nevertheless, it is not every single pre-RDE vehicle that is problematic. Contrast the Citan with the 2.0-litre Volkswagen Crafter from the same year, which emitted 53mg/km or 58% below the limit, to see that not all vehicles need restricting to address air quality today. Just over a third – 36% – of all vehicles on the UK roads, for example, create an estimated 87% of all NOx emissions, according to our modelling. A third of all emissions are accounted for by the 12% of dirtiest vehicles. In principle, the most efficient, fairest and least distorting way to bring air quality into compliance is to target those vehicles first.
Rather than focusing on making cleaner vehicles even cleaner, Emissions Analytics has been involved in a project for the last three years to test and rate all vehicles currently on the road, to get to the truly dirty vehicles. The project has been led by the AIR Alliance, and has brought together many parties in the spirit of co-operation. Emphasising the important, urgent and persistent nature of the problem was the landmark legal ruling in the UK in 2020 that the death of Ella Kissi-Debrah can be partially attributed to road pollution4.
Contrary to reports, the arrival of battery electric vehicles has not cured urban air quality problems. Perhaps they will, but market penetration of these vehicles will probably not be high enough until the next decade to make a measurable difference. In the meantime, legal contraventions of air quality standards will continue and can only realistically be addressed by cleaning up the existing fleet of internal combustion engines. Add to this the Covid-19 effect, which has seen a robustness in the used car market5 and early evidence of a switch away from public transport. As a result, older, high-emitting diesel vehicles could become more valuable and be kept on the road longer than expected.
Emissions Analytics is one partner of many in the AIR Alliance. Its first act was to bring together top experts and academics, including Dr Norbert Ligterink from TNO in the Netherlands, Professor Helen ApSimon from Imperial College London, Dan Carder from West Virginia University Institute of Technology in the US – who was responsible for uncovering Dieselgate – and Dr Xavier Querol from IDAEA-CSIC in Spain. The group is chaired by Dr Marc Stettler from Imperial College London.
In contrast to many one-off or time-limited initiatives researching this area, Emissions Analytics and AIR Alliance decided to create an on-going programme of testing and rating vehicles. Furthermore, they wanted to create a legal basis for independently rating urban NOx emissions. This was achieved through the publication of a standardised method – CWA17379 – as the result of almost eighteen months work through the Comité Européen de Normalisation (CEN) together with the automotive industry, cities, academics and lobby groups. From this, the AIR Index (www.airindex.com) was born.

How is all this different from the regulations? It is a voluntary movement bringing together a wide range of parties from different points of view interested in genuinely solving the urban air quality problem. Where the rules of multinational organisations have failed, on-the-ground co-operation has created a real-world ratings system with a legal basis.
With the standardised method coined, data was gathered from multiple sources. All data was subjected to strict quality criteria and tested against dynamic boundary conditions – including the speed and acceleration of driving – to test for validity under the method. Data flowed not just from Emissions Analytics, but from authorities and even manufacturers themselves. Results fully compliant with this method are live and free to access on the AIR Index website. In total, well over a thousand models have been tested and four thousand hours of data collected, to the value of over $16 million.
Despite all this data, the challenge with any system that is not by government fiat is achieving coverage of the whole vehicle parc. It is easy to test a representative sample of vehicles, but not to cover the long tail of models. The AIR Index has not achieved that yet, but is now close. In fact, ratings are already being published for 34,575 model variants.
With such a large repository of data, it has been possible to model and predict the emissions of vehicles similar to those already tested. Using machine learning techniques it is possible to predict with an impressive degree of accuracy the missing results. The model is trained on all the PEMS data drawn from the multiple sources. The validation set is then the fully compliant CWA17379 results, which are of course excluded from the training set. Using this approach, the average error between compliant and modelled values for distance-specific NOx is just 2.6%3. As a result, a large majority of predicted ratings can be validated through blind testing to deliver the correct AIR Index rating on its ‘A’ to ‘E’ scale. For clarity, fully compliant tests and modelled results are always clearly labelled and disclosed as such. If manufacturers, or others, disagree with their predicted ratings, conducting a full test to CWA17379 would lead to the result over-riding the predicted value.
By combining the fully compliant and predicted ratings, it has been possible to create coverage of at least 90% of Euro 5 and Euro 6 models, as shown broken down by powertrain in the table below. These figures include all manufacturers except very low volume niche producers.

Further testing planned may move total coverage to 95% soon.
The result of this work is that there is now a parallel system to the official, centrally directed, certification system that can be adopted by cities across Europe. As a result, cities now have a live, practical tool that can be put immediately to the task of managing the existing fleet to bring NO2 concentrations into compliance.
Analysing the results, we can identify the greatest sources of NOx emissions on UK roads, segmented by Euro stage and AIR Index, as shown in the table below.

Therefore, there is a group of Euro 5 vehicles, with an ‘E’ rating on the AIR Index, that accounts for a third of total emissions, while only representing 12% of vehicles on the road. London’s Ultra Low Emission Zone (ULEZ) has been relatively successful because it has applied an access charge for Euro 5 diesels and earlier, but this is not the most efficient solution as some clean cars are restricted. Were the ULEZ to be based on restricting only vehicles with ‘D’ and ‘E’ ratings on the AIR Index, NOx could be reduced by a further 6% points, while charging 2% fewer cars.
The group of pre-RDE Euro 6 diesels with ‘D’ or ‘E’ AIR Index ratings is smaller than the Euro 5 group, but still important at 9% of total emissions. What is even more significant about these vehicles is that they form the ‘swing group’ that can make the difference between air quality non-compliance and compliance.

In a research report from January 2020 from Imperial College London6, the AIR Index emissions values were combined with standard dispersion models to show the impact of different ULEZ strategies on ambient NO2 concentrations and the number of legal excedances. If the current strategy were applied to the enlarged ULEZ it was shown to bring most but not all locations into compliance with the 40μg/m3 limit, compared to a majority being non-compliant prior to the ULEZ. Switching to ULEZ restrictions based on ‘D’ and ‘E’ on the AIR Index scale, irrespective of Euro stage, was shown to be sufficient to bring all areas into compliance. In other words, the pre-RDE Euro 6 diesels make the difference.
Emissions Analytics is pleased to be involved in this practical, decentralised, collaborative, ground-up attempt to resolve one important element of air quality. On-going testing will move the project closer to complete coverage, and it is set up to welcome an increasing number of data partners. As the supply of data increases, so the accuracy of the database improves.
The only element missing is an honest reckoning by the authorities as to the systemic weaknesses that led to these problems. Without that, the weaknesses may resurface. For the sake of Ella, heed perhaps should be taken of Kipling:
Let us admit it fairly, as a business people should,
We have had no end of a lesson: it will do us no end of good.
Footnotes:
Transport & Environment, Cars with engines: can they ever be clean?, September 2018
Efficient control of NOx from diesel cars and ULEZ reduction of NO2 concentration, ApSimon, H., Oxley, T., Mehlig, D., Woodward, H., Stettler, M., Molden, N.
Video: Testing Plug-In Hybrids and Battery Electric Vehicles
Following the success of our recent newsletter ‘Letting the cat out of the bag: The great plug-in hybrid subsidy’ our Founder and CEO, Nick Molden has showcased our thorough testing process.
Following the success of our recent newsletter ‘Letting the cat out of the bag: The great plug-in hybrid subsidy’ our Founder and CEO, Nick Molden has showcased our thorough testing process.
Our independent testing tests for electric range and fuel economy separately. This gives us the necessary resolution on the vehicles we test and provides invaluable insights into the economic impact of these vehicles too. Find out more about our process.
Watch our video to learn more:
Letting the cat out of the bag: The great plug-in hybrid subsidy
In a recent newsletter, we set out Schrödinger’s Car, drawing a parallel with the famous Schrödinger’s Cat thought experiment, where a cat in a box is both dead and alive until the box is opened.
In a recent newsletter, we set out Schrödinger’s Car, drawing a parallel with the famous Schrödinger’s Cat thought experiment, where a cat in a box is both dead and alive until the box is opened. Schrödinger’s Car is a vehicle that has high and low carbon dioxide (CO2) emissions until the occasion that it is driven, which describes the current situation with plug-in hybrid vehicles (PHEVs). In the best case, they could be cleaner than pure battery electric vehicles (BEVs), in the worst case higher emitting than standard internal combustion engines (ICEs), and on current behaviour no better than non-plug-in full hybrids (FHEVs) – all on a lifecycle analysis basis.
The conclusion was that PHEVs are too risky to allow into the market in any volumes, unless strong incentive mechanisms are put in place for drivers to charge them up regularly and employ them only on duty cycles that can be conducted mostly on battery. In some European countries, there are in fact positive incentives not to charge PHEVs, for example for company car drivers that get reimbursed for fuel spending but not additional domestic electricity consumption.
Emissions Analytics has tested 37 PHEVs in Europe and US using its standardised EQUA Index test protocol. The average CO2 emissions on the European PHEV vehicles tested are 115g/km, based on the typical proportion of miles driven on battery discussed below. This compares to an average on the official ratings of 58g/km, based on the Worldwide Harmonised Light Vehicle Test Procedure (WLTP) – so, real-world emissions are almost exactly double.

If these excessive CO2 emissions were not problematic enough in themselves, this situation is creating significant, but somewhat covert, subsidies of PHEVs in Europe and the UK through the fleet average CO2 target system and consumer incentives. As set out below, the annual subsidy across Europe may well be above €6bn already. However, this could rise steeply in a particular scenario that BEV take-up is slower than expected and manufacturers need to sell PHEVs in volume as they struggle to meet their ever-tightening fleet average CO2 targets through to 2030 and beyond. In contrast, if BEV penetration rises rapidly, the scenario set out below will not hold, as CO2 targets will easily be met, and PHEVs will be a brief transitional technology. In the more pessimistic scenario, where manufacturers rely heavily on PHEVs to meet CO2 targets, cumulative subsidy could add up to €475bn by 2035 – more than all motor-vehicle-related taxes paid each year in Europe1.
To illustrate this, a selection of three European PHEVs were taken, and each were paired with the nearest equivalent ICE vehicle. The official details are shown in the table below.

In a recent report, the International Council on Clean Transportation (ICCT) estimated the proportion of miles travelled on battery by PHEVs in Europe currently at around 37%2. This factor can be used to weight zero-CO2 battery operation with engine-only CO2 approximated by the WLTP of the equivalent ICE vehicle to yield a 'simulated' WLTP for the PHEV, as shown in the following table. This can be compared to the actual test values from the EQUA Index tests, weighted in the same way. Conversely, it is possible to estimate what proportion of driving would need to be on the battery for the NEDC and WLTP official test values to accord with actual practice.
Overall, EQUA Index CO2 results were only 4% higher than the simulated WLTP values. Whether considering the NEDC or WLTP, approximately 80% of driving must be on battery for the official CO2 values to be a meaningful representation of current driving, which is more than double the current reality.
This matters because of how it interacts with the Europe-wide fleet average CO2 targets. Averaging the emissions of new vehicles sold, each manufacturer must not exceed a threshold which is currently around 95g/km (the exact figure being tailored to each company, based on their mix of vehicle types), but which reduces over time. For each g/km above the limit, the manufacturer is fined £85 (€95) multiplied by the number of units sold. Below the limit, the manufacturer can effectively sell its surplus to a rival that is above the limit, thereby reducing the fine paid by that latter manufacturer by the same £85.
Taking the sample of three vehicles above, the simulated WLTP average is 114g/km compared to the official values of 35g/km, a difference of 79g/km. Alongside this, until 2022, the fleet average targets include ‘supercredits’, which allow each vehicle with official CO2 below 50g/km to count as 1.67 vehicles sold in the manufacturer’s overall fleet calculation. Therefore, the value of the difference in CO2 emissions is currently magnified, as shown in the table below.
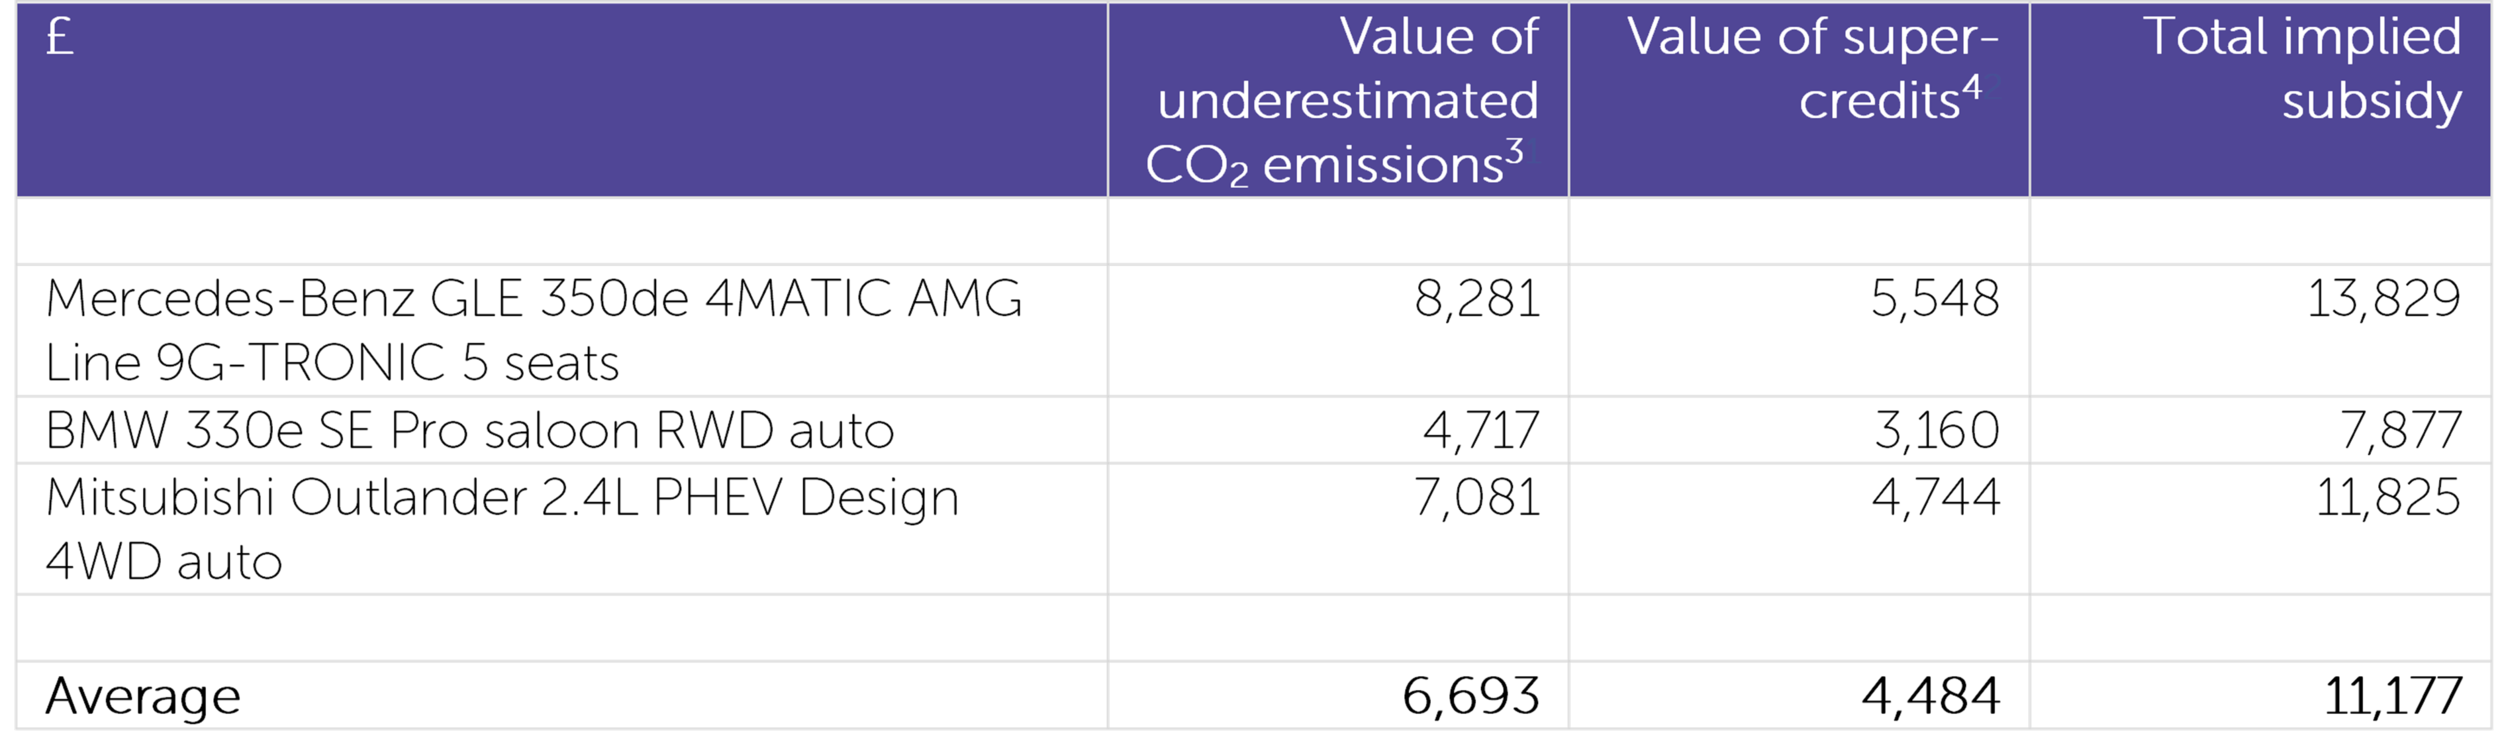
In other words, by having artificially low CO2 values, manufacturers enjoy a significant subsidy from the European taxpayer of over £11,000 (€12,100) per unit. This is equivalent to 24% of the list price. As these vehicles are typically profitable to make, unlike most pure battery electric vehicles, it is not surprising that a large number of new models are being brought to market.
In 2020, around half a million PHEVs were sold in Europe. This would imply a total subsidy of over £5.5bn (€6.1bn). Projections for PHEV sales in 2030 vary widely, from below 10% by Deloitte to as much as 50%. Assuming total sales of all powertrains of 15m vehicles in 2030, this implies a total potential subsidy in that year of between £10bn (€11bn) and £50bn (€55bn), factoring in the phase out of supercredits.
If we take the mid-point of these 2030 scenarios, PHEV market share grows in a linear way up until then, and is constant after that until 2035, the cumulative subsidy would be a not inconsiderable one-third of a trillion Euros. This is more than half the annual gross domestic product of Bavaria.
But this is does not cover all the subsidies available for PHEVs. Many European countries incentivise their purchase, through a combination of retail subsidies, annual car tax reduction and benefit-in-kind income tax reduction for cars provided to employees by their company. The type and magnitude of these subsidies vary significantly between countries, but we can take the UK as an example.
The source of the subsidy is the same as with the fleet average CO2 targets: artificially low official CO2 figures. It is the prerogative of governments to offer subsidies to consumers, but this is being done in a covert manner, and does not align with the true environmental effects of these vehicles. In the UK, the subsidy is channelled through company car benefit-in-kind tax and annual road duty. While the latter applies across the market, company cars – including schemes such as ‘salary sacrifice’ – account for only around 15% of the market5.
The table below shows the implied value of the underestimation of CO2 emissions – how much less consumers pay than they 'should'. The final column weights the company car subsidy by the 15% market share to get a representative value for the whole market.
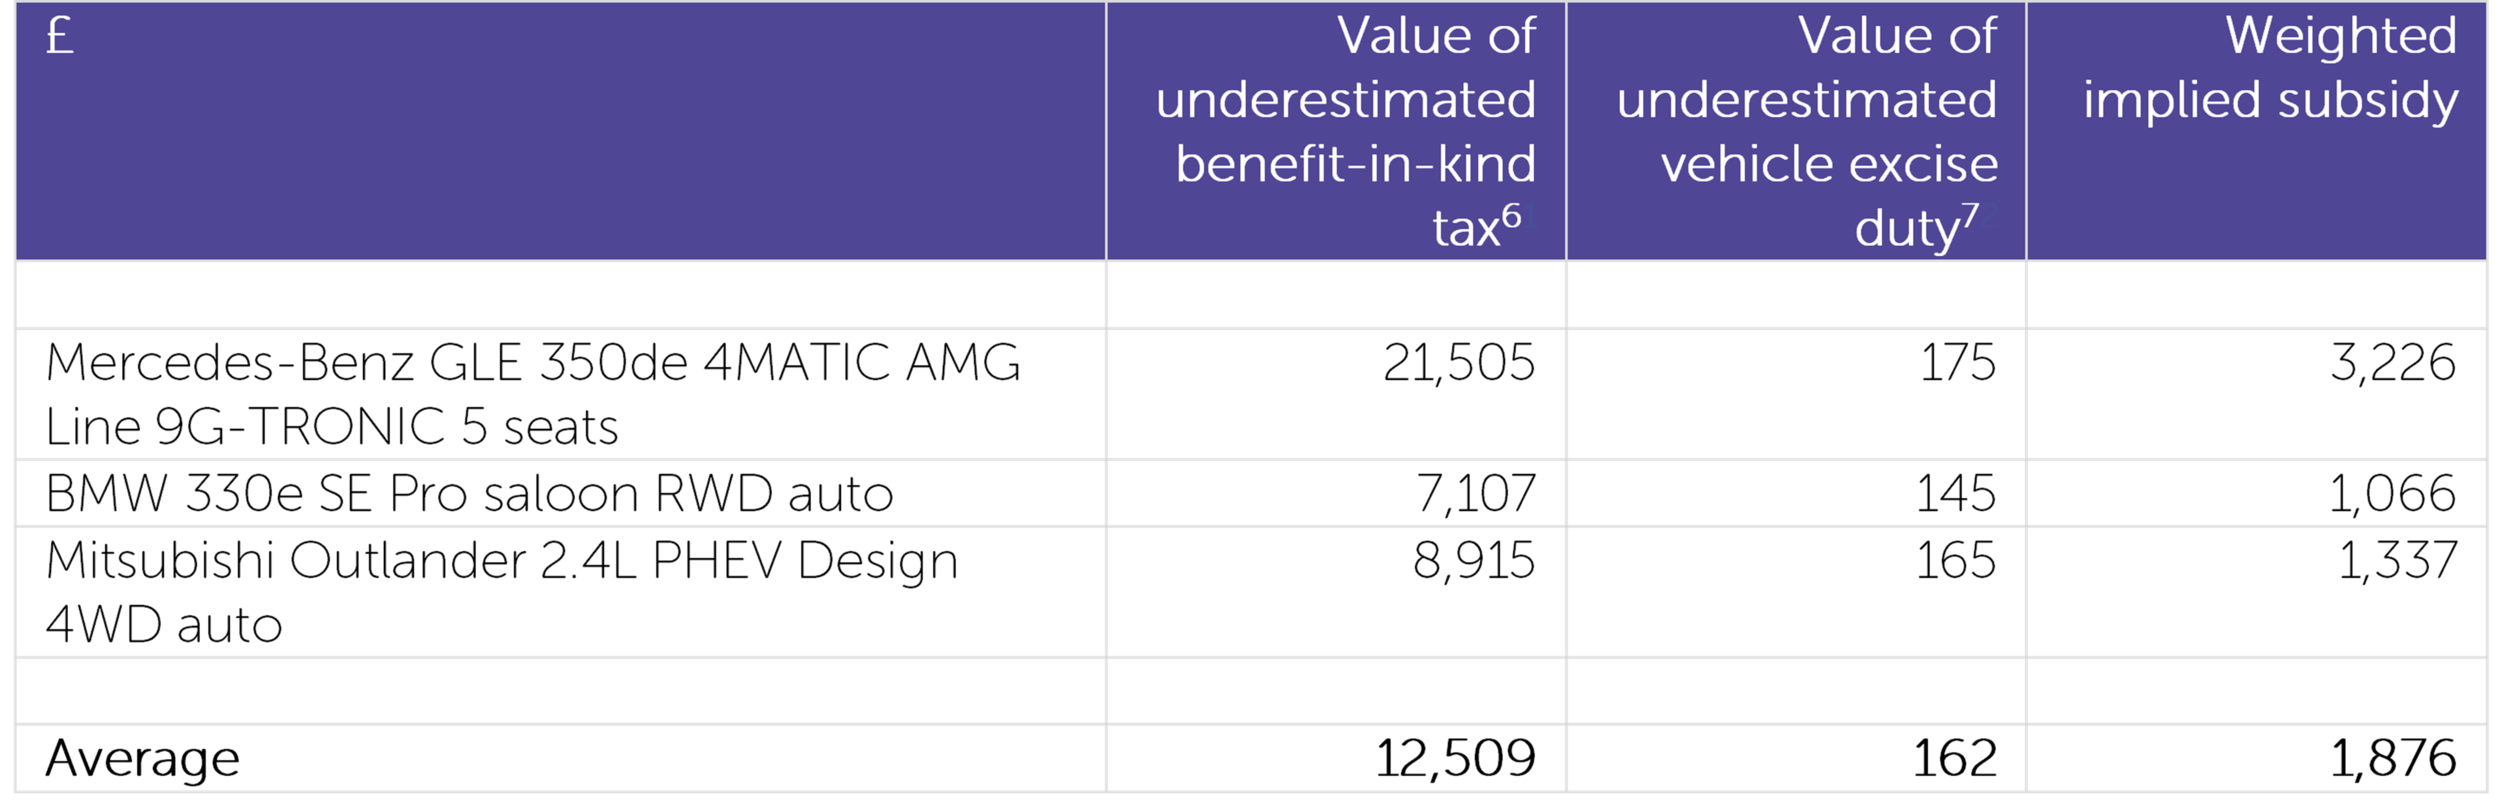
The subsidy to a company car driver over a three-year period is £12,671 (€13,938). On top of the manufacturer subsidy, this is 52% of the average vehicle list price. Across the whole UK market, weighting the company cars at 15% of the total market, the average consumer subsidy is over £1,800 (€1,980). Combining this with the manufacturer subsidy, the total subsidy is £13,053 (€14,358) per unit, or 28% of list price.
Taking this value, together with the same market share projections through to 2035 as above, the total subsidy would be €475bn – almost the same as the gross domestic product of Baden-Württemberg. Of course, this relies on the scenario that PHEVs are the swing factor for manufacturers in meeting or not meeting their future CO2 targets, which may not be the case if BEV penetration accelerates.
It should also be noted that the levels and terms of these taxes and duties are subject to change by governments at relatively short notice, and they differ between each country in Europe. Whether the overall level of support from governments is increased or decreased is unpredictable. In contrast, there is greater future visibility on the fleet average CO2 system.
Ultimately, the amount of taxpayers’ money dispensed, the trajectory of climate change and the structure of the automotive industry rides on whether Schrödinger’s Car, like the Cat, lives. Unless the right incentives are put in place around both original purchase for the right use cases, and after purchase to encourage charging the vehicles, PHEVs should have all subsidy removed immediately. With the current propensity for owners to charge their PHEVs, the CO2 emissions are no better than traditional hybrids, which do not attract the same subsidies, and which put much less pressure on the battery material supply chain.
Footnotes:
ACEA (European Automobile Manufacturers’ Association), https://www.acea.be/press-releases/article/motor-vehicle-taxation-brings-in-440.4-billion-for-governments-in-major-eur
Real-world usage of plug-in hybrid electric vehicles, International Council on Clean Transportation/Fraunhofer Institute for Systems and Innovation Research ISI, September 2020
Difference between simulated CO2 and NEDC, multiplied by £85 (€95) as the market price of carbon, applied only in year of purchase
Supercredits as defined under fleet average CO2 system – assuming x1.67 for a sale in 2021
According to HMRC, there are 870,000 company car drivers in total (https://www.fleetnews.co.uk/news/fleet-industry-news/2020/09/30/hmrc-data-shows-30-000-fewer-company-cars) and a vehicle may be held for an average of three years, yielding 290,000 purchases per year, which is approximately 15% of the 2m annual UK car market
Assuming 40% higher-rate tax payer, multiplied by 10% company car share of market over three-year period and 13.8% employer National Insurance
Annual vehicle road tax, based on CO2 emissions over three years
Archive
- AIR Alliance 3
- Air Quality 38
- Audio 3
- Climate Change 14
- EQUA Index 21
- Electrified Vehicles 28
- Euro 7 3
- Fuel Consumption/Economy 20
- Fuels 4
- Infographic 18
- Media 4
- NRMM/Off-road 3
- Newsletter 103
- Podcast 7
- Presentation/Webinar 18
- Press Release 19
- Regulation 16
- Reports 4
- Tailpipe Emissions 49
- Tyre Consortium 2
- Tyre Emissions 26
- Vehicle Interior 6