

Grand theft auto?
No-one seriously doubts manmade climate change, and there is more of a scientific consensus on the range of likely effects than some of the more lurid headlines would suggest. The cost of the impacts is reasonably clear. To solve climate change, the technology options are also fairly clear and well costed. There is also consensus that we need to invest now in the solutions, even if there is some disagreement as to the total net cost over time. Why, then, is it all proving so hard to see through?
Why we are not solving climate change
No-one seriously doubts manmade climate change, and there is more of a scientific consensus on the range of likely effects than some of the more lurid headlines would suggest. The cost of the impacts is reasonably clear. To solve climate change, the technology options are also fairly clear and well costed. There is also consensus that we need to invest now in the solutions, even if there is some disagreement as to the total net cost over time.
Why, then, is it all proving so hard to see through?

We sit here around the societal dinner table shouting at each other, rather than genuinely discussing, listening and trying to understand each other. The carnivorous fossil fuel industry goads the vegan environmentalist, who moralises back, while trying to ignore the side-order of climate-denial fruit.
The simplistic answer to why this is proving a hard problem to solve is that there are powerful incumbent interests in fossil energy production and associated industries. That is not news, although it is an inescapable fact. We are stuck because we are trying to dislodge the vested interests in a way that is unlikely to work. We are attempting property appropriation, when we actually need to cut a deal. We are not on the brink of a political revolution because consumers remain quite happy with their cheap fossil fuels. Therefore, we need to address the preeminent position of the fossil fuel industry within our social contract, within agreed property rights and with the consent of all sides. After all, society needs industry for its security and quality of life, just as industry needs social acceptability.
If you think the accusation of property appropriation is far-fetched, consider this. Cars are a perfectly legal product for consumers to buy and use around the world, but in Europe, in particular, there have been progressively tightening constraints on when, where and how they can be used. Rules start sensibly, for example with speed limits and highway codes – the safety benefits outweighing the constraint on personal liberty. Access controls or pricing may deliver urban air quality benefits that society values. Then we get to blanket access prohibitions, technology bans, SUV-shaming and so on. For producers, who have equally been trading cars quite legally, they find technologies in which they have internationally competitive intellectual property (for example, internal combustion engines) banned, or assets they have developed (for example, oil fields) become stranded. It is reported that the European Union (EU) may even ban car rental firms and large companies from buying anything but electric vehicles from 2030.
To any pragmatic reader, the best answer is clearly to strike a midpoint that balances societal costs and benefits. All sides could probably agree on this, although sub-arguments would undoubtedly run as to where exactly that midpoint was. In practice what is happening is that each side is competing to extremes: net ZERO, vision ZERO, and so on. This is such a mistake as bads (such as pollution) tend to exist as by-products of goods (mobility). The only way to zero bads is zero goods. So, it is no wonder that the two sides cannot come together and just shout at each other, in a binary struggle for survival.
By virtue of their strong incumbent position, the fossil fuel industry can afford to take a cautious position on any significant changes. To try and dislodge these entrenched interests, the following playbook is often employed by opposing interest groups:
1. Highlight something undesirable (climate change, road safety), and make it an “emergency”
2. Set a target of zero for the undesirable thing
3. Make it a moral/existential crusade
4. Pick the winning solution
5. Pay “independent” organisations to lobby for your choice
6. Recruit followers and evangelists to pursue a grassroots campaign
7. Impugn the motives of anyone who disagrees with you.
Of the many questionable tactics, it is possibly stage two that is the most damaging. If you require zero bads then you ask for a de facto ban. You are appropriating physical and intellectual property. The constraint on free behaviour is not in proportion with the damage caused by the bad. Some car manufacturers promulgate the idea of zero fatalities from driving. As preventing those last few accidents will be so disproportionately expensive, it effectively makes cars infinitely expensive. A de facto ban. For society, undoubtedly an undesirable outcome.

The EU is undertaking a more direct form of property appropriation, but it also sits within the broader theme of net zero. It legislated recently to force car owners to scrap their vehicles when significant repairs are needed. Classic cars – typically valuable – are excluded but roadworthy older cars that deliver solid motoring but that are worth little in the market are highly vulnerable. We wrote about this “end-of-life” vehicle regulation when originally promulgated, in Kohlendämmerung.
Recent legislative discussions have made the proposal less troubling on the surface of it, but more troubling in the detail. Rather than being forced to scrap a vehicle at the point of repair, it only applies if selling the car, at which point proof of roadworthiness would be needed. In addition, sales between private individuals are excluded from the requirement. For vehicles being sold by or to a dealer, or via an online platform, a roadworthiness certificate would be required. Where a vehicle was in need of repair, showed excessive wear or had leaking fluids, an independent expert would need to be commissioned to opine on whether the vehicle was at the end of its life. At the end of life, the owner would need to deliver the vehicle to a special facility and obtain a certificate of destruction. As roughly half of vehicles in Europe are transacted commercially, rather than privately, this can be seen as a material transfer of value – in terms of expert fees – away from the vehicle owner, although you could always circumvent this by selling your car privately. Nevertheless, there would be inevitable diminution in vehicle value.
So, on the surface, the proposal has been made more acceptable and truer to the objective of avoiding exporting dud cars and aiding resource circularity. However, worrying terms hide in the details. It leaves it to Member States of the EU how strictly to implement the criteria listed in Part B of Annex I [of “Proposal for a Regulation of the European Parliament and of the Council on circularity requirements for vehicle design and on management of end-of-life vehicles, amending Regulations (EU) 2018/858 and 2019/1020 and repealing Directives 2000/53/EC and 2005/64/EC.”] A country could take a pure and extreme interpretation of the “criteria to be assessed.” Worse, the European Commission can rewrite the criteria whenever it likes, without democratic safeguard:
In order to take into account technical and scientific progress, the power to adopt acts in accordance with Article 290 of the Treaty on the Functioning of the European Union should be delegated to the Commission in respect of amending Annex I determining the criteria on when a vehicle is end-of-life vehicle.
If the sales of battery electric vehicles lag the key 2035 targets, what is there to stop the end-of-life rules being tightened both to put consumers off buying the last generation of internal combustion engine vehicles at the same time as pushing more existing vehicles off the road?
It is quite striking how far down the road of property appropriation we have already been led, but it has of course been done sliver after slice. Even so, it is not sufficient to criticise unless a viable alternative to solving climate change can be offered – but there is. As we have shown, aiming for zero bad entails banning the good. It’s going too far. Just to eke out that last benefit comes at a huge cost. The optimal point is, much more plausibly, the point at which the benefit increase equals the cost of achieving. This can only be practically achieved by putting a price, by some mechanism, on the pollution. In this vein, credit should be given to the EU for progress made so far on putting a price on carbon, although there is a long way to go to make the system broad enough in application to be effective.

For cars, there is fortunately a solution at hand, as detailed in a recent book by Professor Felix Leach and Nick Molden called Critical Mass – the one thing you need to know about green cars. As most unabated pollutants correlate well with car weight, if vehicle taxation were changed to be based exclusively on this factor, a price of pollution would effectively be established. No bans. No property appropriated. Just the driver paying the right price for the pollution created. The driver will adapt behaviour according to the price, and generate tax revenues to fund wider societal goods. As an aside, it is paradoxical that many who oppose such pricing approaches are strong advocates for dynamic pricing of electricity for electric cars.
To work out where you on the appropriation-pricing spectrum, ask yourself what the correct question is. Is it How do we limit driving? or is it How do we limit climate change?. The latter is the right question. If you plump for the former, you are using climate change to pursue a separate, car-restricting idea. And if you are plumping for the former, you will be much more disposed towards property appropriation. This polarity appears in another incarnation very often: How do we push electric cars? in contrast to How do we decarbonise transport?. They are not the same thing, and if you put the first question as the primary one, you are more interested in promoting electric cars than you are cleaning up transport.
Which brings us to the deal to be done to solve the problem of vested fossil fuel interests. Much as we might object to the pollution their products lead to, these companies have created legitimate, legal assets. Moving forward, their products should pay the true price of the pollution created, which is relatively uncontroversial, and is practical as described above. But this will still reduce the value of their assets, and, to get them to accept this, a level of compensation will be required. Not full compensation, though, as supporting decarbonisation will give them renewed societal legitimacy. Just as when the National Health Service was founded in the UK, the doctors were paid handsomely to forego their endowed interests to build a new public healthcare system. Just as when European slave owners were compensated for the loss of their labour to build a more equal society. This may be distasteful, but if an endowment is legally obtained, appropriating it will not work. This is also distinct from vexed discussion of compensation for past injustices, whether that is climate reparations, through first nation peoples, to the 245 cattle given to the Maasai for culturally sensitive artefacts in Oxford. Rather, we are talking about a conscious deal to allow progress.

In summary, then, we are not achieving our climate change goals because we have postulated zero as the desirable goal, have stirred up moral panic and are heading down the road of property appropriation. This will not work, not least because so many people have their pensions invested in industrial incumbents. There is a useful contrast with how so much progress has been made improving urban air pollution. Zero pollution has never been suggested, solutions have been carefully calibrated to balance societal benefit against cost, incumbent industry has been part of the solution, morals have largely been kept out of it, and air quality is much improved on just ten years ago. We need to apply this urgently to climate change. If it means net-minus-80% carbon dioxde and everyone plays their part in the solution, we will be a lot better off than now.
Yet it is so tempting for each of us to the decide the “right” solution and – due to the vital important of the topic – force this answer on others as a moral rather than objective imperative. Jean-Jacques Rousseau, the French philosopher writing in 1762, believed that people, when acting rationally and considering the common good, would naturally choose to obey laws that promote the overall well-being of society. Forcing someone to adhere to such laws is, therefore, simply helping them realise their true, rational will. In the famous phrase, they should be “forced to be free.” This is very much the theme and philosophy of European governments right now. It is not so different from how Stalin and Mao sought “moral improvement” of their people. This is a slope, and a dangerous one if you choose to go down it.
So, we have a choice between an unpalatable deal and a dangerous challenge to liberty. Put another way: the combustion car is under threat of being outlawed in order to dislodge fossil fuel interests. The economic, geopolitical and social damage from this may be much greater than a pragmatic deal, and may just hand the economic rent enjoyed by fossil industries straight to a different set of equally uncontrollable industrial and political interests.
Chose thoughfully, and be careful what you wish for.

The most complex suicide note in history?
The 1983 UK General Election saw the Labour Party manifesto dubbed the longest suicide note in history. The current policy for decarbonising transport in the UK and Europe may be the most complex one. For the policy to work, it is necessary simultaneously to switch the grid to green sources and fundamentally change the relationship between consumers and their cars, in order to balance that new grid. Both are a major challenge, and if either fails, the whole policy fails. If it does go off plan, we may well end up with undesirable cars being powered by a dirty grid, and an unresolved climate change problem. Are industry and government locked in a suicide pact?
Vehicle emissions and grid decarbonisation
The 1983 UK General Election saw the Labour Party manifesto dubbed the longest suicide note in history. The current policy for decarbonising transport in the UK and Europe may be the most complex one. For the policy to work, it is necessary simultaneously to switch the grid to green sources and fundamentally change the relationship between consumers and their cars, in order to balance that new grid. Both are a major challenge, and if either fails, the whole policy fails. If it does go off plan, we may well end up with undesirable cars being powered by a dirty grid, and an unresolved climate change problem. Are industry and government locked in a suicide pact?
We are not used to living in age of electricity rationing, but this is a real prospect as we try to clean our grid with a big switch to renewable energy sources. The UK is already flirting with using its contingencies, even on the existing less intermittent grid, with fewer electric cars and data centres – although at no point so far has the grid come close to shutting down. On 3 December 2024, headroom was nearly eliminated such that a call for rapid reaction contingencies was initiated. On 8 January 2025, power had to be called from Norway to preserve headroom. These are just the first inklings of a problem, and one that applies to many European countries, not just the UK.
The underlying challenge is that we are trying to expand grid capacity to meet rising demand, while at the same time decarbonising it. The chosen primary route to decarbonisation is renewables – specifically wind and solar. These sources have two limitations. First, as they are intermittent, they need accompanying storage to save the surplus peak energy and release it during dark or windless hours. Second, they have relatively low “capacity factors” – the ratio of actual electricity generated in practice compared to the theoretical maximum. Therefore, it is necessary to “oversize” the installed capacity to generate the same electricity as traditional energy sources. Together, to make this approach work, it is necessary to install significant amounts of wind, solar and storage.
The UK’s National Energy System Operator (NESO), which runs the electricity grid, has published a number of scenarios for electricity demand and supply through to 2050, in the context of aiming for net zero . As a measure of the tightness of supply in 2050, even though the installed capacity of wind is forecast to increase by a factor of five and solar by a factor of six compared to 2023, this is not enough to switch off traditional fossil fuel production. Nuclear is also forecast to increase almost four-fold (which would be great for emissions reduction, but would need enormous commitment to achieve), and interconnections to other countries almost three-fold. Still, not enough.

To fulfil the projected 146% increase in annual electricity demand, the vehicle fleet is expected to contribute in two new ways: “demand management” and “vehicle-to-grid storage.” Demand management and its “smart pricing” seek to shift demand to times when there is surplus renewable power. Vehicle-to-grid (V2G) or bi-directional charging allows the grid to suck energy out of your car when the grid needs it. In other words, you will be constrained in when you can afford to charge up, and you might find a lack of charge in your car for your journey. If, for example, only 20% of cars are plugged in at the crucial time, those connected could lose 3 kWh each hour based on NESO projections. Of forecast peak capacity in 2050 of 119 GW, smart pricing reduces demand by 12 GW and V2G could provide 20 GW of power. Therefore, the vehicle fleet is expected to contribute 27% of peak demand to make the numbers add up. This comes at the cost of constraining personal freedom and the inherent attraction of the motor car. On most days, it will be fine, but consider those dark, still, winter Dunkelflaunten when your car will be an expensive brick. This will reduce the utility of a car, and so the willingness of consumers to pay. Fewer cars will be sold, at lower prices, with damage to the industry and personal welfare.
Some, however, would say that such an outcome would be good if it reduces demand for private motoring and leads to a shift to public transport. The bigger problem that remains is that, even with demand management and V2G storage, grid capacity might still fall well short of growing demand. Of the 116 GW of installed capacity in 2023, 36% of this is to be shut down to meet net zero – primary gas and biomass sources. If we take NESO’s “Electric Engagement” scenario where almost the whole fleet is electrified by 2050, 386 GW of installed capacity is needed. In other words, the “clean” part of the grid in 2023 would need to be increased more than five-fold by 2050. 344 GW of new capacity would need be installed that did not exist in 2023. Just 19% of the forecast grid in 2050 was already in place in 2023. Although the UK in particular has made good progress in decarbonising its grid so far, future infrastructure requirements for 2050 are large and risky. If, for example, we fall 25% short of the target for new build-out, it would leave a supply gap of 68 GW in 2050.
At the same time as we face the risk of falling short on supply, demand could rise more quickly than expected. This is not just speculation, as the question is being forced on us by a seismic change since the vehicle electrification policy was enacted: Artificial Intelligence (AI) is taking off in a way that exceeds the expectations of most. As a result, the well-understood increase in electricity demand needed to support a BEV fleet (around 28 GW in 2050 with unmanaged demand) has now been joined by rapidly growing – and somewhat unpredictable – demand from AI. Just one example, as reported in The Guardian recently, is an application submitted for a new data centre in the UK that would “…cause more greenhouse gas emissions than five international airports.” It is forecast to consume 3.7 bn kWh [3.7 TWh] of energy per year when running flat-out, releasing 857,254 tonnes of carbon dioxide (CO2), based on the current average grid mix.
The same NESO scenario as above assumes electricity demand from data centres to be 54 TWh in 2050. One of the more bullish forecasts is from the BloombergNEF, at 3,700 TWh globally. As the UK is approximately 3% of global GDP, that would imply 111 TWh in the UK. This would reflect 39% of 2023 demand and 16% of forecast demand in 2050. If correct, this would create 57 TWh, or almost 7 GW running constantly, of extra demand on top of the Electric Engagement scenario forecast. For comparison, Wood Mackenzie, a consultancy, is already tracking 134 GW of new data centres in the US, which would be 17 GW if pro-rated to the size of the UK. The BloombergNEF projection may, therefore, turn out to be cautious.
So, we can see that persuading customers to buy BEVs is only part of the challenge. Even if we electrify everything, our demand forecasts must be accurate, supply capacity build must happen, and car owners must be willing to engage with behavioural change. If these conditions are not met, we may not have the capacity necessary to meet demand. On plausible scenarios we could be at least 75 GW short, or 19% of the forecast installed capacity in 2050. In this case, what would happen?
The first instinct would be to “manage” demand further. The 75 GW shortfall assumes the maximum use of vehicle smart charging, so that is not an option. Authorities could move to a harder rationing of electricity for motor vehicles, which would be possible by restricting use of public chargers and more aggressive use of V2G storage capacity. It is likely that authorities would prefer to limit motor vehicle use than home heating or electricity, or industrial activities. With remote working now commonplace, driving would be the first activity to be cut, for all but essential purposes. The alternative would be to keep fossil fuel power generation going for longer, which would be politically highly embarrassing.
Despite the embarrassment, it is possible that governments may keep fossil power stations so people could keep driving. In this case, it would be fair to see vehicles as powered by marginal, “dirty” electricity. At present, the marginal CO2 per kilowatt-hour (kWh) of electricity is 350 in the UK, compared to an average carbon intensity of 124 g/kWh. So, almost three times dirtier at the margin. The European Union (EU) marginal rate is around 550 g/kWh, compared to an average of 244 g/kWh. In Poland, the values rise to 880 and 662 g/kWh respectively. This illustrates that the cleaner the average grid becomes, the greater the proportionate uplift at the margin is likely to be. It is worth noting that France’s current grid carbon intensity is 24 g/kWh on average but 510 g/kWh at the margin; even 18 nuclear power plants with 57 reactors is not always enough.
In future, the carbon intensity of the grid at the margin is likely to remain similar to today, at 350 g/kWh. Applying Emissions Analytics’ own real-world testing and decarbonisation modelling, we see the following. The second column covers all the up- and down-stream carbon in making and ultimately disposing of a vehicle, and liquid fuel production. The second column covers the tailpipe CO2 and the same emissions from electricity generation. Each powertrain/grid combination can then be compared over the life of a car compared to the gasoline ICE baseline.

The “average grid” scenario reflects the situation today, where there is sufficient grid capacity to power the new BEVs, but the sources of energy are mixed, including significant fossil fuel gas. The “marginal grid” scenario is similar to NESO’s Electric Engagement scenario, but where capacity growth falls materially short, vehicle-to-grid does not work, or demand growth is even greater than expected. In other words, the new BEVs are being powered entirely by the marginal, fossil fuel energy.
On the current grid mix, BEVs already reduce lifecycle CO2 by 49%, whereas in the EU it is only 32%. In the worst case scenario, having invested so much in electrifying the fleet, the UK might find only a 16% reduction in CO2 emissions. The EU could be in any even worse position, with CO2 rising by 13%, although this is unlikely to happen as the current marginal sources derived from coal would likely have been replaced by gas by 2050.
Which leaves an interesting dilemma. If we push ahead with a best case scenario that gives 85% CO2 reduction thanks to a clean grid, but we fail to make the grid work or demand soars unexpectedly, we could easily end up in a scenario that would be worse than the low risk option of converting the fleet first to plugless full hybrids, which would allow us to bank 29% CO2 reduction quickly and for low cost. Put another way: if we want to convert the fleet to all-electric by 2050, we must be certain that the grid can accommodate such a fleet cleanly.
The optimal strategy, we would suggest, is to push for hybridisation of the fleet simultaneously with grid decarbonisation, and only push on to fully electrified vehicles when the clean grid capacity is secure. This would be a more robust mix of risk and outcome. It would not meet net zero by 2050, but it would reduce delivery risk, and reduce CO2 more quickly in the early years by avoiding the high manufacturing emissions caused by largescale battery production. As readers of many previous newsletters will recall, Emissions Analytics believes that the data points to hybrids – especially full hybrids, with a decent battery size but no plug – being the best way to decarbonise transport for the next decade. After that, fostering technology-neutral competition between rival technologies would be optimal. During the coming decade, investment should be sharply focused on decarbonising the electricity grid, rather than subsidising well-off people to buy expensive (and heavy) pure electric cars.

If we mess this up, we might yet end up living the joke of having to charge up our electric vehicles with a diesel generator. (The AI-generated image above probably cost us 5 grams of CO2 emissions…) Having just recovered from a recent visit to an unnamed low carbon vehicle show that involved entering through unmistakable clouds of diesel fumes from the backup generators running the stands, this is clearly undesirable. At Emissions Analytics’ most recent conference, called Off-Highway Powertrain & Fuels and which we hosted in Chicago, a session stood about these static power sources. Demand is soaring for utility-scale, diesel-fuelled generators, most notably to power data centres to fulfil the already-voracious appetite AI systems have for energy.
Has the suicide note already been signed?
Postscript
We have taken a largely UK and European perspective in this newsletter, but similar arguments are playing out in the USA. For an insightful read from that perspective, we would recommend the article U.S. Energy Policy Undercuts EVs to Make Way for AI by Tammy Klein published recently in Transport Energy Strategies.
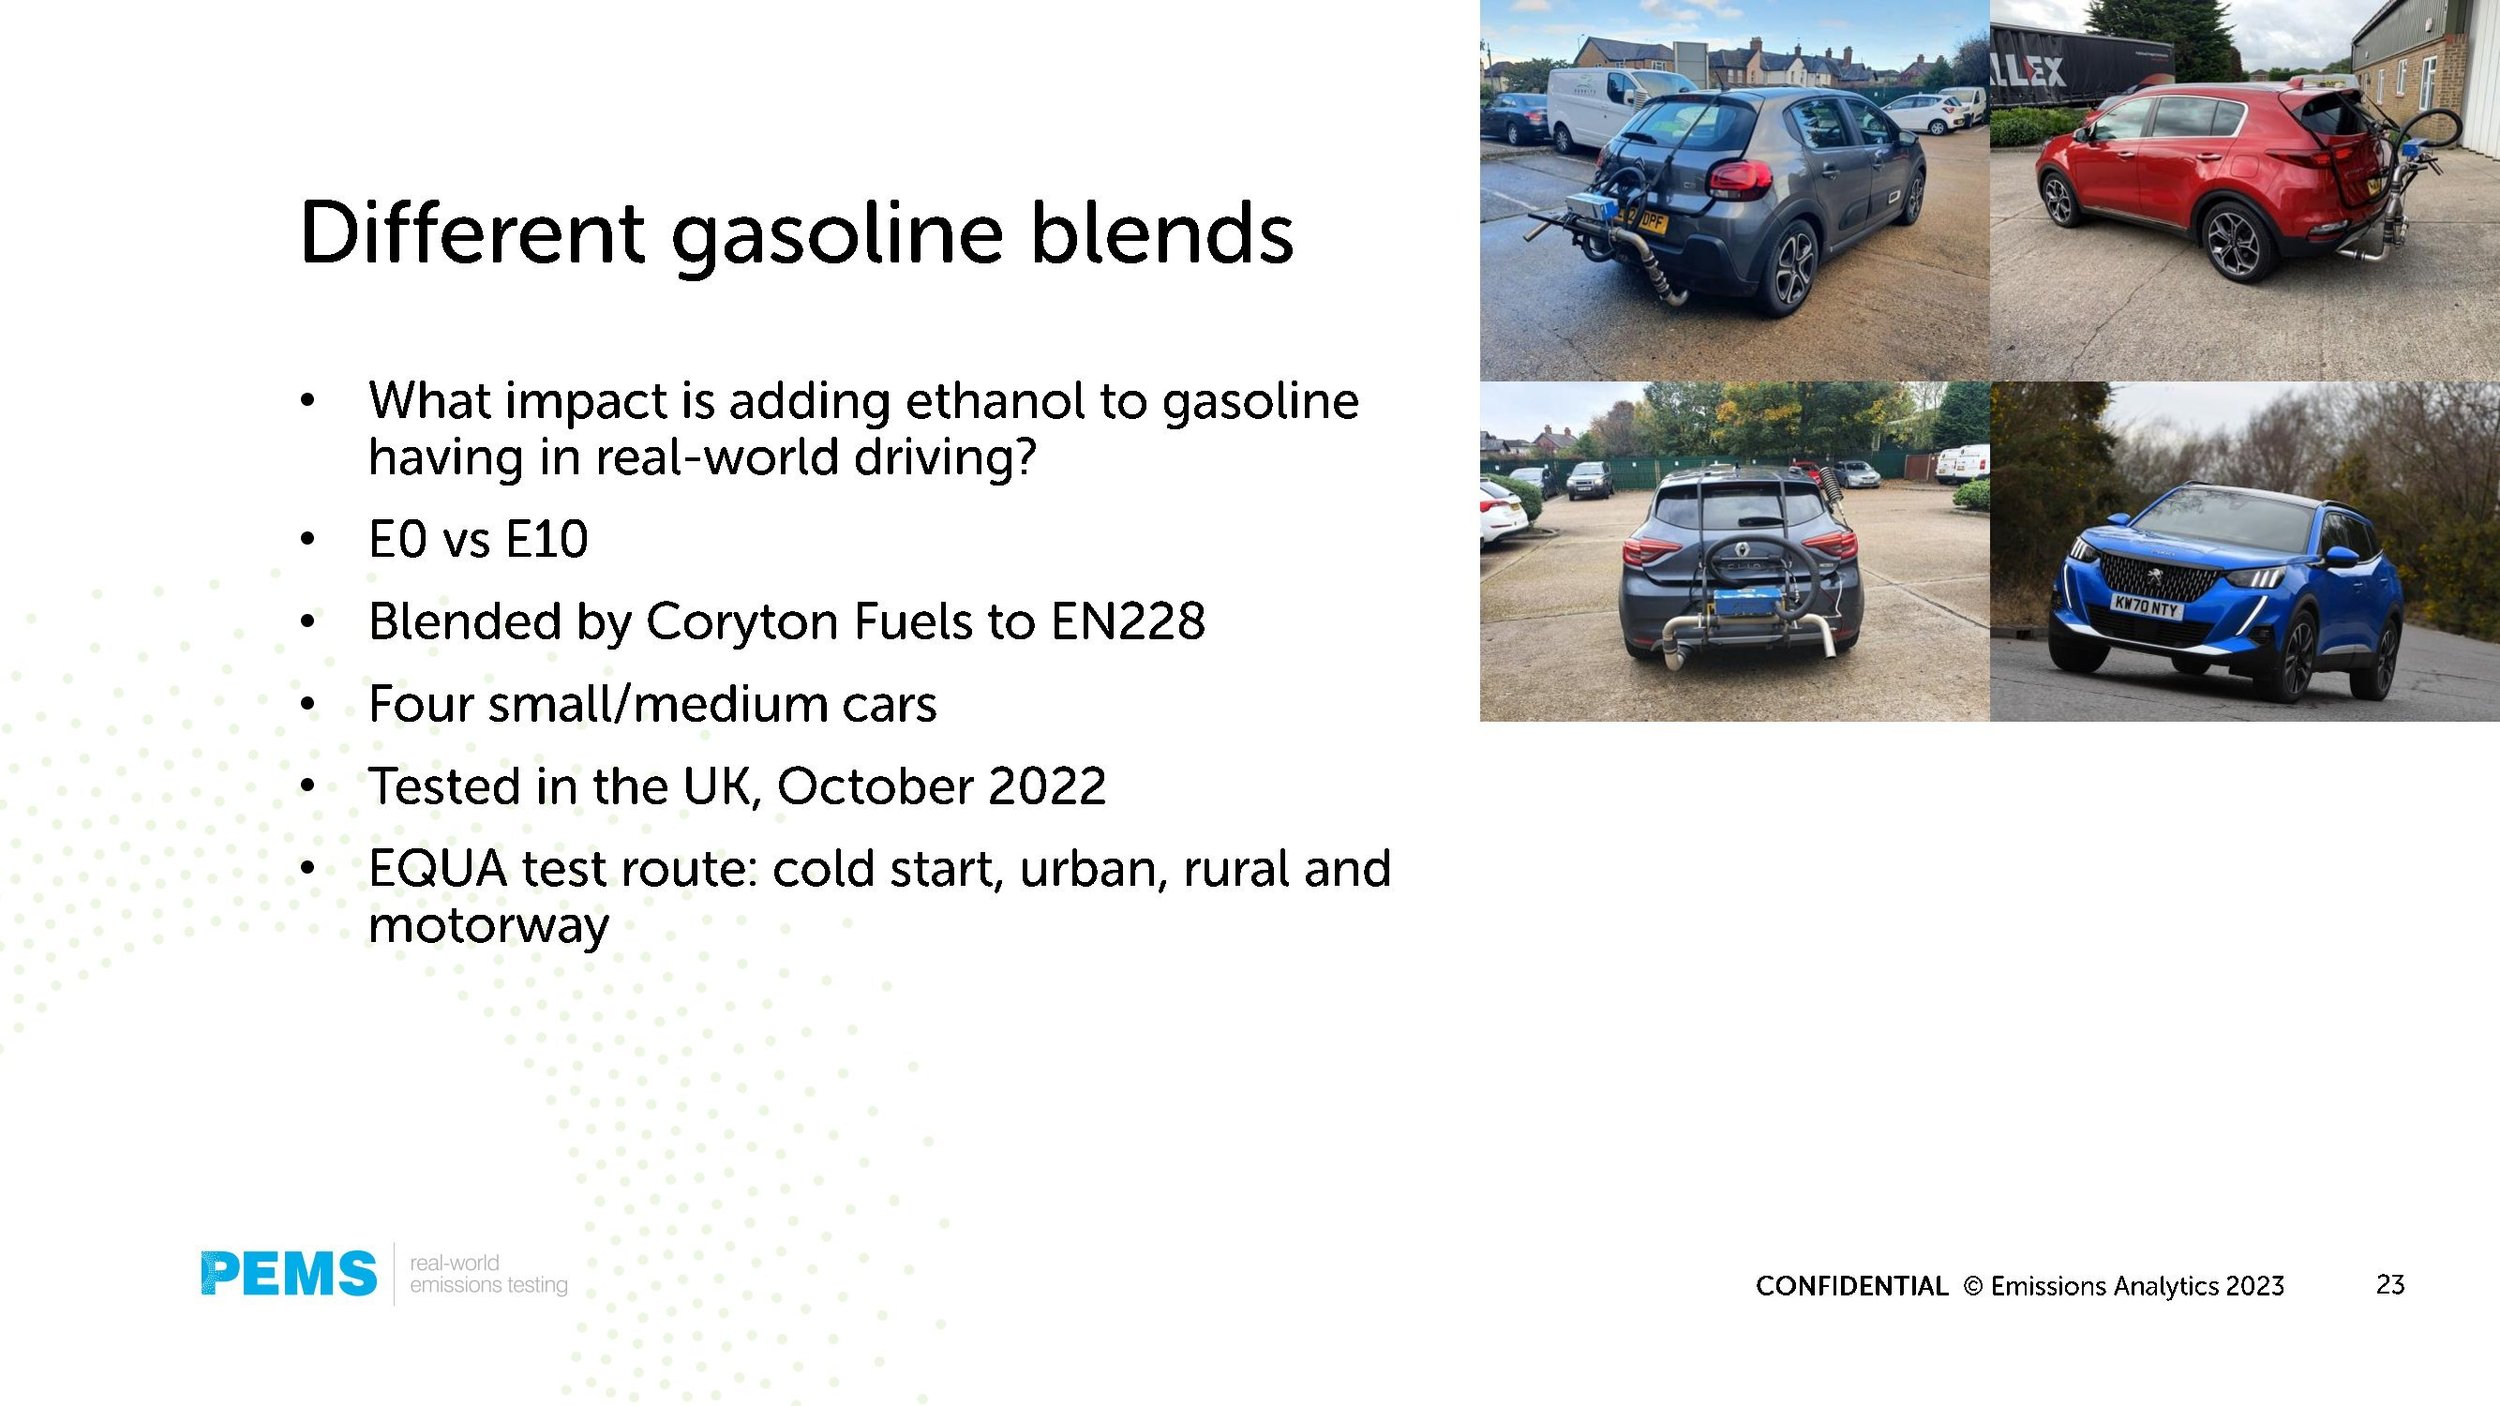
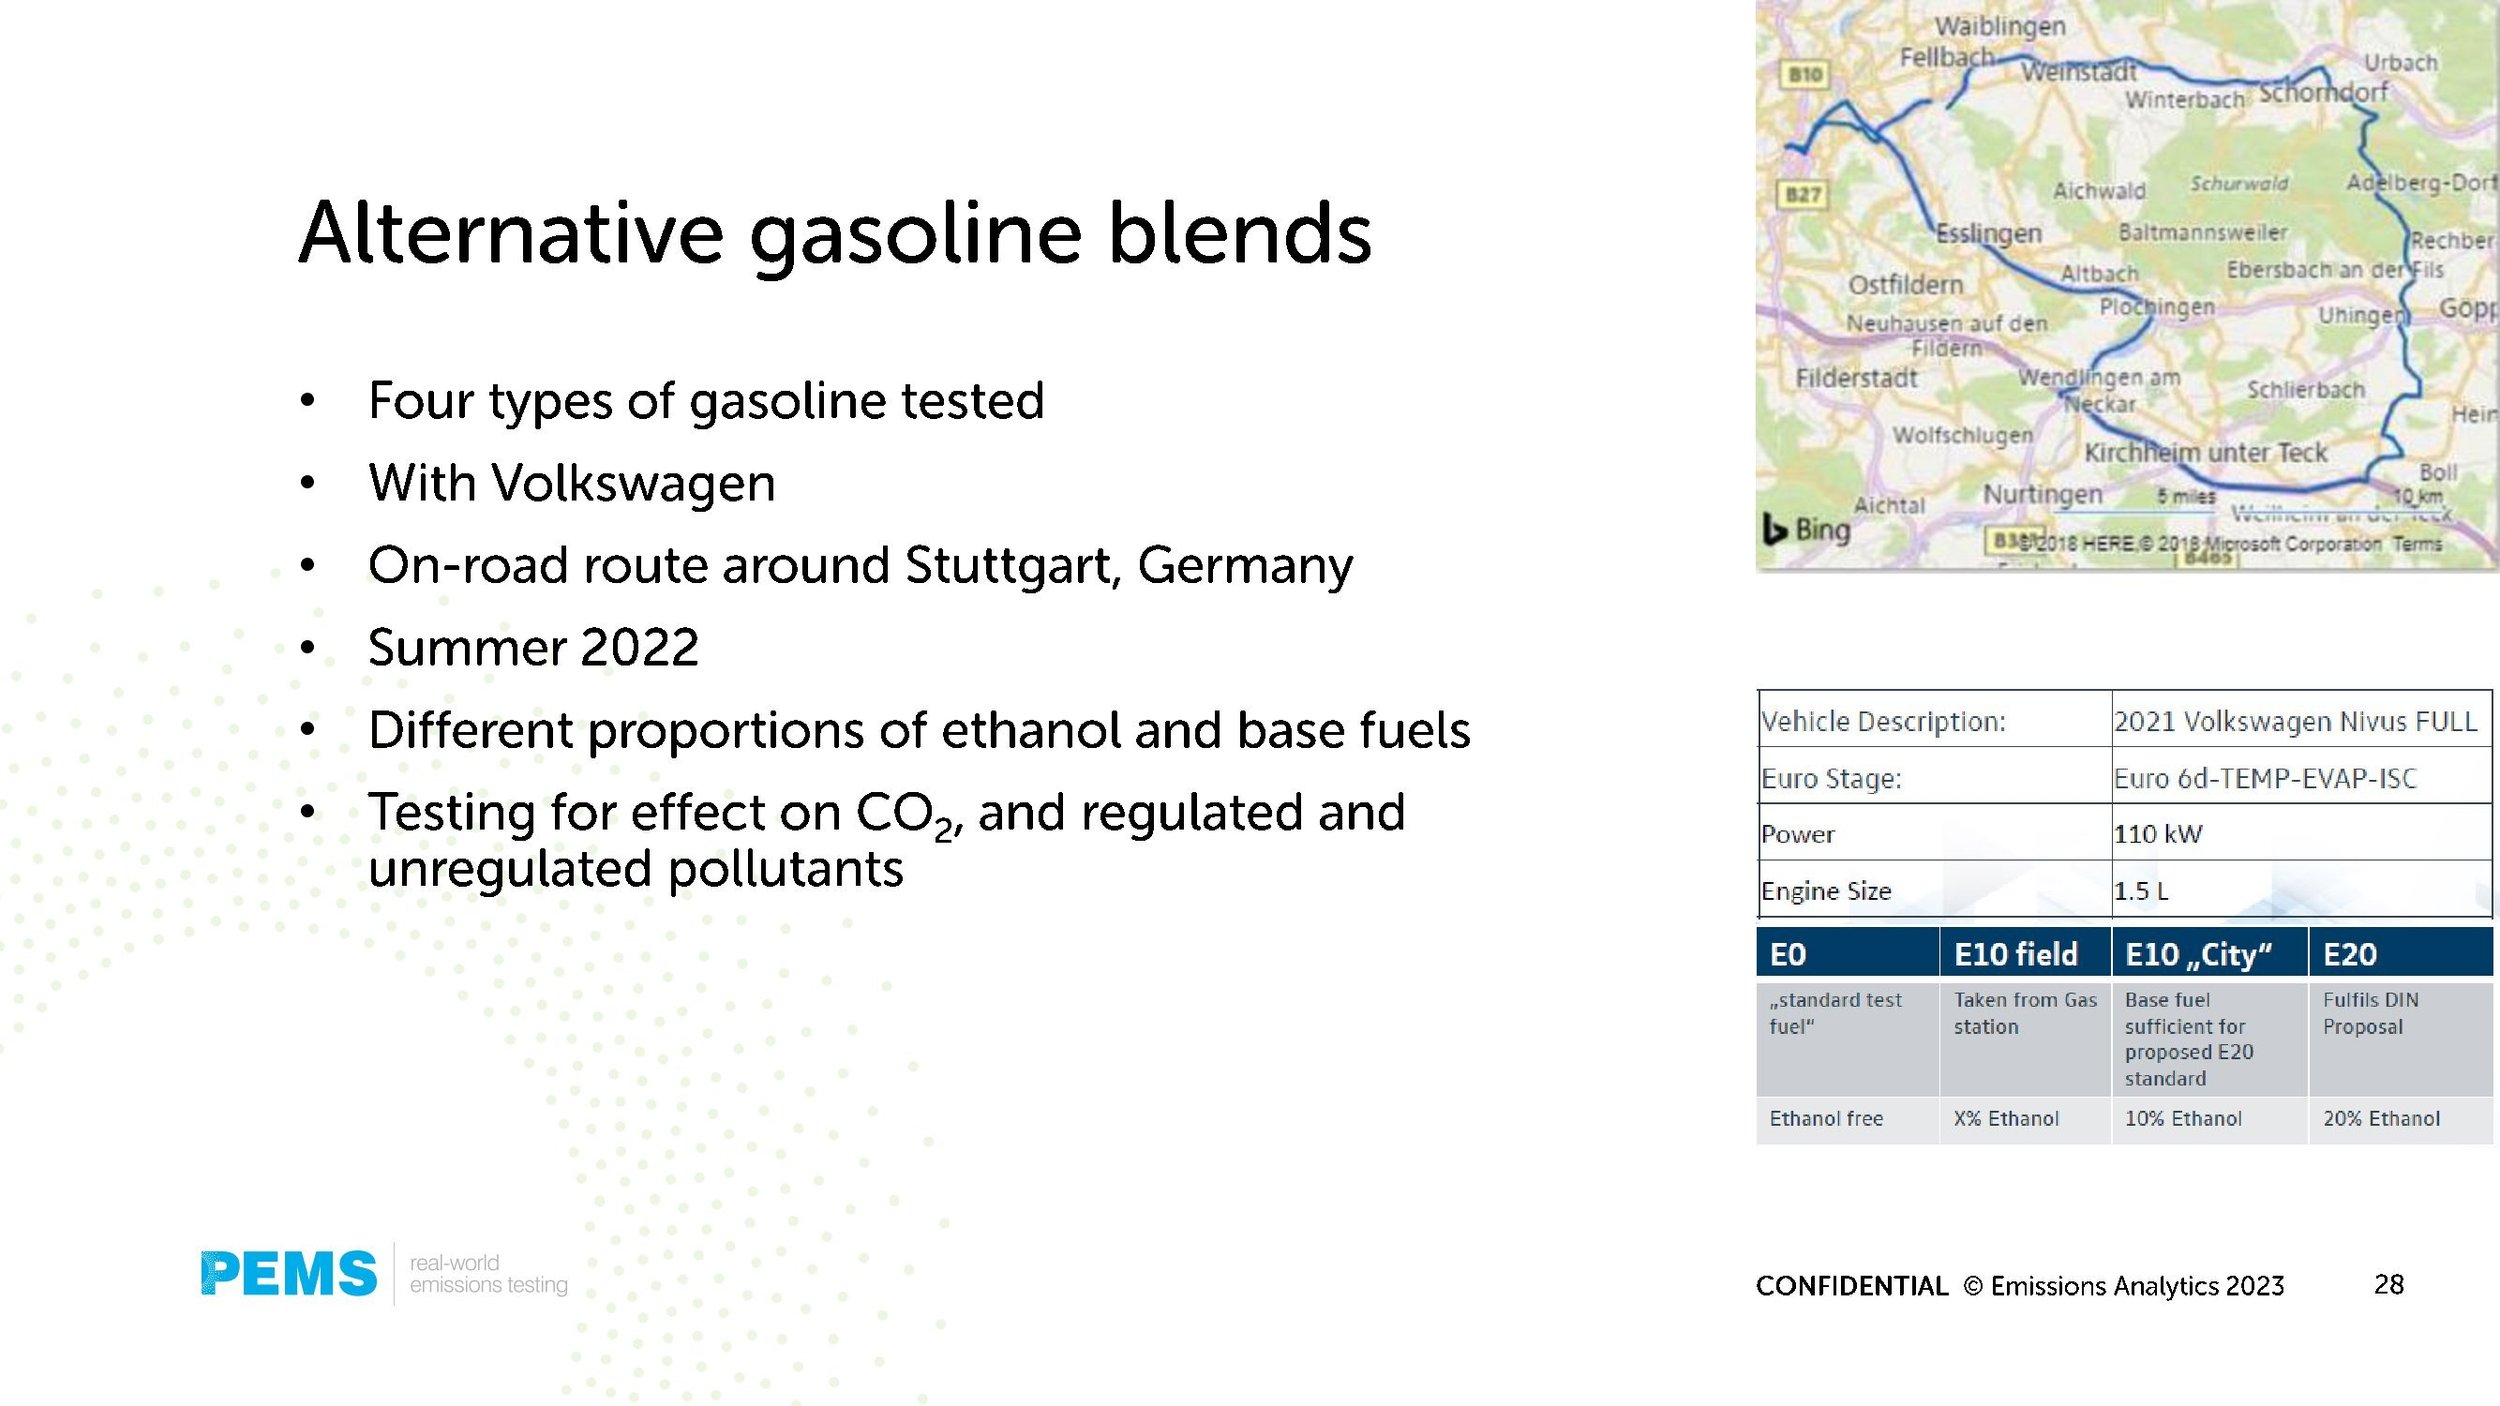
Webinar: The effects of renewable fuels on combustion emissions
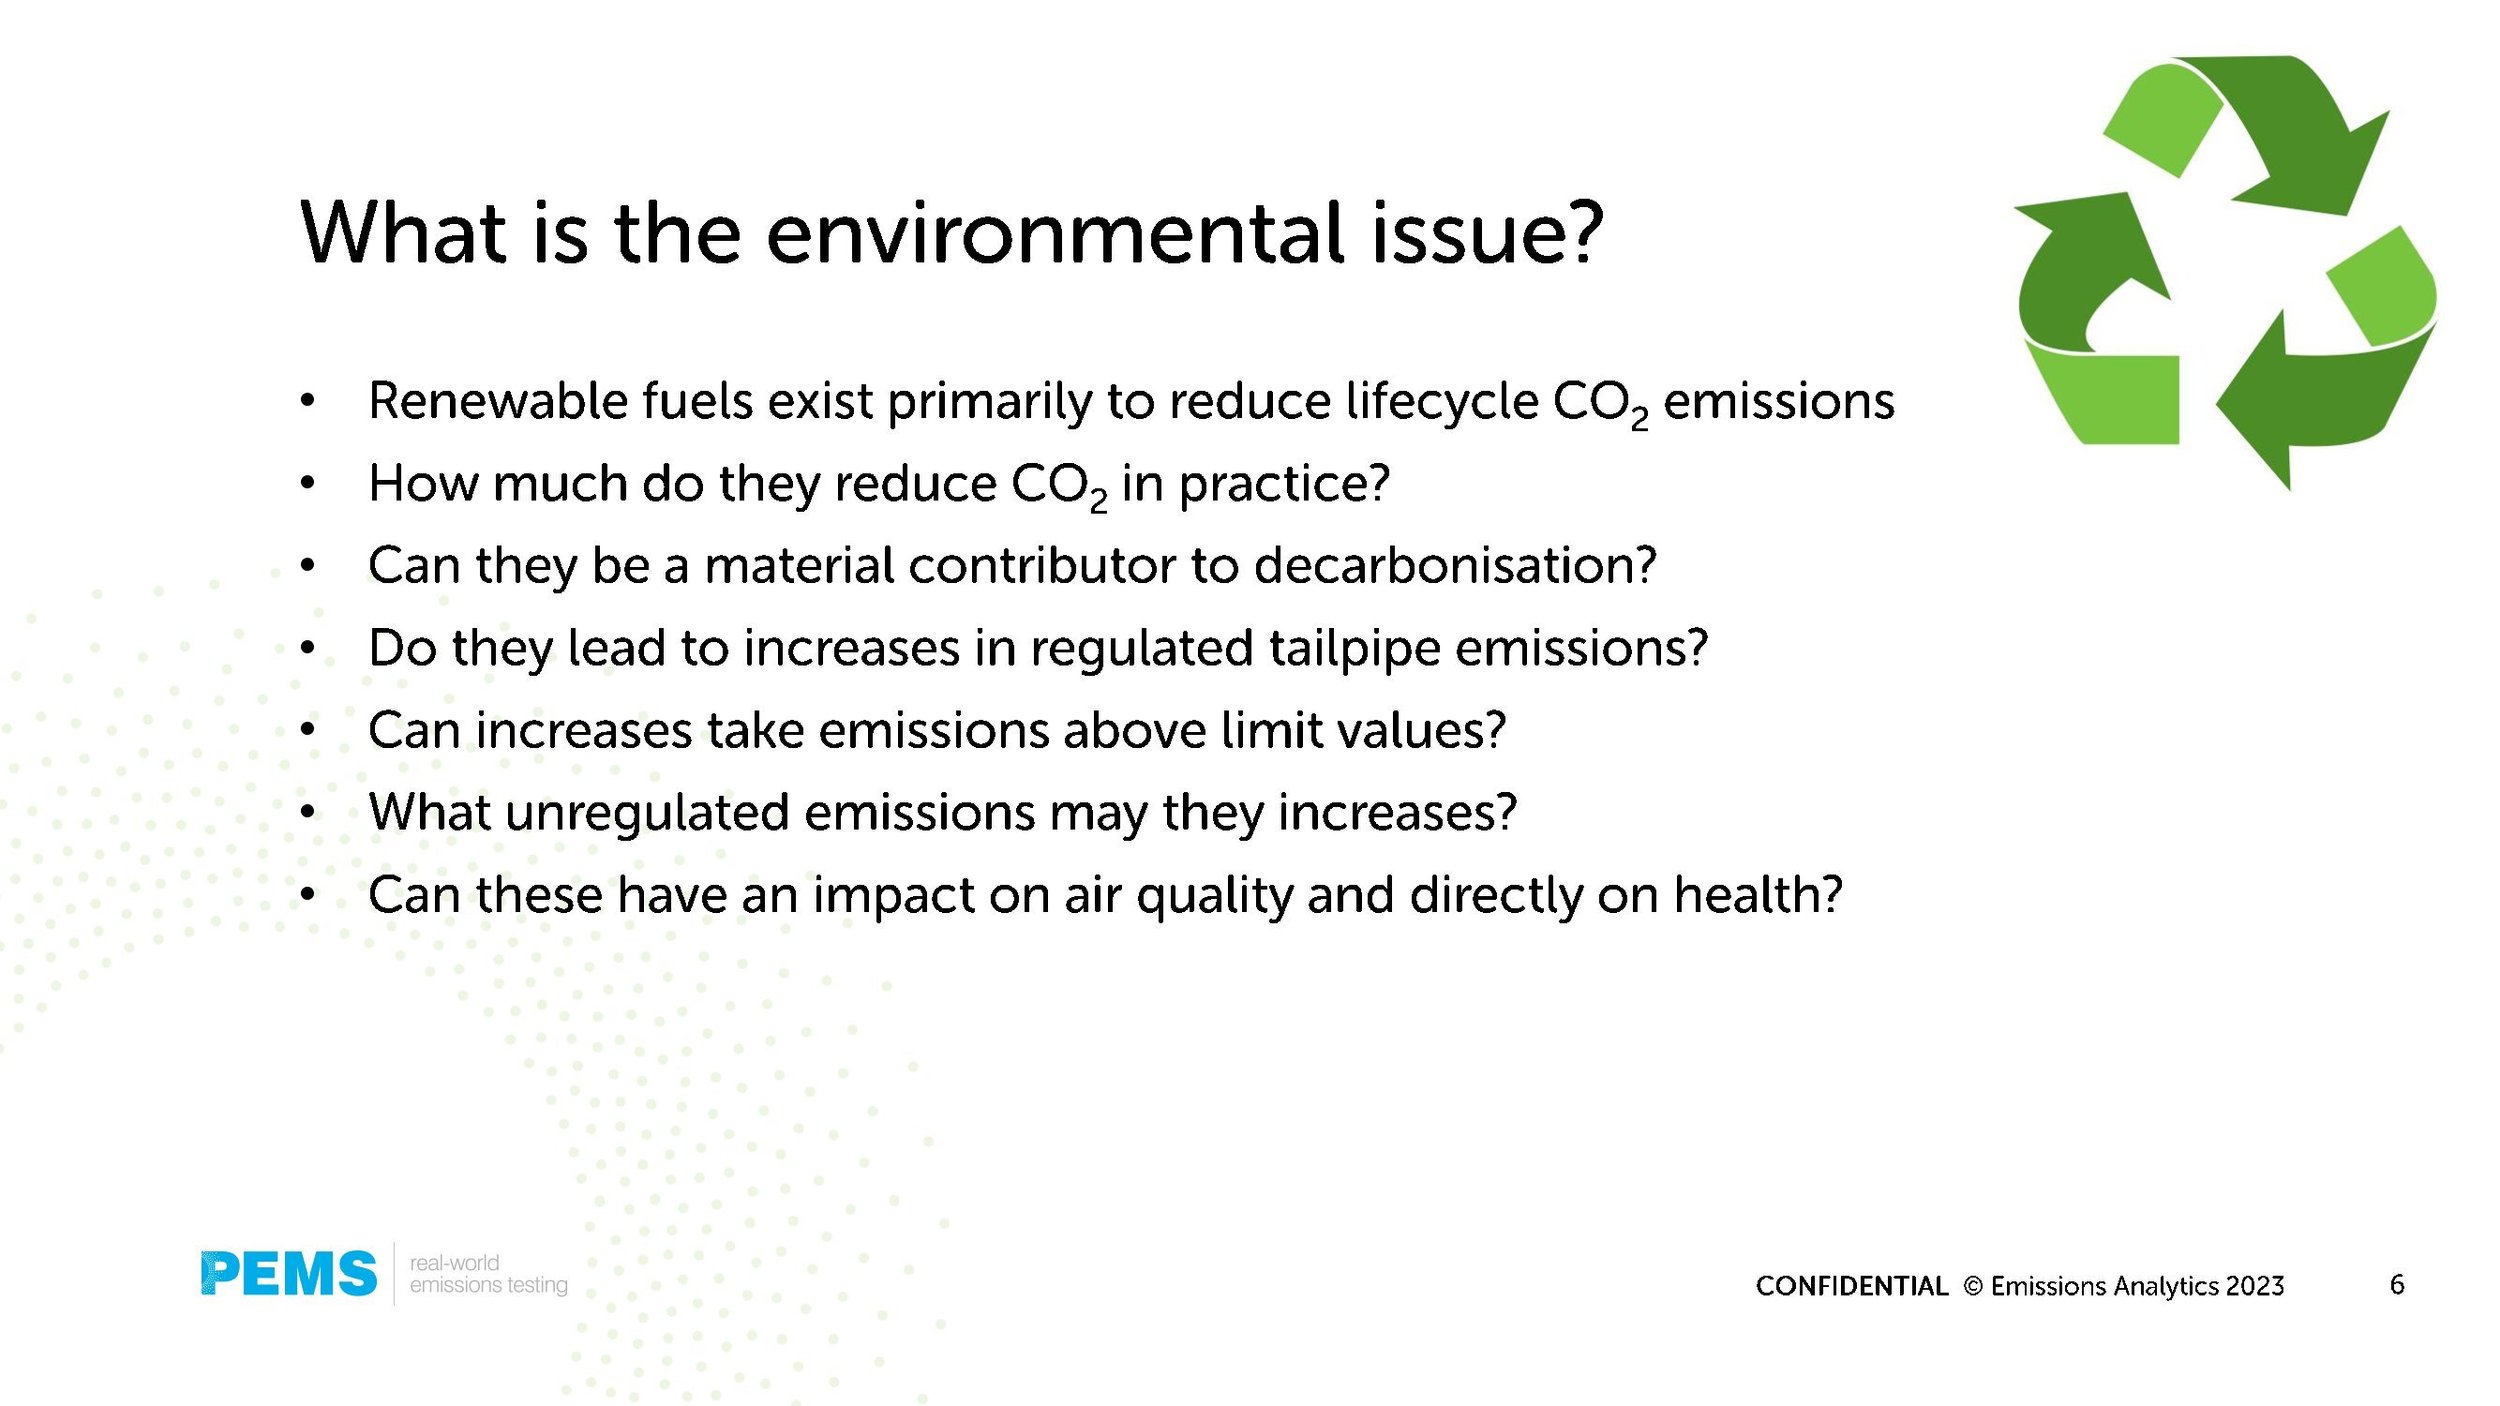
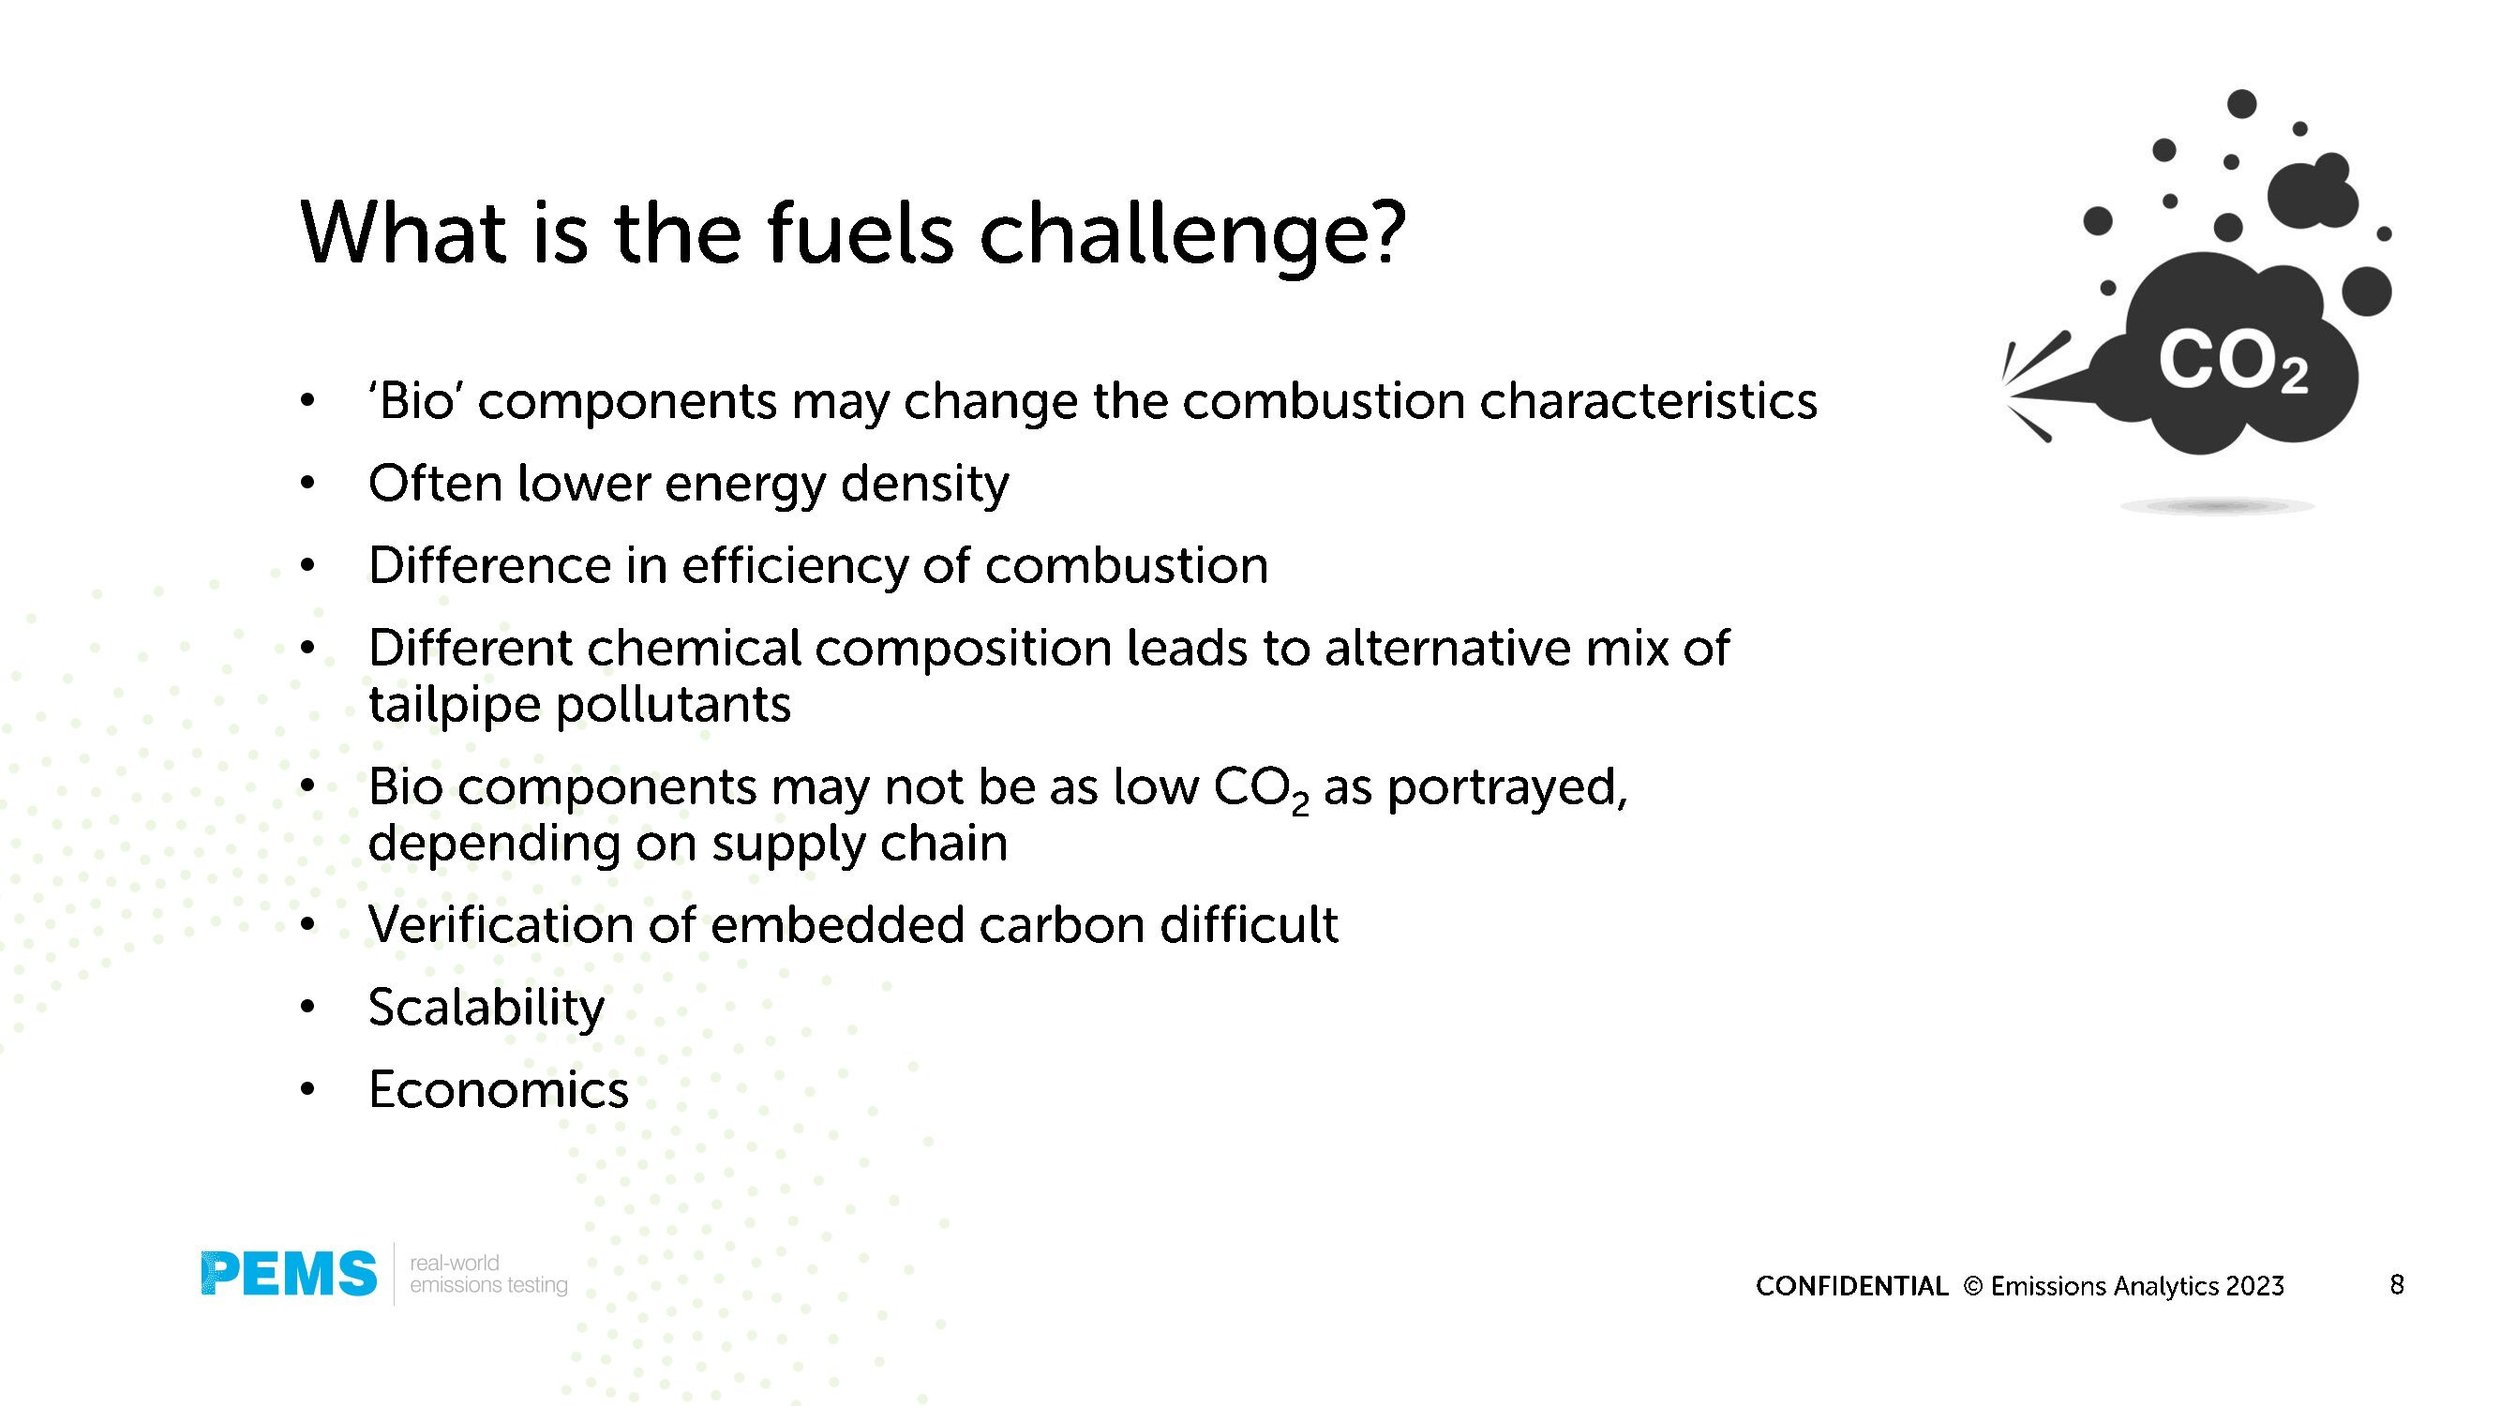
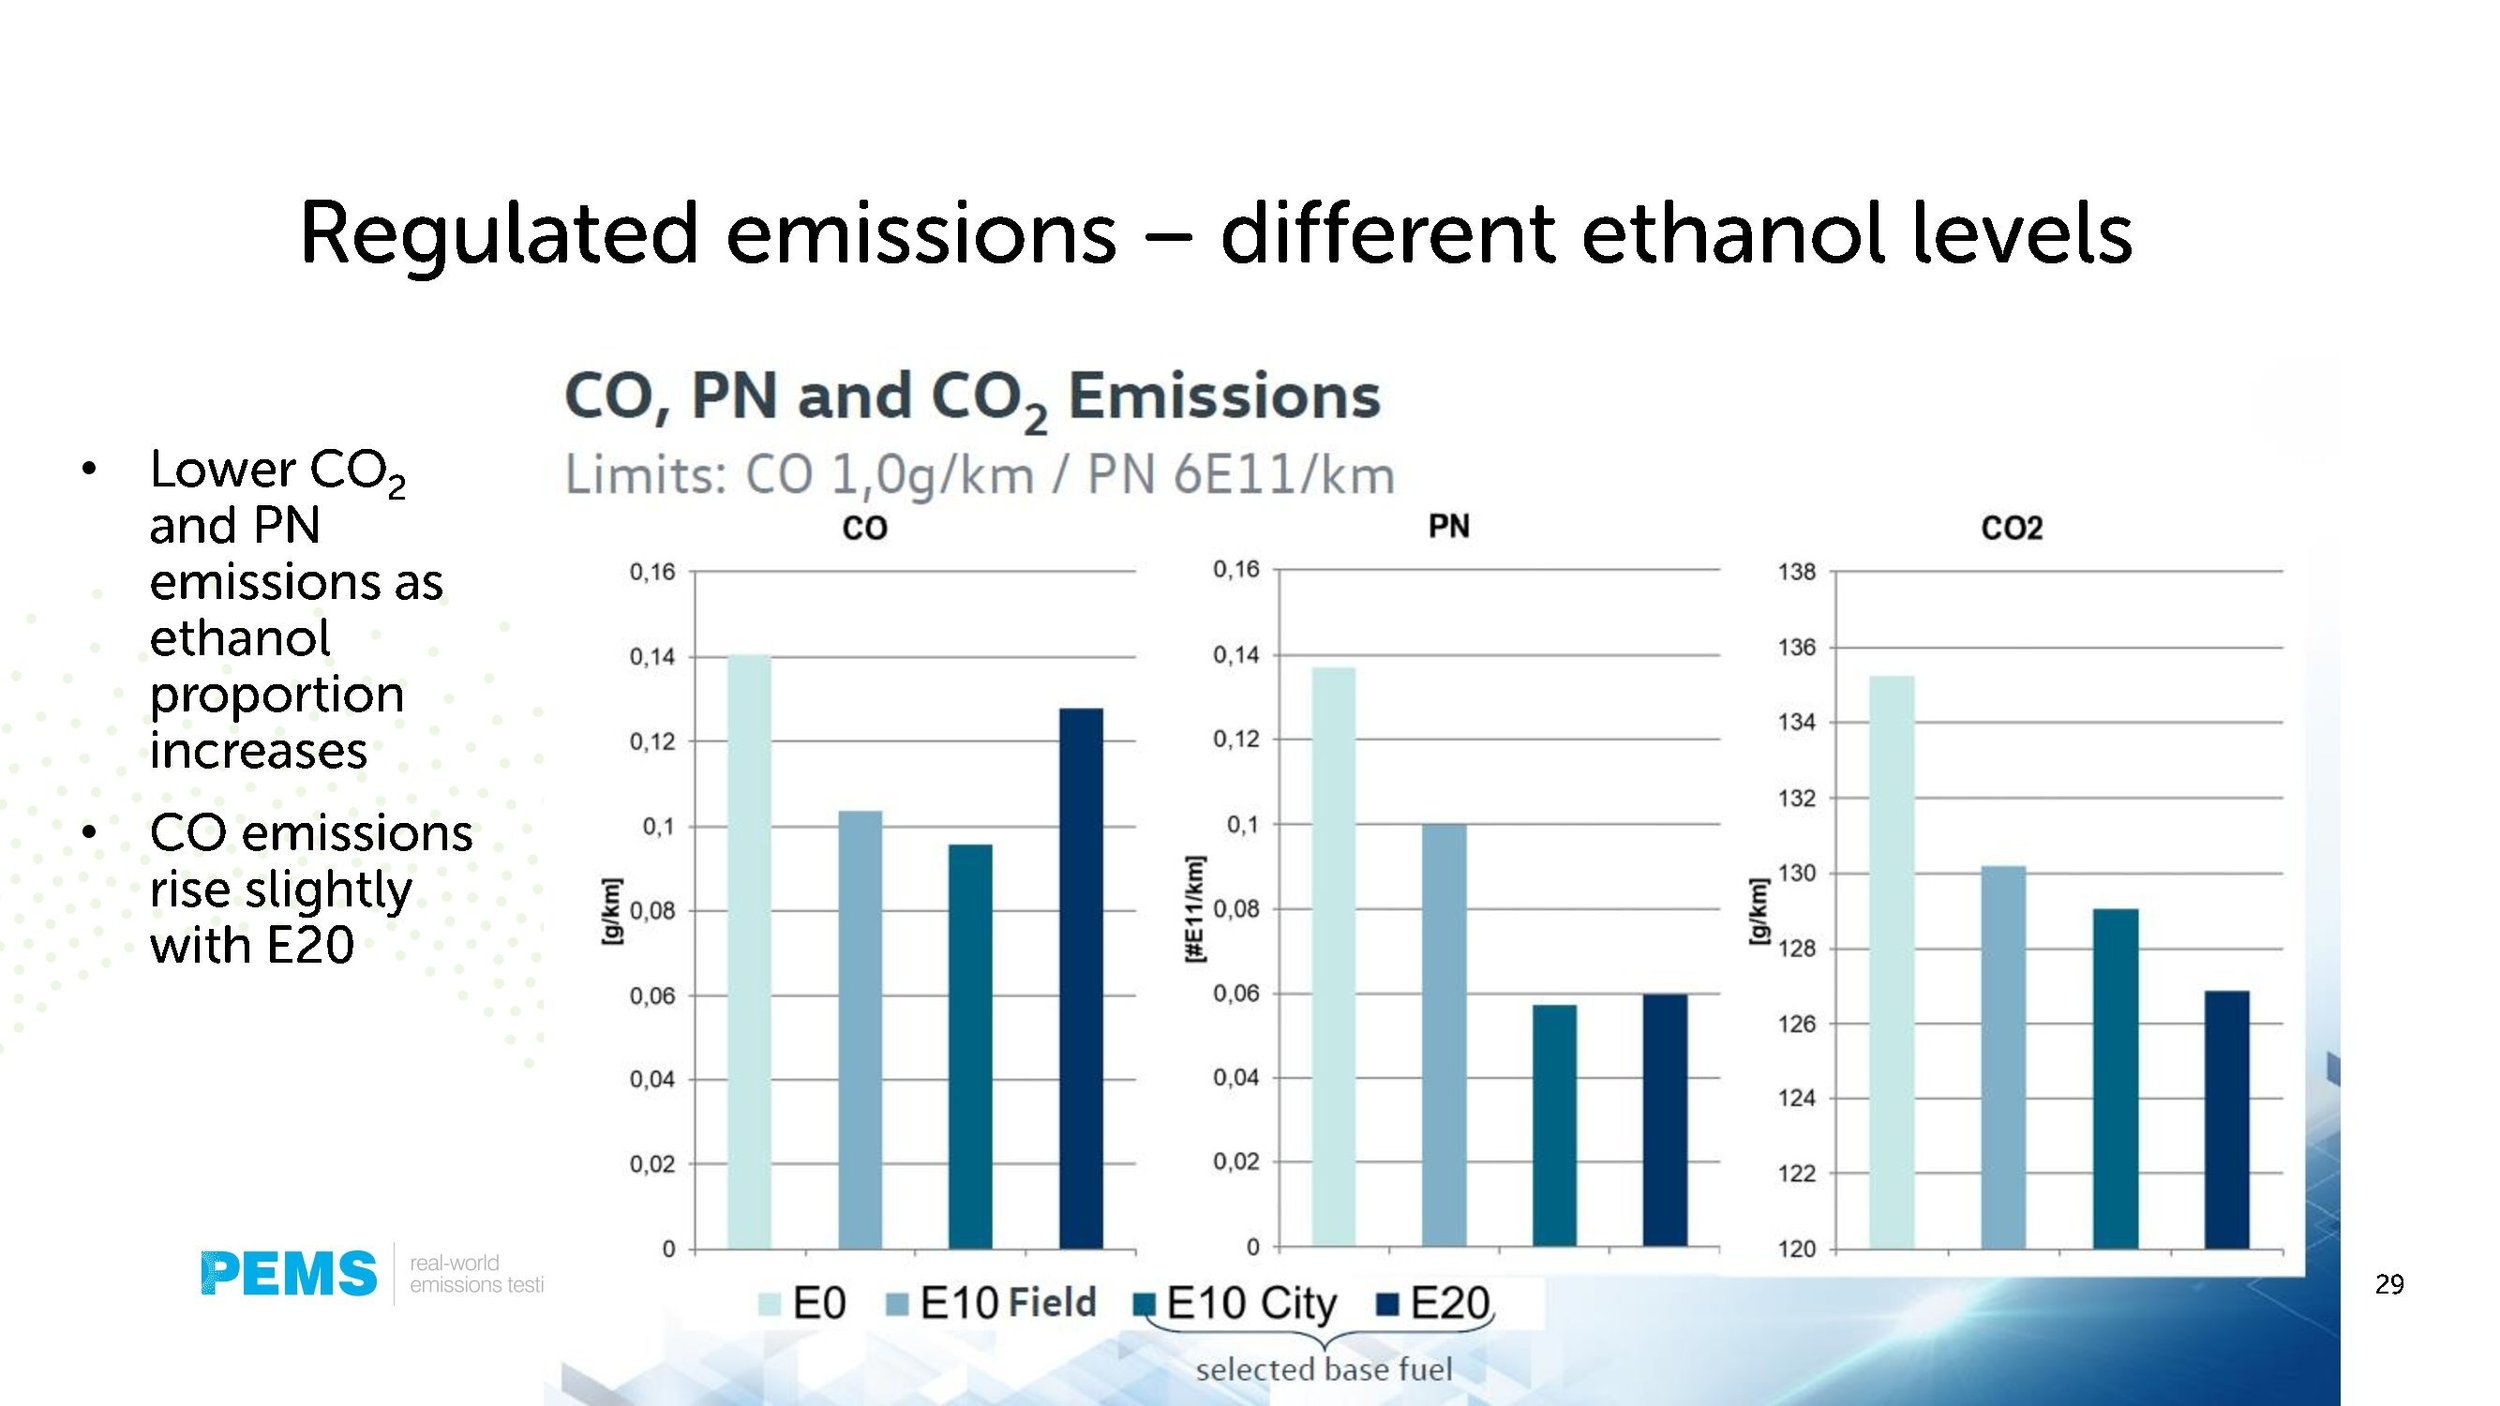
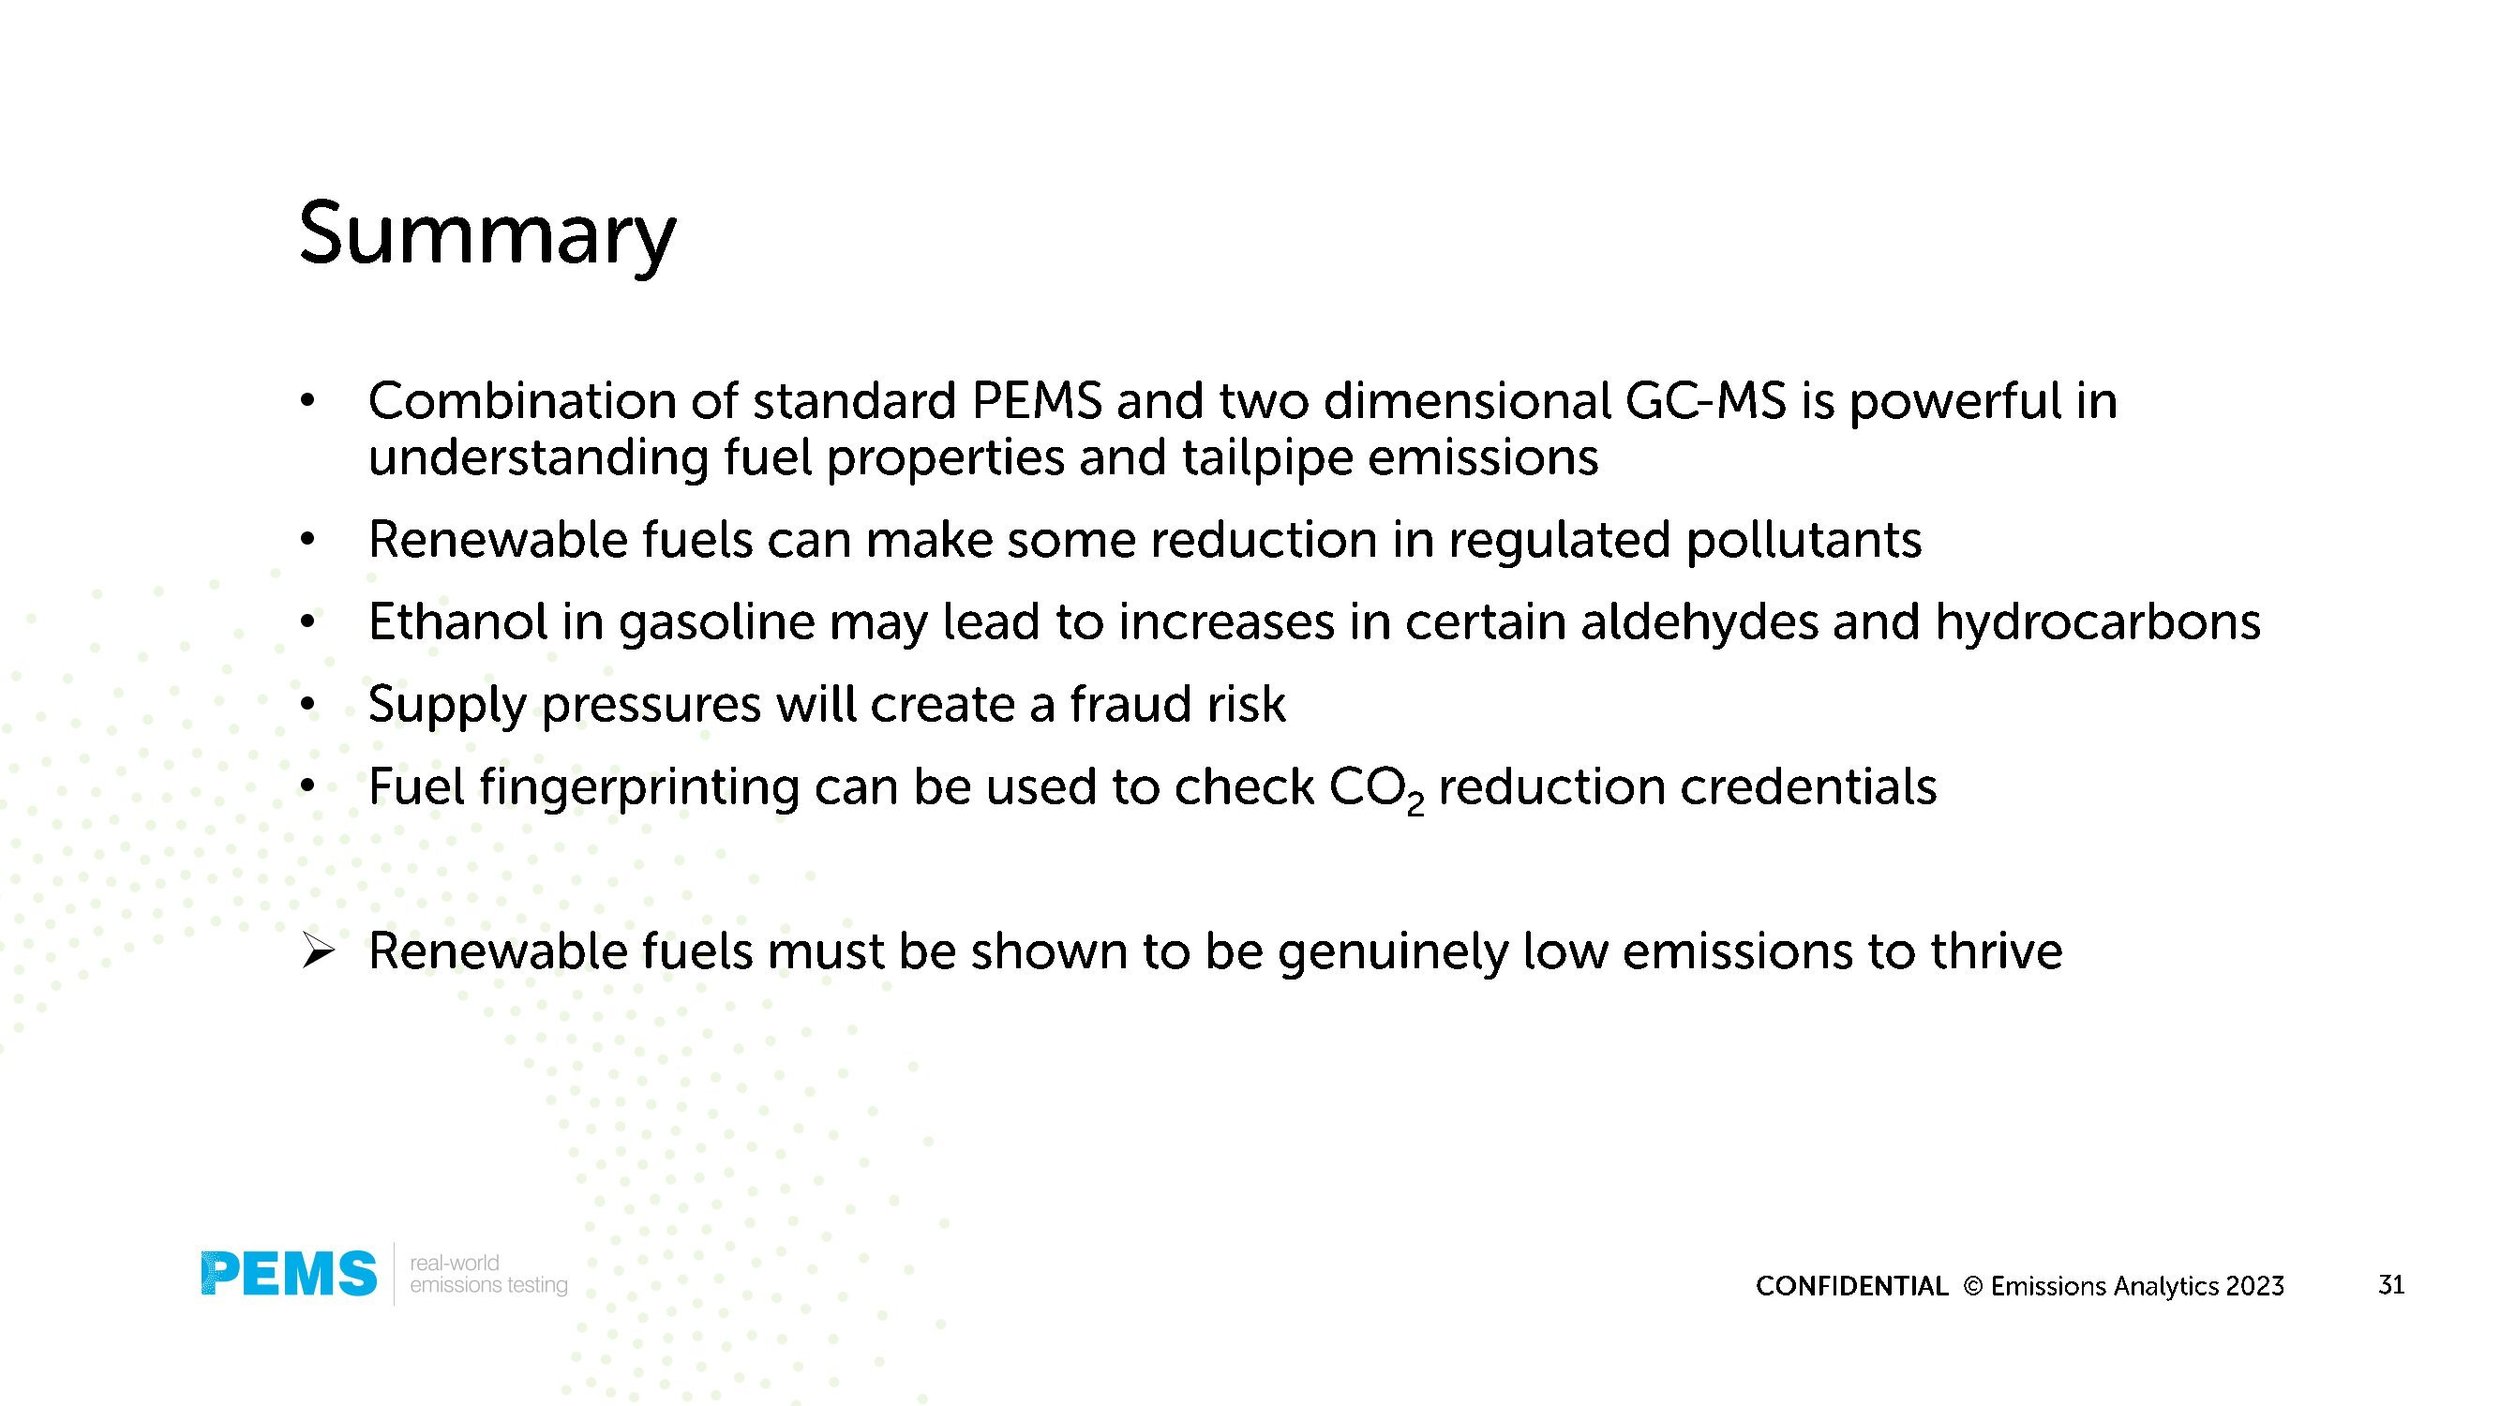
The webinar covering the latest results on the effect of renewable fuels on combustion emissions, which has been conducted together with the University of Oxford. It will look at the chemical composition of renewable fuels, consider the impact that has on tailpipe emissions, and see how well Euro 7 may capture these effects.
Our CEO & Founder, Nick Molden presented a webinar on the effects of renewable fuels on combustion emissions on 14th March 2023. To watch the webinar and download the presentation please see below.
The webinar covering the latest results on the effect of renewable fuels on combustion emissions, which has been conducted together with the University of Oxford. It will look at the chemical composition of renewable fuels, consider the impact that has on tailpipe emissions, and see how well Euro 7 may capture these effects. The presentation will cover:
Profiling the organic compounds in fuels
Using this information as a fingerprint to understand provenance
Measuring speciated organic compounds from the tailpipe in real-world driving
Results from the latest on- and off-road testing
Relationships between the chemical composition of fuel and exhaust pollutants


The septillion particle problem (literally)
That’s 1,000,000,000,000,000,000,000,000 exhaust emissions particles that are due to be emitted in the United States that don’t need to be. How? A large majority of European and Chinese cars are now sold with tailpipe particle filters, known as gasoline particulate filters (GPFs) or diesel particulate filters (DPFs) in the industry, but this is not the case in the US.
That’s 1,000,000,000,000,000,000,000,000 exhaust emissions particles that are due to be emitted in the United States that don’t need to be. How? A large majority of European and Chinese cars are now sold with tailpipe particle filters, known as gasoline particulate filters (GPFs) or diesel particulate filters (DPFs) in the industry, but this is not the case in the US. Focus on small, ‘ultrafine’ particles in the European regulations has driven gasoline exhaust filter adoption in a way that has not happened in the US, where particulate mass measurement has primacy, and effectively ignores these ultrafines.
A gasoline vehicle with a filter emits around 0.9 x 10¹¹ particles per mile (90 billion), but without a filter it is about 6.3 x 10¹¹ (630 billion), according to testing conducted by Emissions Analytics. With about 300 million internal combustion engine (ICE) vehicles likely to be on the road on average over the next ten years, each driving an average of 10,000 miles per year, that put the total number of ‘unnecessary’ particles emitted to US air to be 1.6 x 1024, or 1.6 septillion particles. If each particle were a dollar bill, the whole of the US could be carpeted over half a mile deep in money.

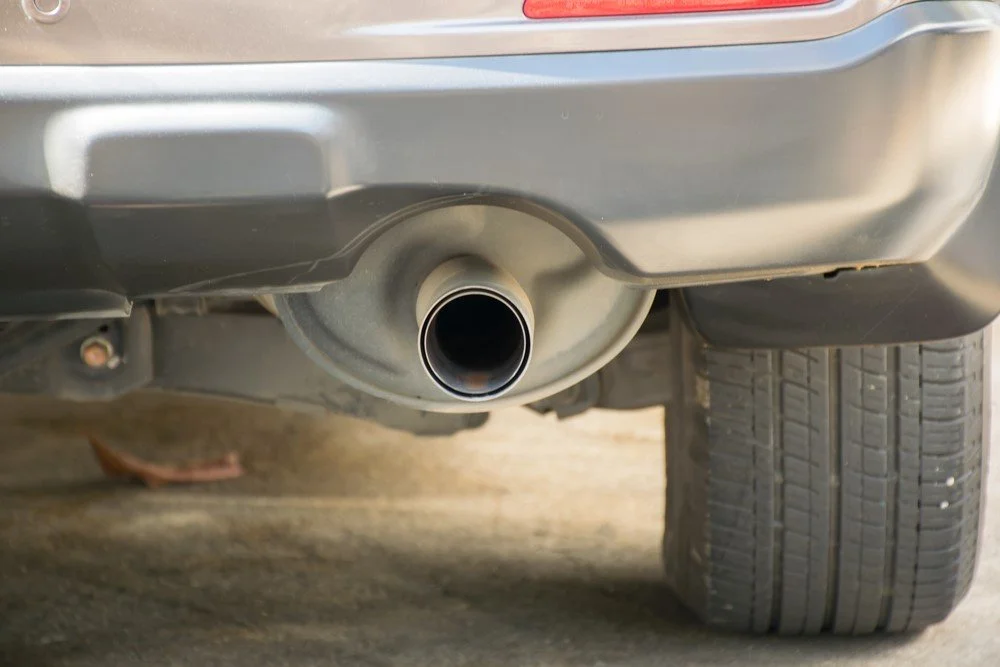
It is important, however, not to think of these particles as creating visible plumes of black smoke from the tailpipe. That is the clichéd image of exhaust particles, but that applies to older diesel vehicles without a particle filter. For gasoline vehicles, and those with a filter, the concern is for very small particles, down to 10 nm in size, which are invisible, numerous and highly mobile.
These ultrafine particles are of concern for human health, as their small size means that when inhaled they can be drawn deep into the lungs and cross the blood-brain barrier, with potential effects on cognitive development. The direct link to negative health outcomes is not generally considered as proven yet, but Europe has nevertheless regulated due to the weight of evidence and as a precaution. European particle-number-based standards have led to the widespread adoption of GPFs, which are effective at trapping these small particles. This was quickly adopted by China and India.
Even if only particle mass is concerned, on average a gasoline vehicle without a filter emits around 0.070 mg/mile, compared to a vehicle with a filter at 0.027 mg/mile. The unnecessary particle mass to be emitted in the US is therefore forecast to be over 100 tonnes over ten years. Not only does this have the understood impacts on air quality in urban areas, but observations suggest that it eventually migrates to the North and South Poles, settles on the ice, and helps accelerate climate change because of the high ‘black carbon’ content in soot, which is darker and a known global warming agent.
Some would say that this is minor or irrelevant as the light-duty fleet moves to full electrification. However, even on the most aggressive scenarios, new ICE vehicles will be sold in the US for over ten years. Those vehicles are likely to have a lifespan of around twelve years, so these vehicles could be on the road easily for 25 years from today. This does not reflect a lack of ambition in decarbonisation, but a practical reality. In the transition, there is a strong argument that we should do what we can to make ICE vehicles as clean as possible. Emissions Analytics has written extensively before that hybridisation is a better route to quick decarbonations – see a previous newsletter – and, if this position comes to pass, it could mean that hybrid vehicles are sold long after pure ICE vehicles are phased out, and these hybrids emit ultrafine particles in a similar way.
The emissions values described above are the result of programme run by Emissions Analytics in 2021 that tested apparently similar pairs of vehicles between the US (without GPFs) and Europe (with GPFs). The US vehicles were tested in Michigan, and the European vehicles in the UK. Four pairs of gasoline vehicles were tested. First, the three-litre BMW X5 was a 2019 model year in the US and 2020 in Europe. Second, there were two 2020 Jeep Wranglers with a 2.0 litre engine. Third, the full hybrid Toyota RAV4s were 2019 model year with the 2.5 litre engine. Finally, the 2020 1.5 litre Ford engine was tested in the Escape in the US and its equivalent Kuga model in Europe. These vehicles were drawn from different manufacturers and where the models were near-identical in technical specification and model year between the two regions. That said, in each case, the Europe vehicle was equipped with a GPF, while the US vehicle was not.
Each vehicle was then tested on similar on-road routes in the two countries to allow the comparison of their particle mass and number emissions. The gas emissions and particle number were measured using a regulatory-approved portable emissions measurement system (PEMS) from Sensors, Inc, together with a diffusion charger for particle mass measurement. Similar on-road routes were designed in both locations, which, despite the inevitably different traffic and ambient conditions, were shown to have similar dynamics overall. The average emissions across the four pairs of vehicles are shown in the charts below.


The results were highly consistent between the four vehicles. They were also consistent between different types of driving, from urban cold start to highway warm start. The table shows that the average reduction in particle number was 86% across the different vehicles and driving. The variation was from 76% to 96% – in all cases, the reduction was impressive. As the vehicle specifications were near-identical in other respects, it is very likely that the improvement is due to the GPF. While there were some differences in the chemical composition of the standard pump fuel used in both locations, this would not account for a significant proportion of this reduction.
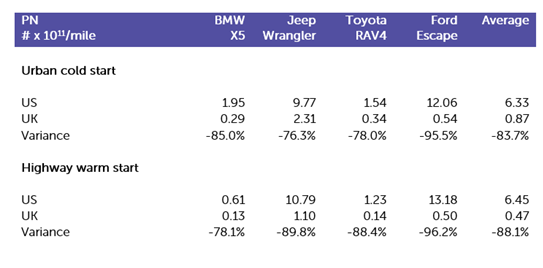
The equivalent overall particle mass reduction was lower but still impressive at 55%, with 81% reduction on the highway. Despite this positive performance, the question remains as to whether the benefit in improved air quality is worth the extra cost. A GPF system typically costs less than $200, which is about the same cost as the optional carpet mats on the BMW X5. Therefore, the cost for removing every billion particles emitted into the air is just 0.0004 cents. In addition to this, there is the further potential benefit of removing particles from the air that have come from other sources. As Emissions Analytics has shown in another newsletter, diesel particulate filters (DPFs) can ‘clean’ the air as the vehicle drives. GPFs are now achieving filtration efficiency rates – typically 80%, with the next generation of GPFs for Euro 7 regulations likely to exceed 95% – that are getting close to those of DPFs, and so the same net-cleaning effect can be expected. Moreover, the filtration efficiency tends to improve with the age of the filter, so the positive effect, if anything, grows.
The septillion particles mentioned above may even underestimate the potential for emissions reduction. The numbers are based on a rapid transition to full battery electric vehicles (BEVs), with no tailpipe emissions. However, this transition may not be as fast as anticipated, which would mean more ICEs for longer. Widespread installation of GPFs would, therefore, generate greater benefits over a longer period. But even as BEVs take off, there is growing evidence that they emit more tire wear emissions that ICE vehicles due to their increased weight. Emissions Analytics’ tests showed a 21% increase in tire particle mass emissions for 500 kg extra vehicle mass – roughly equivalent to the mass of a large battery pack – although this may be partially offset by the effect of regeneration breaking. More generally, there is an on-going trend towards heavier vehicles of all types, which increases tire emissions. Even though only 10-20% of tire wear emissions hang in the air, GPFs could have the added benefit of removing these particles from the air. In other words, ‘legacy’ ICE vehicles could help clean up emissions from BEVs.
Put another way, GPFs bring direct value, but also have an important ‘insurance’ effect that ensures there is benefit however the vehicle car parc evolves.

With filters on gasoline cars in Europe and China, and even coming soon to India, it is surprising that most new car sales in the world's second largest car market are not equipped with the best available technology for emissions reduction. There are signs that this might change, however. Even if US regulators do not embrace particle number as a measure that should be regulated, the potential reduction of the particle mass limit to 1 mg/mile at normal and cold temperatures (20°F or -7°C) might enable cleaner air in the US with widespread deployment of GPFs.
Few things in emissions control are a no-brainer. Mostly, awkward trade-offs between cost, vehicle utility and emissions reduction have to be resolved. In this case, the benefits appear high, costs relatively low, and risk minimal.
Credits: BMW VX images from BMW and www.thecarconnection.com.
Presentation: PEMS Conference
Our CEO & Founder, Nick Molden recently spoke at the annual CRC Real World Emissions Workshop.
Our CEO & Founder, Nick Molden recently spoke at the 11th Annual International PEMS Conference.
PEMS2022: Moving Towards Onboard Sensing, Analysis, and Reporting (OSAR) in California on the 17th March 2022
In this presentation, Nick discusses: Tailpipe emissions measurements.


The inevitability of hybridisation?
While the direction of vehicle powertrain policy and strategy is firmly oriented towards full battery electric vehicles (BEVs), the results of Emissions Analytics’ latest testing and lifecycle modelling suggests that hybridisation may prove to be the dominant outcome, whether intended or not.
While the direction of vehicle powertrain policy and strategy is firmly oriented towards full battery electric vehicles (BEVs), the results of Emissions Analytics’ latest testing and lifecycle modelling suggests that hybridisation may prove to be the dominant outcome, whether intended or not. As real-world emissions results collide with consumer preference and fiscal reality, the efficiency of hybrids in reducing carbon dioxide (CO2) emissions is likely to shine through over the next decade, even if BEVs and other new technologies come to dominate in the longer-term.
Put another way, at the moment it appears that battery electric vehicles (BEVs) are neither sufficiently clean nor a strong enough consumer proposition to achieve mass adoption without significant subsidy. They are certainly not zero emission, not least due to the construction process and tyre wear emissions. Hybrids, in contrast, reduce tailpipe CO2 emissions materially now – albeit somewhat less than BEVs – and have few utility disadvantages for consumers. Therefore, would it be optimal to follow a hybridisation strategy for, say, the next ten years and then segue to BEVs after that, once they are cleaner and have fewer consumer disadvantages?

The typical objection to this is that BEVs already in the fleet will automatically become cleaner as the grid decarbonises. While this is true, the greatest source of CO2 from BEVs is in the manufacture, which is fixed and incurred upfront. Therefore, every BEV manufactured now may crystallise enough CO2 today to outweigh the subsequently lower CO2 of operation, compared to typical hybrid vehicles.
Taking the latest sales figures for new cars from the UK’s Society of Motor Manufacturers and Traders (SMMT), and putting them together with recent test results for exhaust and non-exhaust emissions from Emissions Analytics, it possible to evaluate the progress in decarbonisation.
Before turning to CO2, it can immediately be seen that BEVs deliver little overall advantage for air quality. While NOx emissions remain positive for internal combustion engines (ICEs), the levels are significantly lower than for earlier models. This is true to the extent that, if the car fleet were made up entirely of these latest diesel and gasoline cars, there would be no air quality legal violations. For particle mass emissions, exhaust filters on ICEs typically reduce emissions to less than 1 mg/km. In contrast, tyre emissions from ICEs are around 32 mg/km over a lifetime, whereas the BEV tyre wear rate – other things being equal – are 21% higher at 38 mg/km. Adding exhaust and non-exhaust emissions together, BEVs are slightly higher emitting than ICEs and full hybrid electric vehicles (FHEVs).
With BEVs not required for air quality compliance, their primary environmental purpose is CO2 reduction. The table below estimates the CO2 emissions saved compared to the benchmark gasoline ICE for each alternative powertrain, based on 16,000 km of annual driving and the latest market shares of each. The greatest aggregate CO2 reduction is from BEVs, which have 8.4% market share. Hybrids, collectively, with 34.0% market share, account for around three-quarters of the reduction of BEVs.

These BEVs include around 5.5 million kWh of battery capacity, compared to 1.0 million kWh in all the hybrids together. Therefore, for every kWh of battery capacity, BEVs delivered 3.0 g/km of CO2 reduction, compared to 13.7 g/km for hybrids, both judged against the gasoline ICE benchmark. In other words, hybrids have been 4.6 times more efficient at reducing CO2 as a function of the currently constrained battery material supply.
Had the battery material from the 92,420 BEVs sold been used in hybrids – assuming average battery capacities of 60 kWh and 2.6 kWh respectively – an additional 2.1 million hybrids could have been built, enough to cover all new cars sold in the whole of 2021 in the UK. In that hypothetical scenario, the CO2 reduction from the annual operation of the hybrid vehicles would be 940 kilotonnes greater than from the BEVs.
To analyse more fundamentally the differences between the powertrains, it is necessary to consider lifecycle CO2 emissions, including vehicle manufacture, operation and end-of-life processing. To that end, Emissions Analytics has developed its own proprietary model; for the purposes of this analysis the key assumptions are:
15-year, 175 km vehicle lifespan
60 kWh BEV battery size
150 kg/kWh of CO2 in battery production
300 g/kWh of CO2 for BEV charging.
Considering the cumulative CO2 emissions to 2070, it is possible to compare six different scenarios as shown in the table below. The three powertrain scenarios are an ICE-led baseline, a direct migration to BEVs, and an interim switch to FHEVs until 2030 and then migration to BEVs. Each of these scenarios has two versions: one calculated based on current CO2 intensity of electricity generation and BEV manufacture, the other with that intensity reducing by 50% from 2030.

The reason for BEVs being hardly better than FHEVs on current CO2 intensity is that the manufacture emissions of the vehicle and battery are still relatively high, and the average grid electricity across Europe still includes significant gas and coal.
Therefore, we can deliver an extra 8% point reduction in CO2 compared to the baseline by switching straight to BEVs, if a 50% reduction in CO2 intensity is achieved from 2030. According to the fifth carbon budget under the UK’s Climate Change Act, the country can emit 1,725 million tonnes of CO2-equivalent between 2028 and 2032. The added benefit given by the direct migration to BEVs is over 10% of that carbon budget – which demonstrates how every percentage point of reduction in CO2 is important.
On the surface of this analysis, BEVs look like the optimal strategy, even though the gap to the FHEV strategy is closer than reported elsewhere. However, this neglects consideration of risk. Rolling out hybrids would be relatively low risk due to limited resource requirements, consumer resistance and taxpayer subsidy requirement. Furthermore, the BEV estimates of CO2 reduction are sensitive to many factors, including:
Speed and degree of decarbonisation of battery and vehicle manufacture
Speed and degree of decarbonisation of the grid
Improvements in battery energy capacity and therefore vehicle range
Longevity of batteries and BEVs as a whole
Geopolitical security around scarce battery materials
Environmental and ethical issues around mining
Degree to which vehicle miles travelled in BEVs replace ICE miles, or are additive due to the lower marginal cost
Ability to develop a transparent and standardised lifecycle model to be able objectively to verify CO2 reduction claims.
Each of these could have a material impact on the analysis and resulting CO2 reduction, both positively and negatively. However, as high-certainty methods of CO2 reduction are a pressing policy need, it may be better to ‘bank’ the lower-risk 24% reduction from ten years of hybrids, and then migrate to BEVs and other lower-CO2 powertrains.
Returning to the topic of currently scarce battery materials, the FHEV strategy requires 39 GWh of battery capacity for vehicles sold in the ten years to 2030. In contrast, the BEV strategy requires 570 GWh, or 15 times more. From a practical, ethical and geopolitical point of view, this is significant.
There is, further, a paradox with BEVs: once bought, from a CO2 point of view it makes sense to drive them a lot so the embedded emissions in the construction can be amortised across the maximum usage. It may even be better to drive incremental miles in the car rather on some forms of public transport. This is, therefore, linked to the question of taxing BEVs such there are no perverse incentives to drive on the road more, and creating replacement revenues for the declining taxes on gasoline and diesel.
Putting together this rate of CO2 reduction and the current utility compromises, it suggests that BEVs are not yet good enough value a product to get rapid adoption without significant subsidy. With new internal combustion engines now sufficiently clean that they are not contributing to air quality violations and the readily available alternative in hybrids, it appears that the optimal policy is to concentrate on them for the coming years while BEVs and other low-CO2 powertrains get ready for mass adoption. Greater competition would be good for consumers in the long term, especially where greater proportions of the added value in the vehicles arise domestically, whatever the country. Vast sums of taxpayer subsidy – billions, if not tens over billions, of pounds over time – could also be avoided.

Failing this, it is likely that we end up at hybridisation by another route: at the household level. This is because consumers may hold on to old ICEs to cover longer journeys, heavier payloads, sporty driving and the like. These older vehicles may also have higher NOx emissions, being Euro 6 prior to the introduction of Real Driving Emissions, or earlier. Governments may try to force these off the road through higher taxation, but this is unlikely to work as the low depreciation rates of these older vehicles will make for cheap motoring in almost any scenario.
In summary, surely it would be better to take the pragmatic route and hybridise everything as soon as possible?
This conclusion is not dissimilar from that articulated in a facsheet from the International Council on Clean Transportation in July 2021, which said, "Hybridization can be utilized to reduce the fuel consumption of new internal combustion engine vehicles registered over the next decade, but neither HEVs nor PHEVs provide the magnitude of reduction in GHG emissions needed in the long term."
But, the numbers suggest we replace "can" with "should", to lock in the CO2 savings now.

The rise of unregulated exhaust pollutants
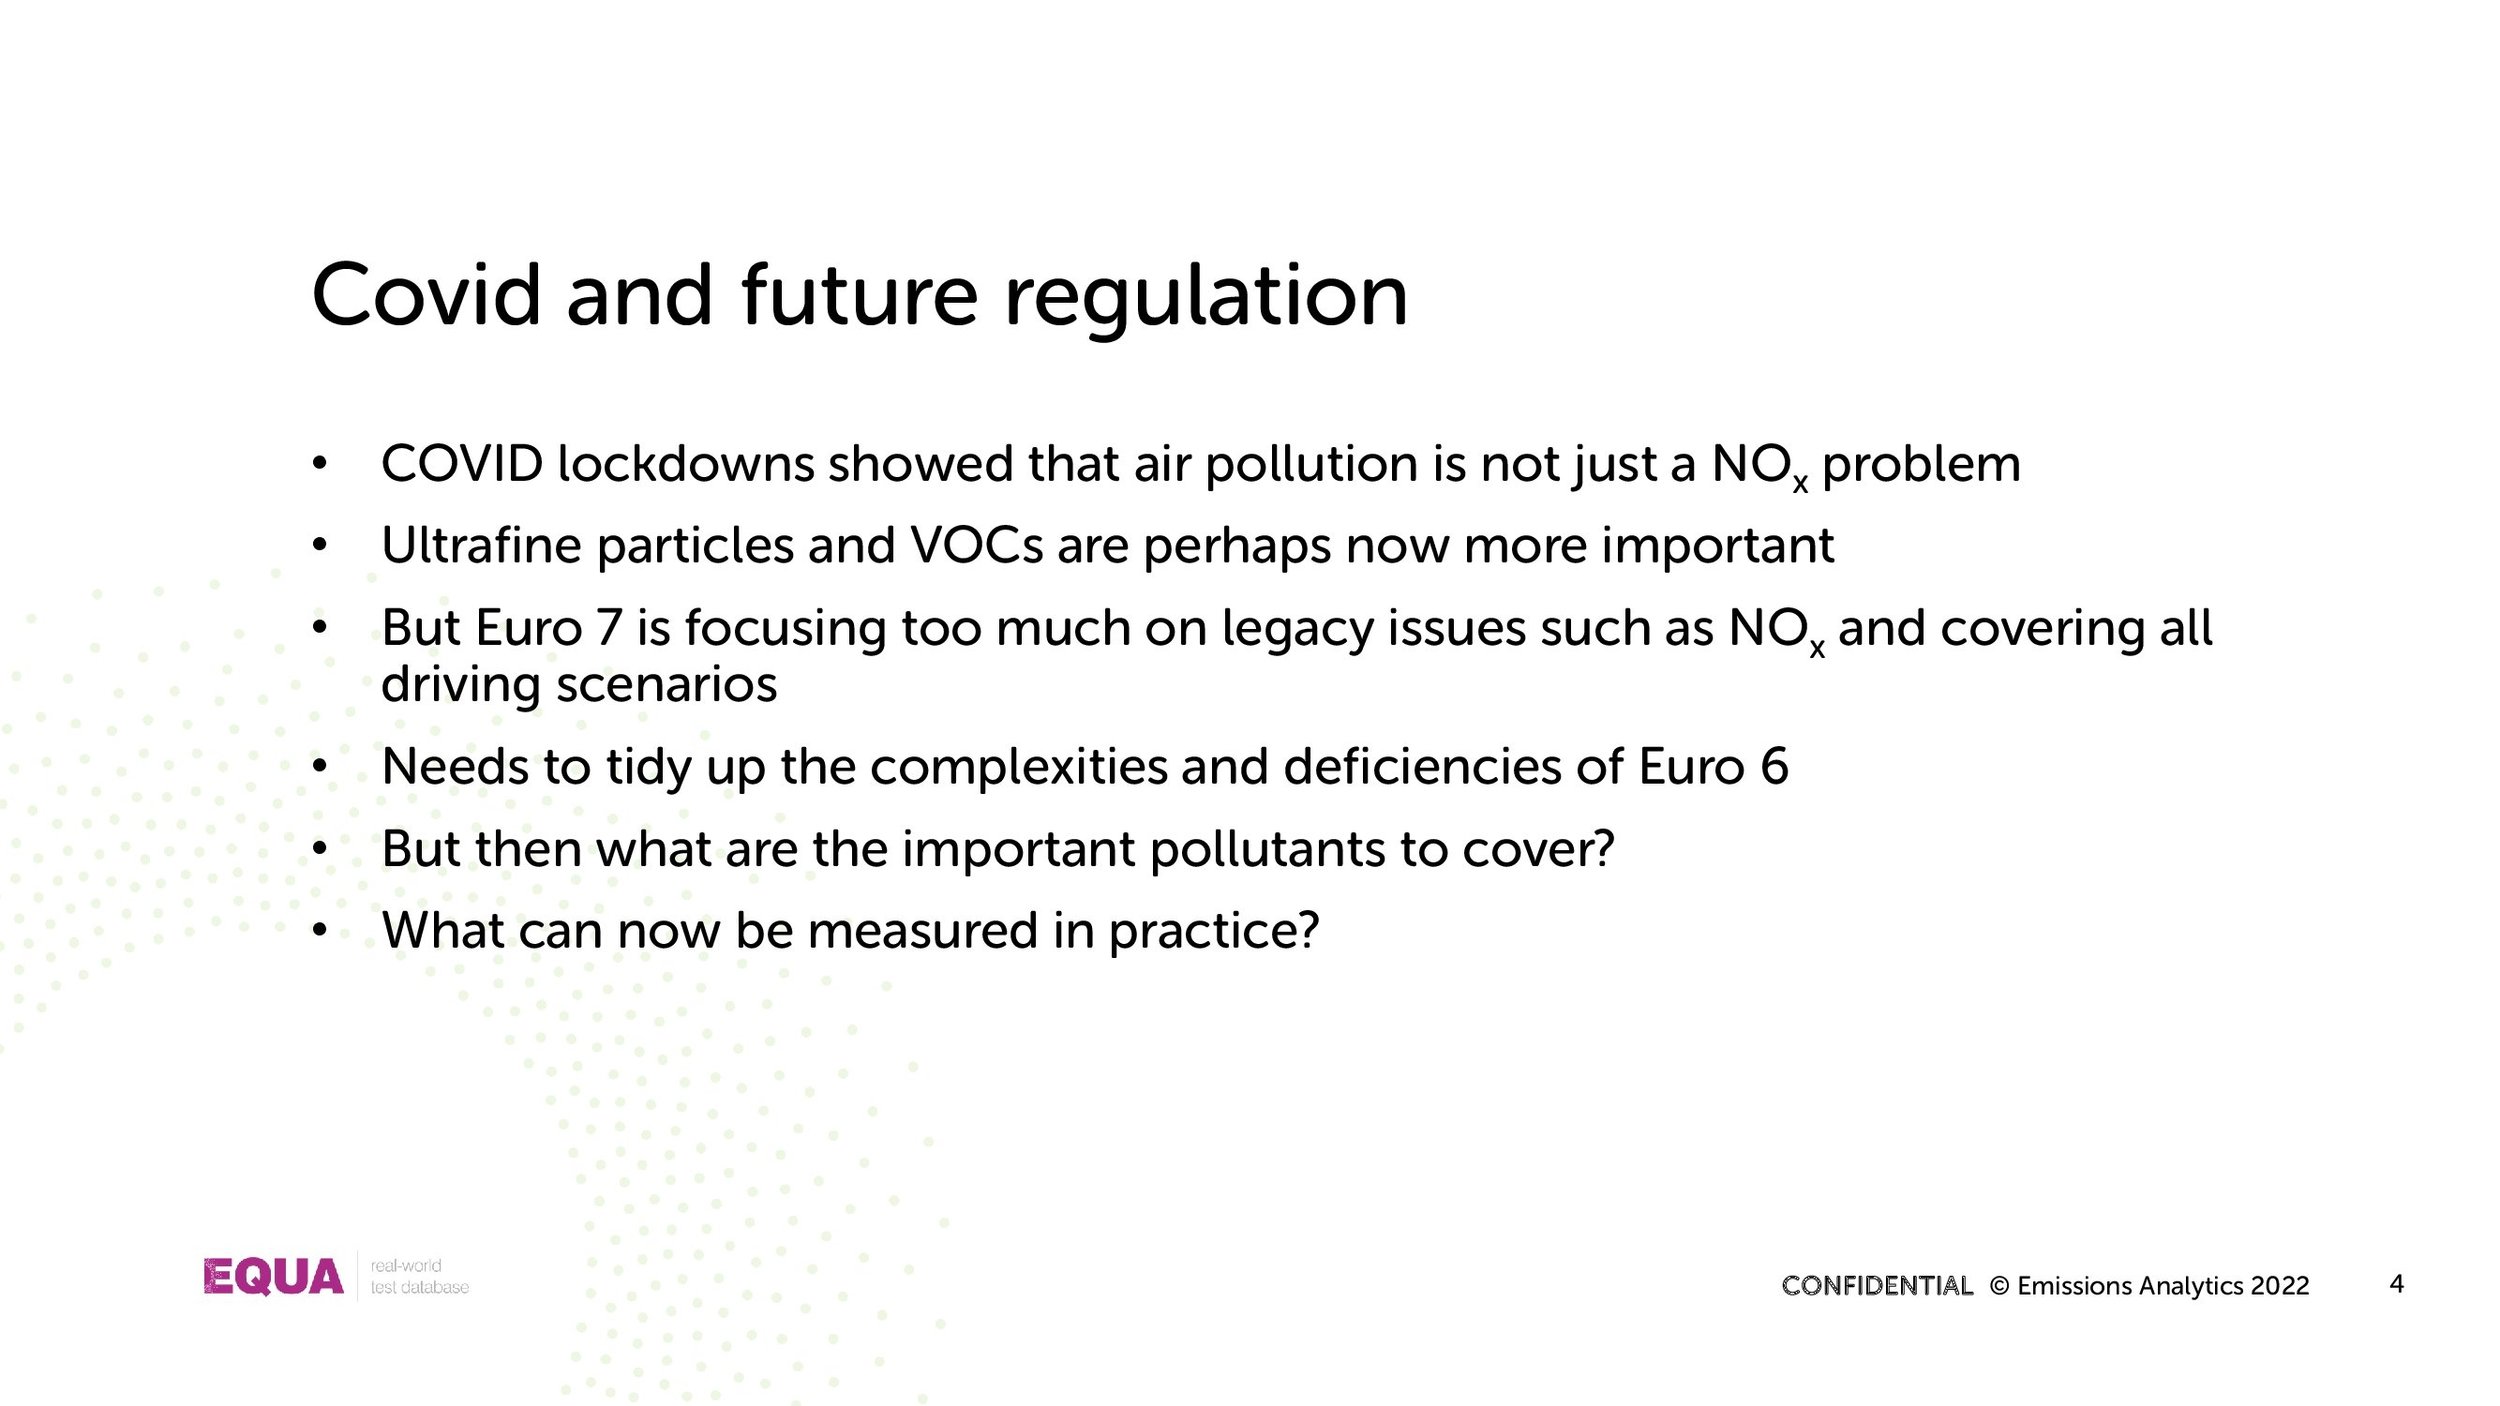
When the various pandemic lockdowns across Europe failed to bring about the overall improvements in air quality that might have been expected, Emissions Analytics’ interest focused in on volatile organic compounds (VOCs) and their potential role.
But which ones really matter on the road?
When the various pandemic lockdowns across Europe failed to bring about the overall improvements in air quality that might have been expected, Emissions Analytics’ interest focused in on volatile organic compounds (VOCs) and their potential role. While nitrogen oxide (NOx) emissions fell with traffic levels, often ground-level ozone (O³) rose, leading to similarly bad air quality from a human health point of view, just of a slightly different complexion. In fact, this should not have been a surprise as the complex interaction of NOx, VOCs and O³ has long been studied¹. The South Bay in Los Angeles has grappled with this problem since motor vehicles proliferated, and many US air quality regulations have stemmed from the experiences there.

Recent newsletters from Emissions Analytics have, therefore, looked at sources of VOCs including vehicle tyres (What's in a tyre?) and materials (Euro 8: Rethinking Vehicle Emissions Fundamentally). This newsletter returns to the tailpipe to see what VOCs and other currently unregulated pollutants are being emitted in real-world, on-road driving. This is aimed at taking understanding beyond the ‘total hydrocarbons’ that are regulated using a laboratory test in Europe, and non-methane hydrocarbons that are regulated in a number of territories including the US. This research is being conducted against the backdrop of the current discussions around the proposed new ‘Euro 7’ regulation, which may include some hitherto ignored pollutants including particular species of VOCs.
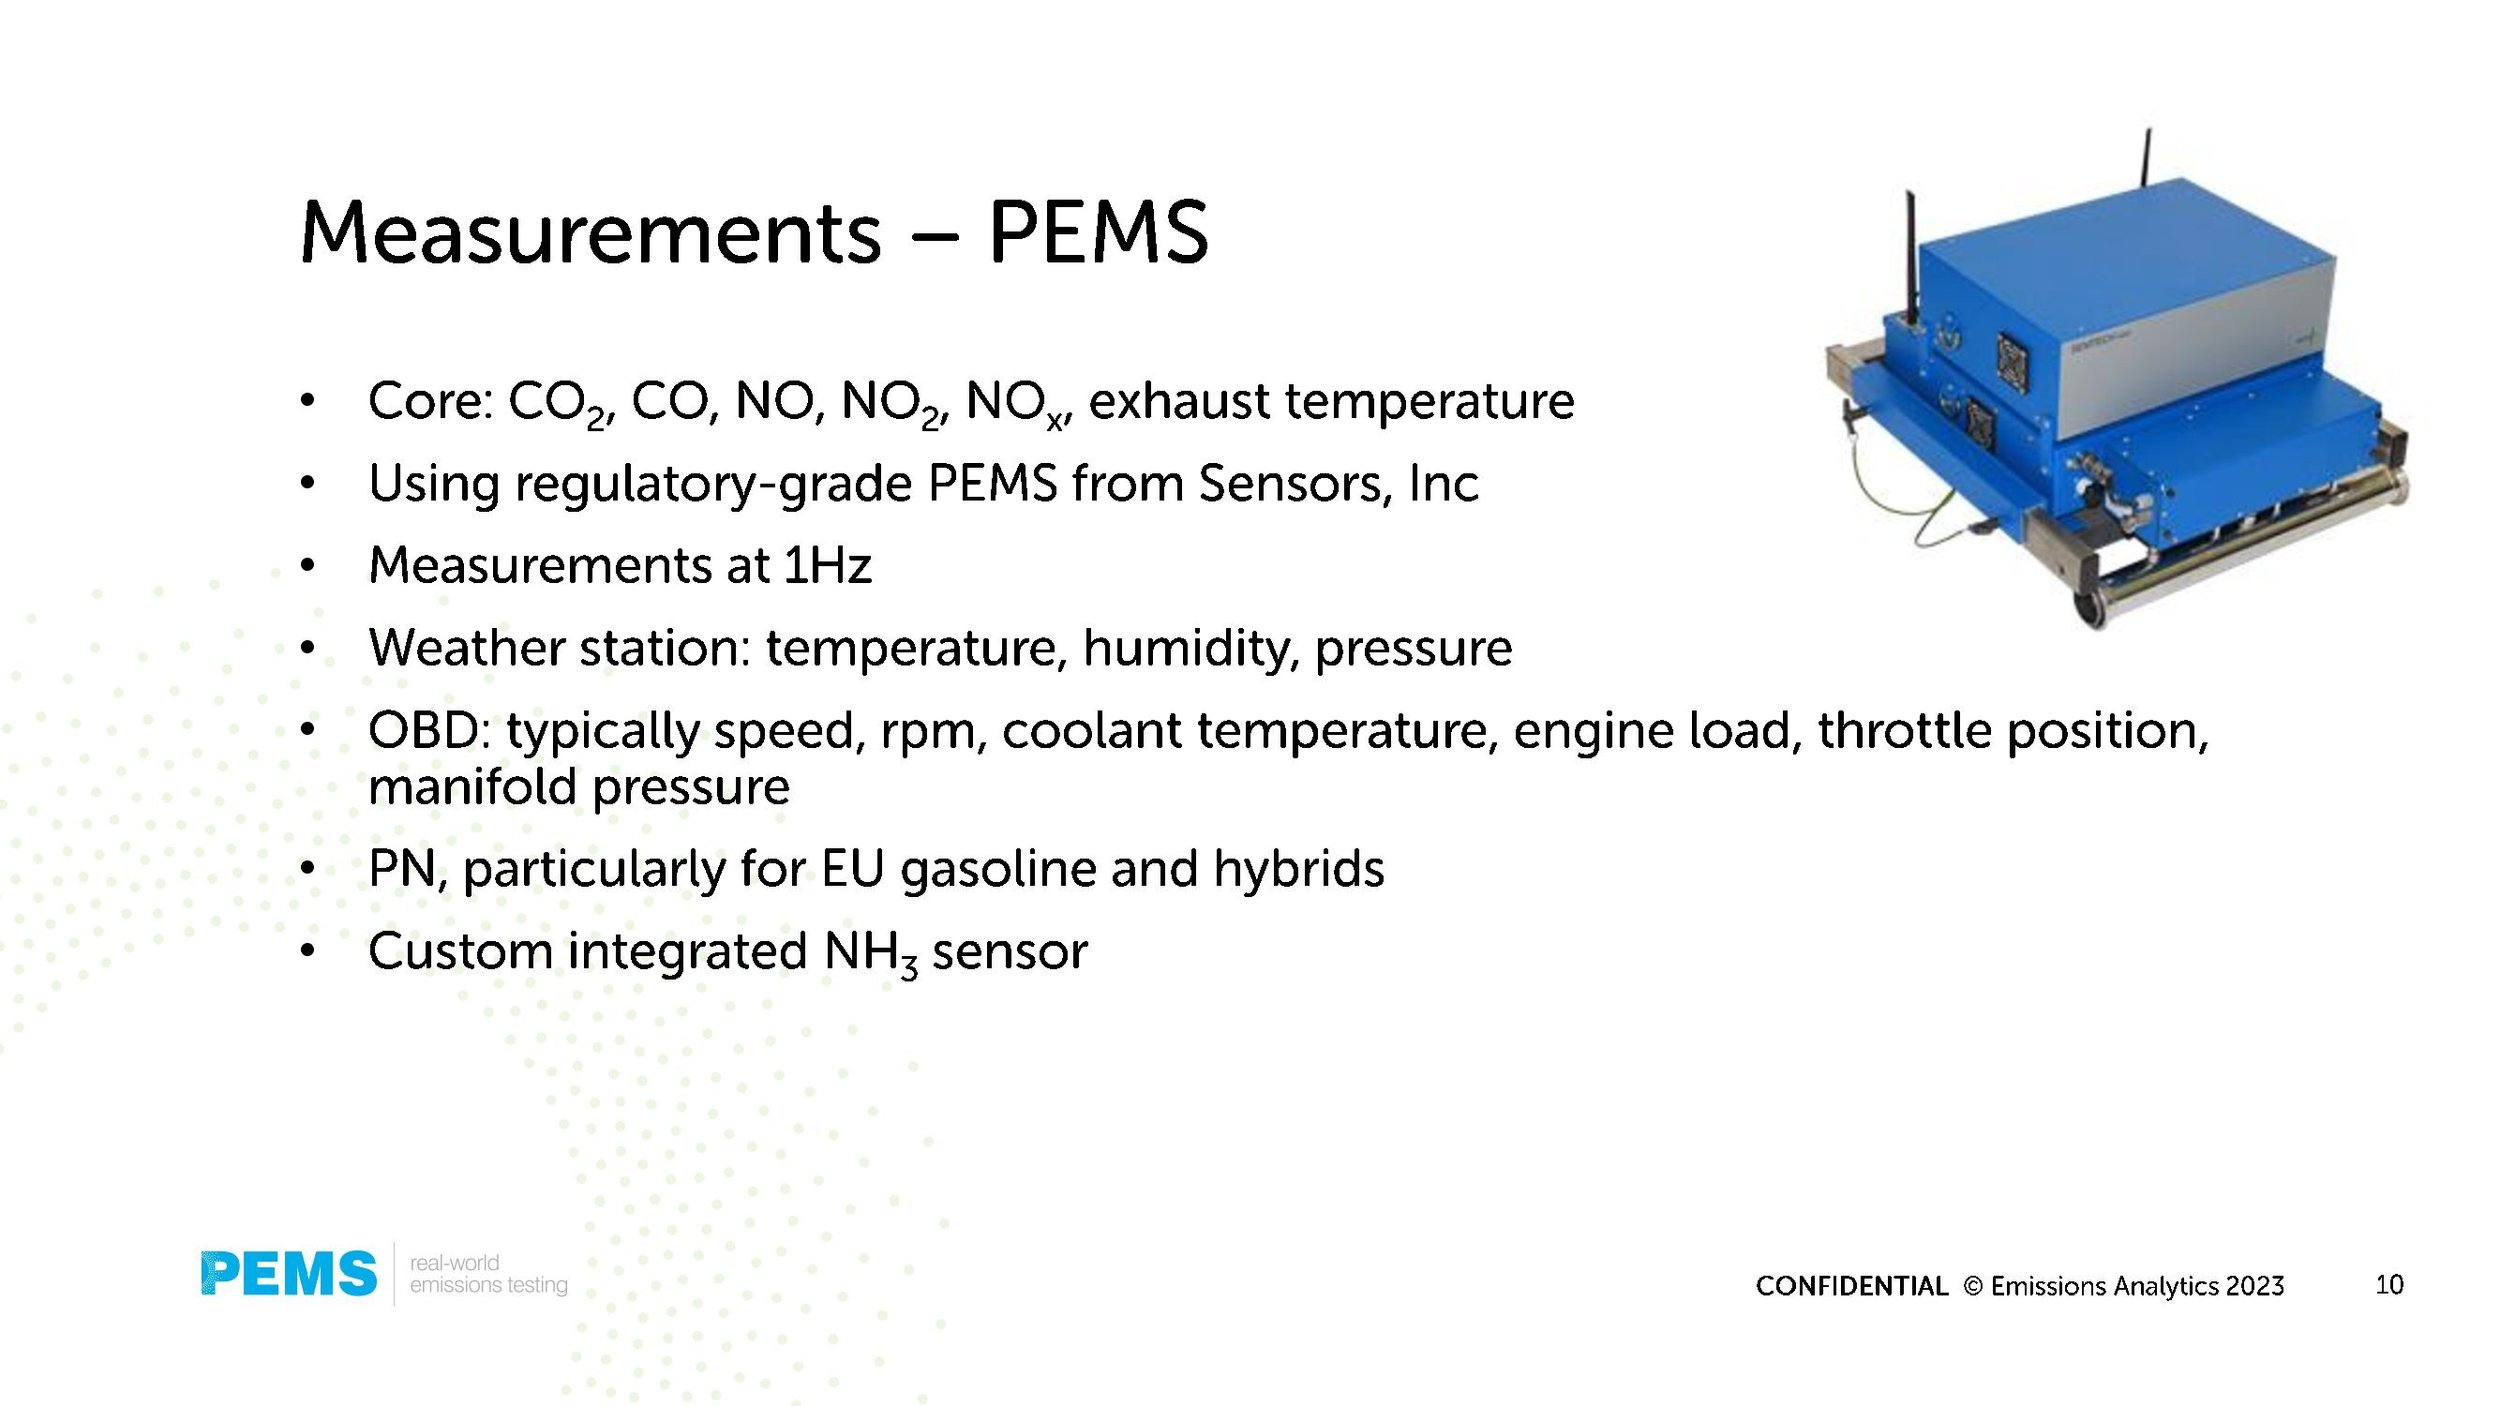
Measuring a wide range of organic compounds and other volatile species at the tailpipe is a challenge due to the large number of different compounds – many hundreds, if not thousands – as well as their volatility, which can make them hard to capture. While this can be done in the laboratory, it is an even greater challenge on the road. Traditional portable emissions measurement systems (PEMS) measure total hydrocarbons (THC) using a flame ionisation detector (FID). This can deliver robust measurements, but it creates some operational challenges, not least from the need for a supply of combustion gas. Furthermore, only a single figure for total hydrocarbons is produced; it does not include non-hydrocarbon VOCs and does not separate the different species of hydrocarbons.

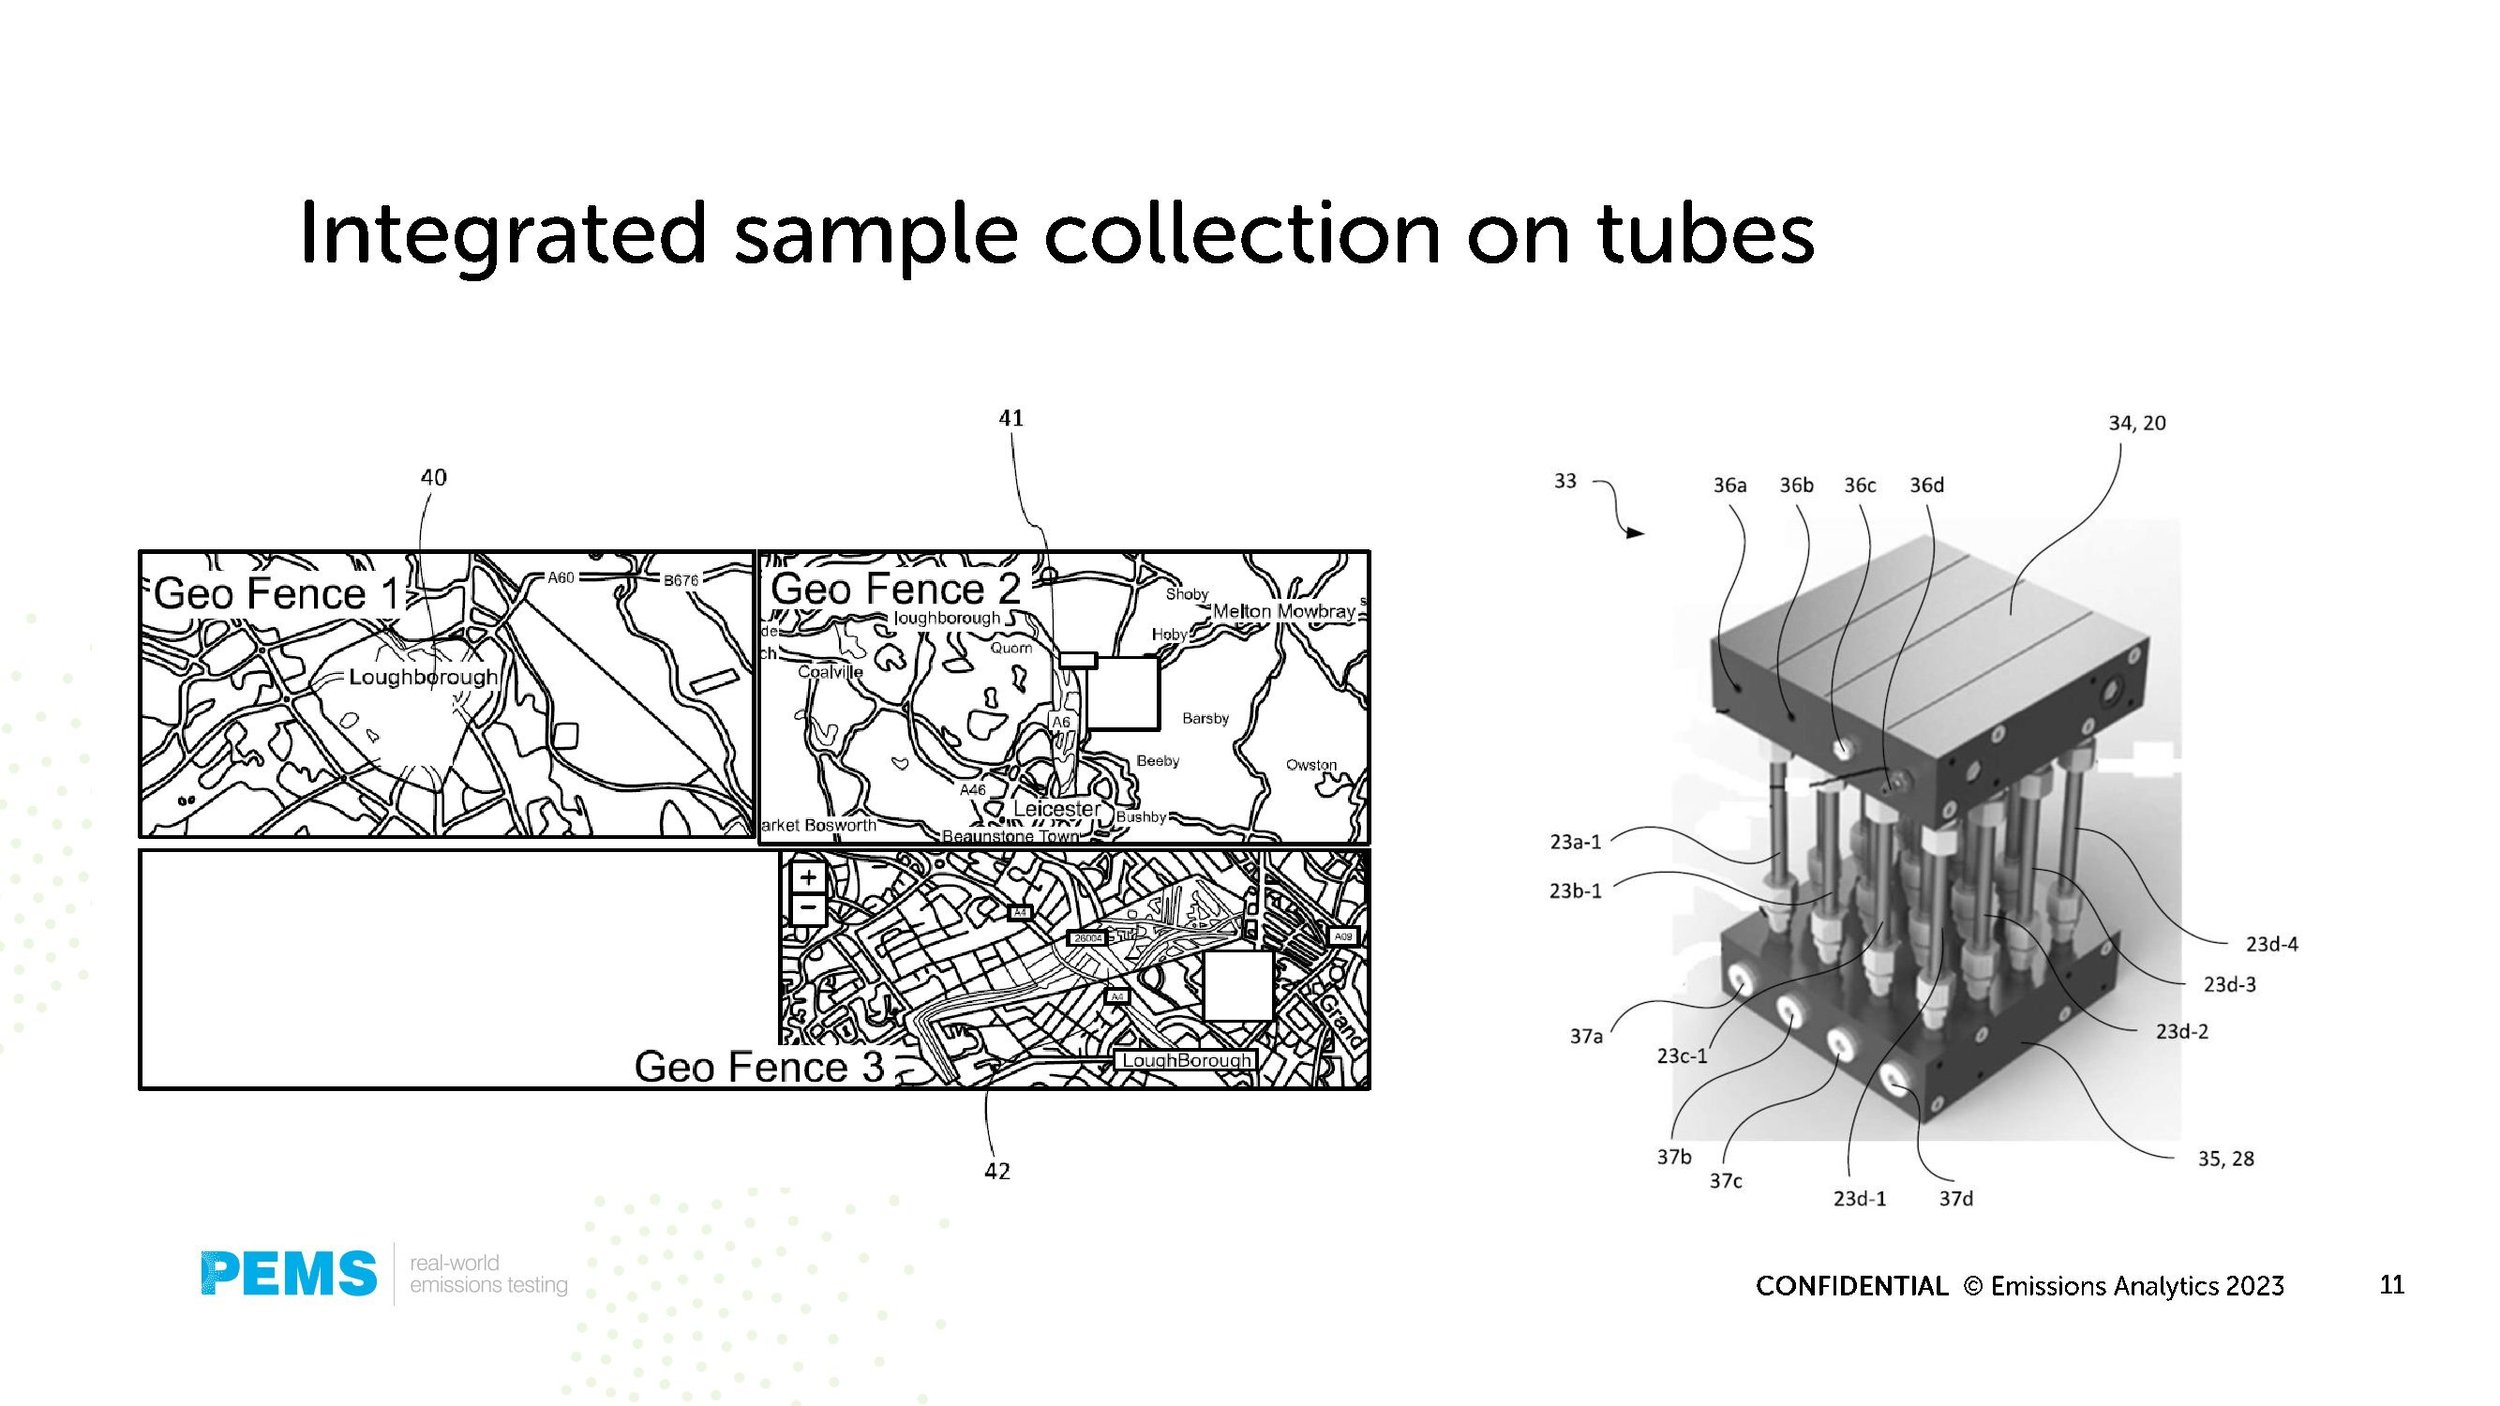
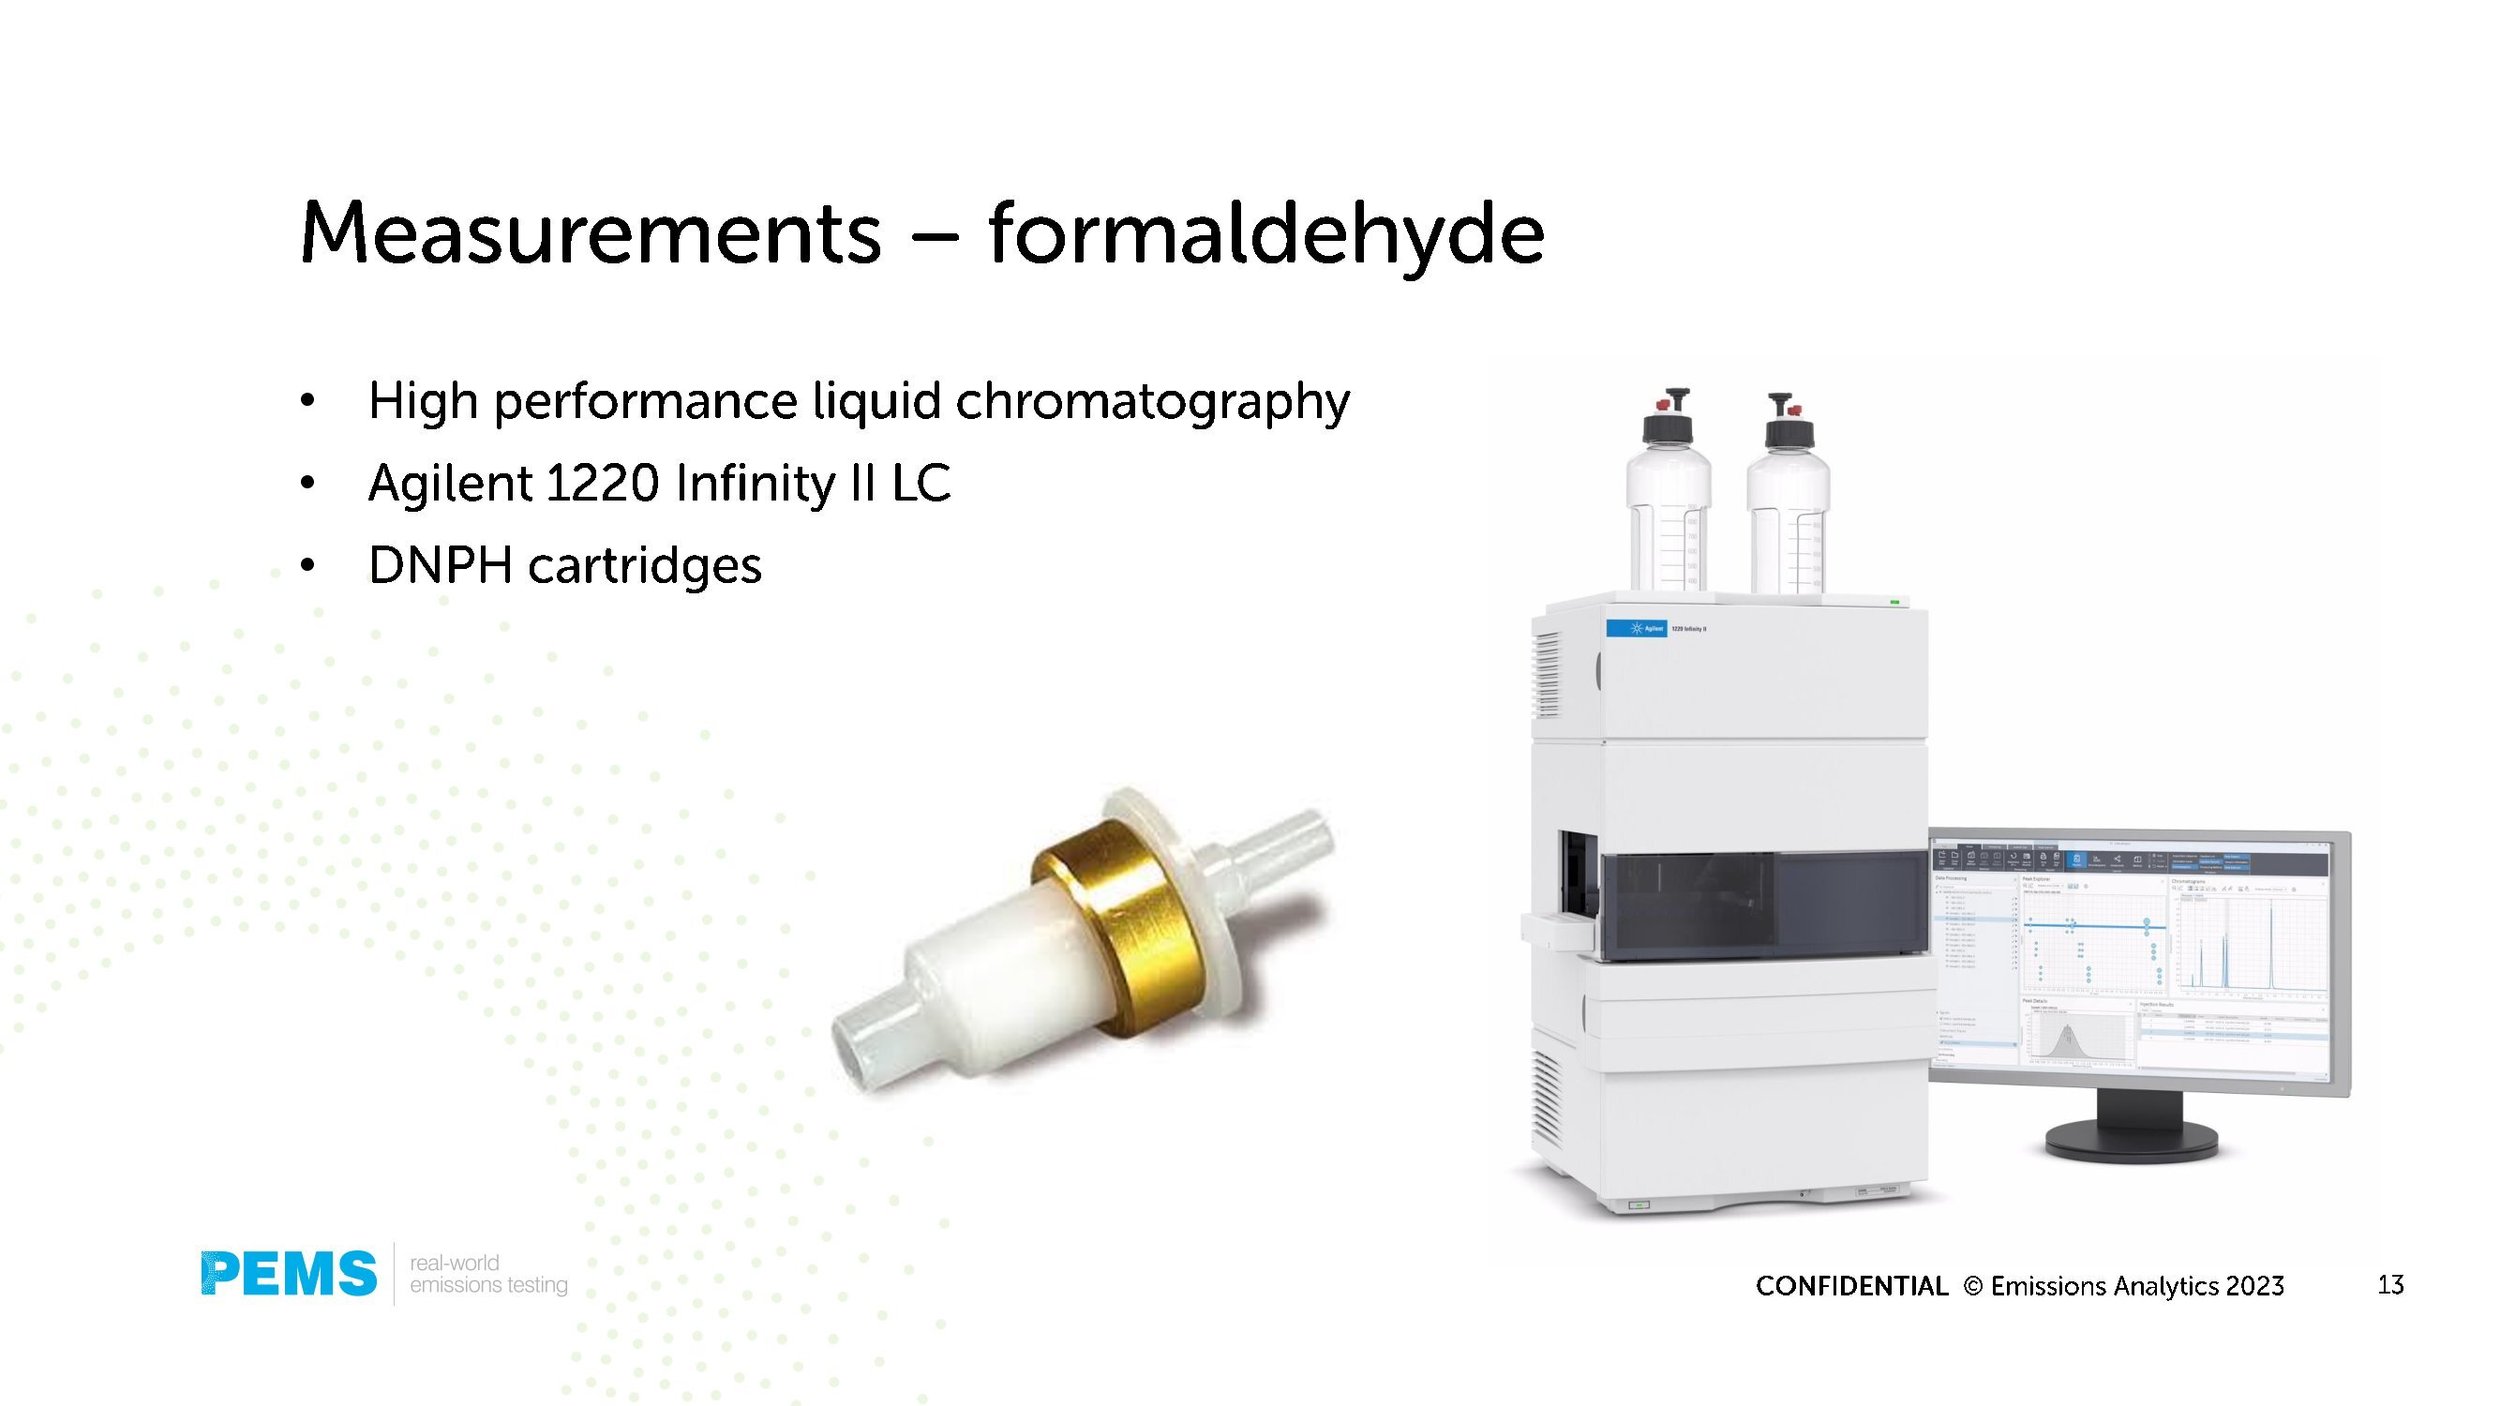
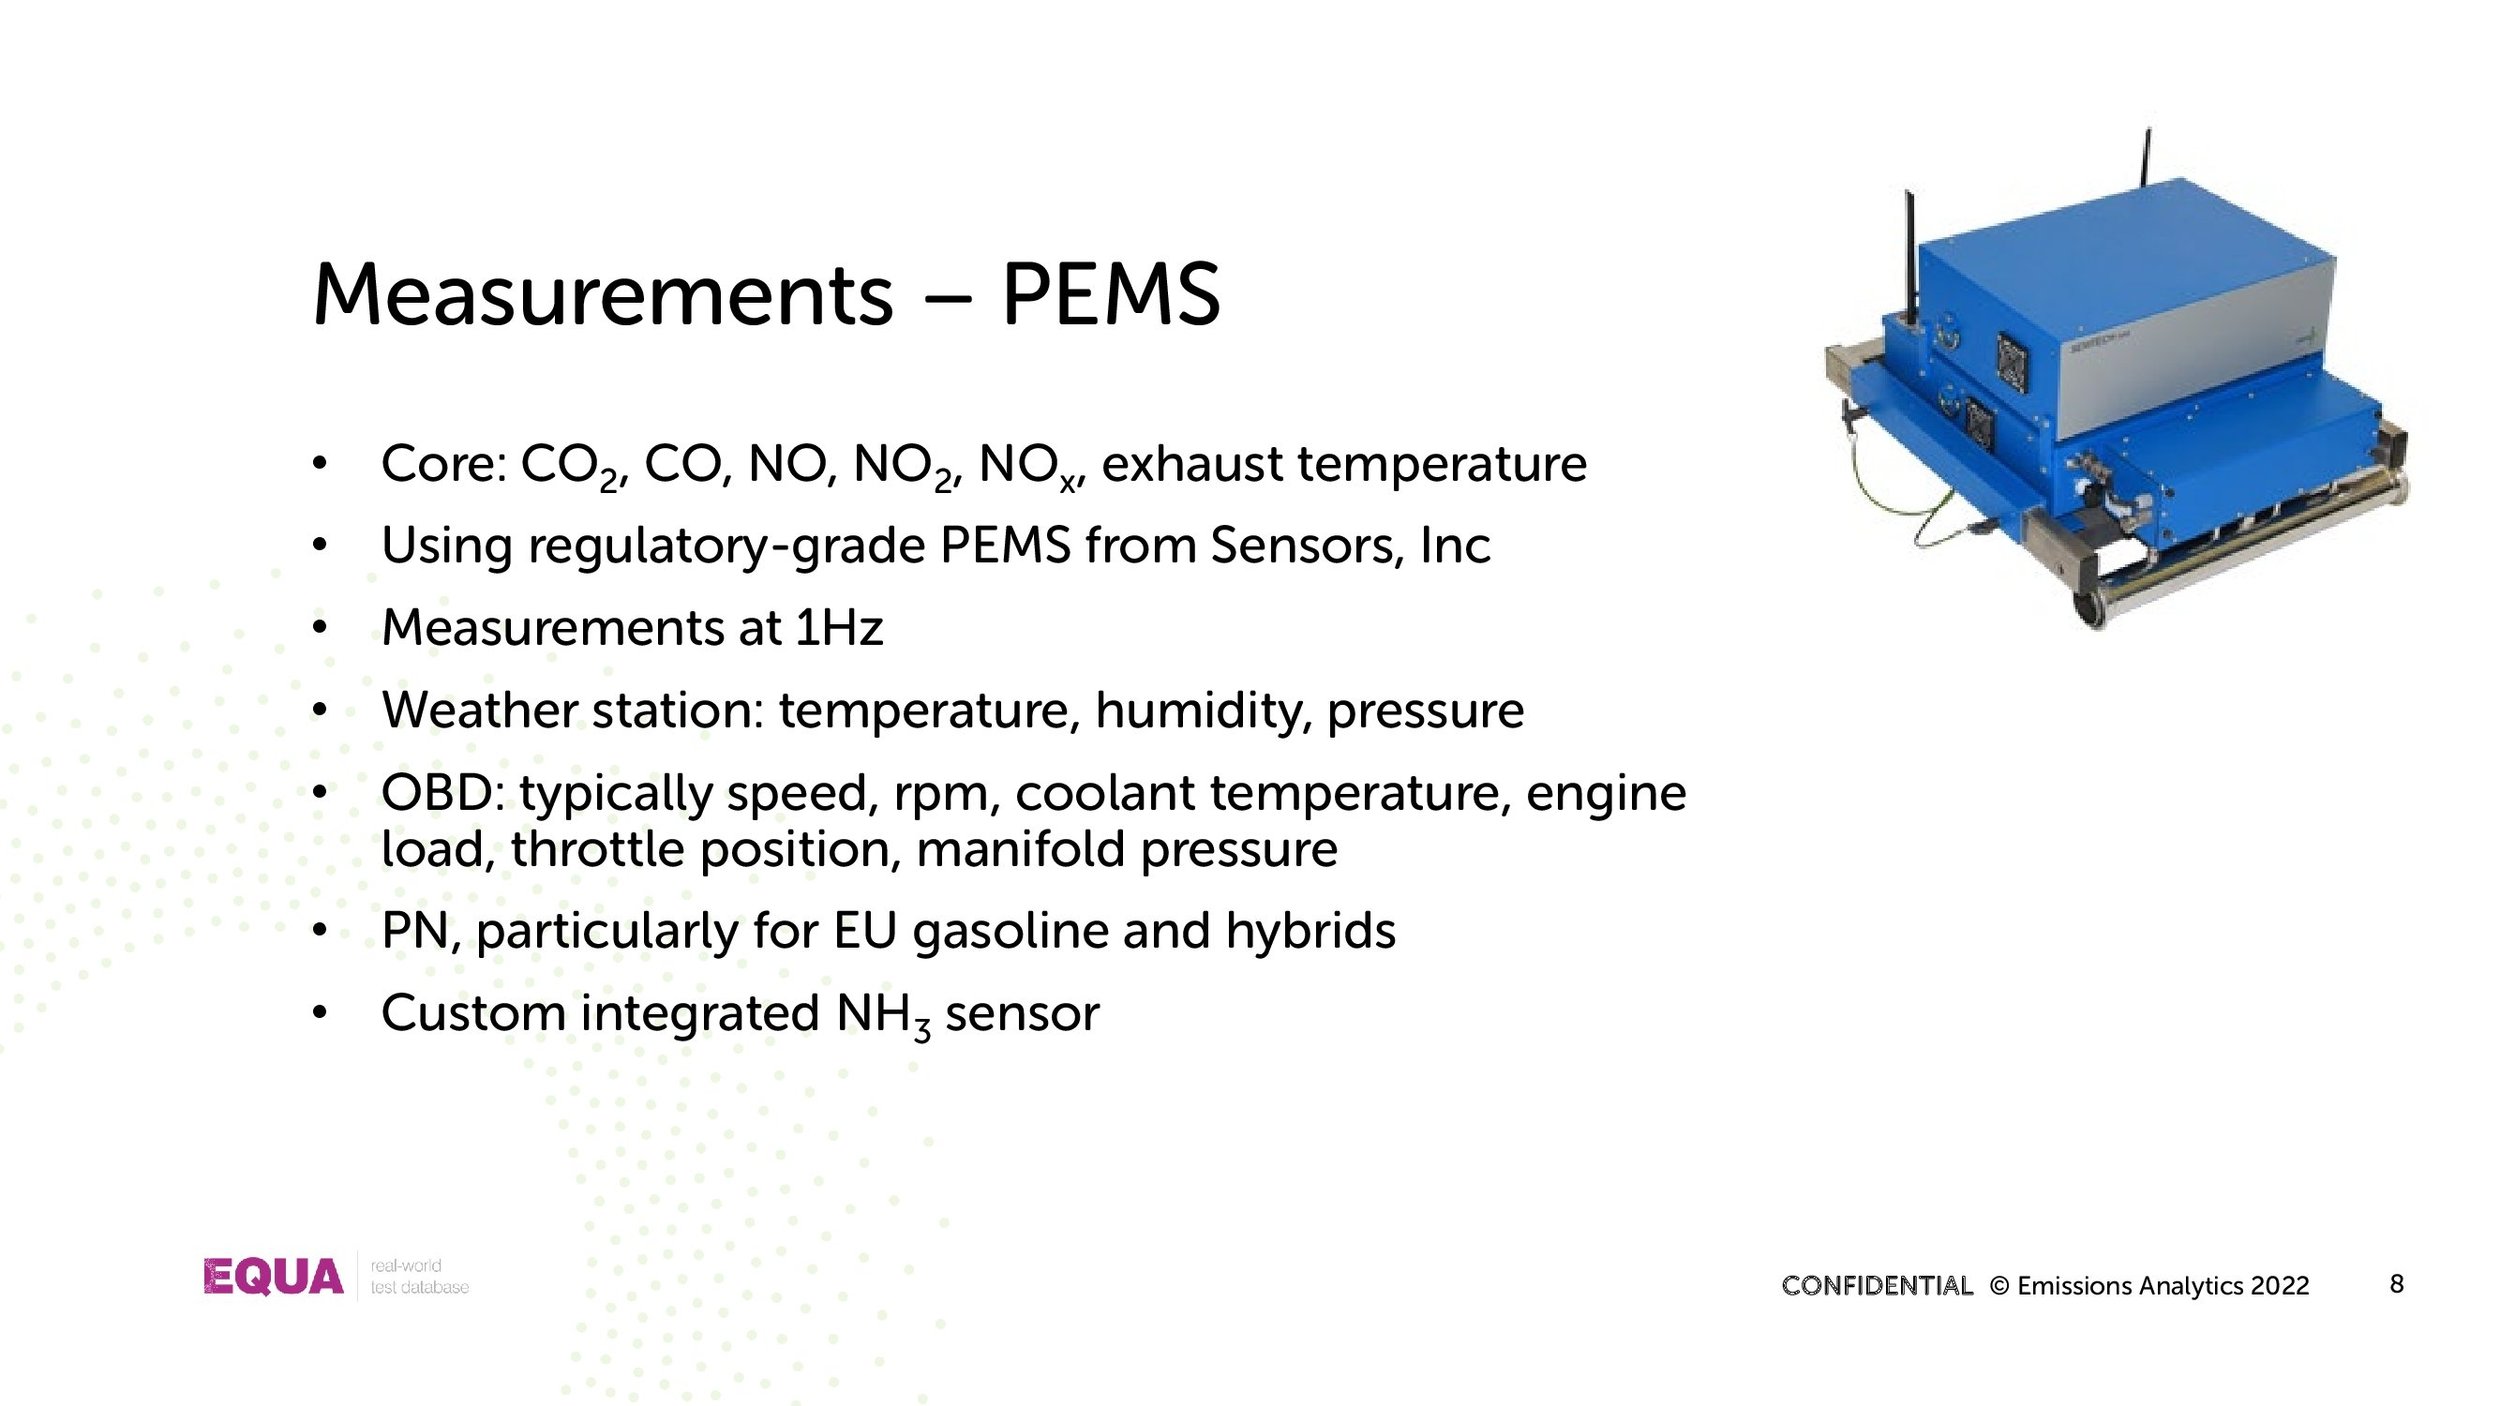
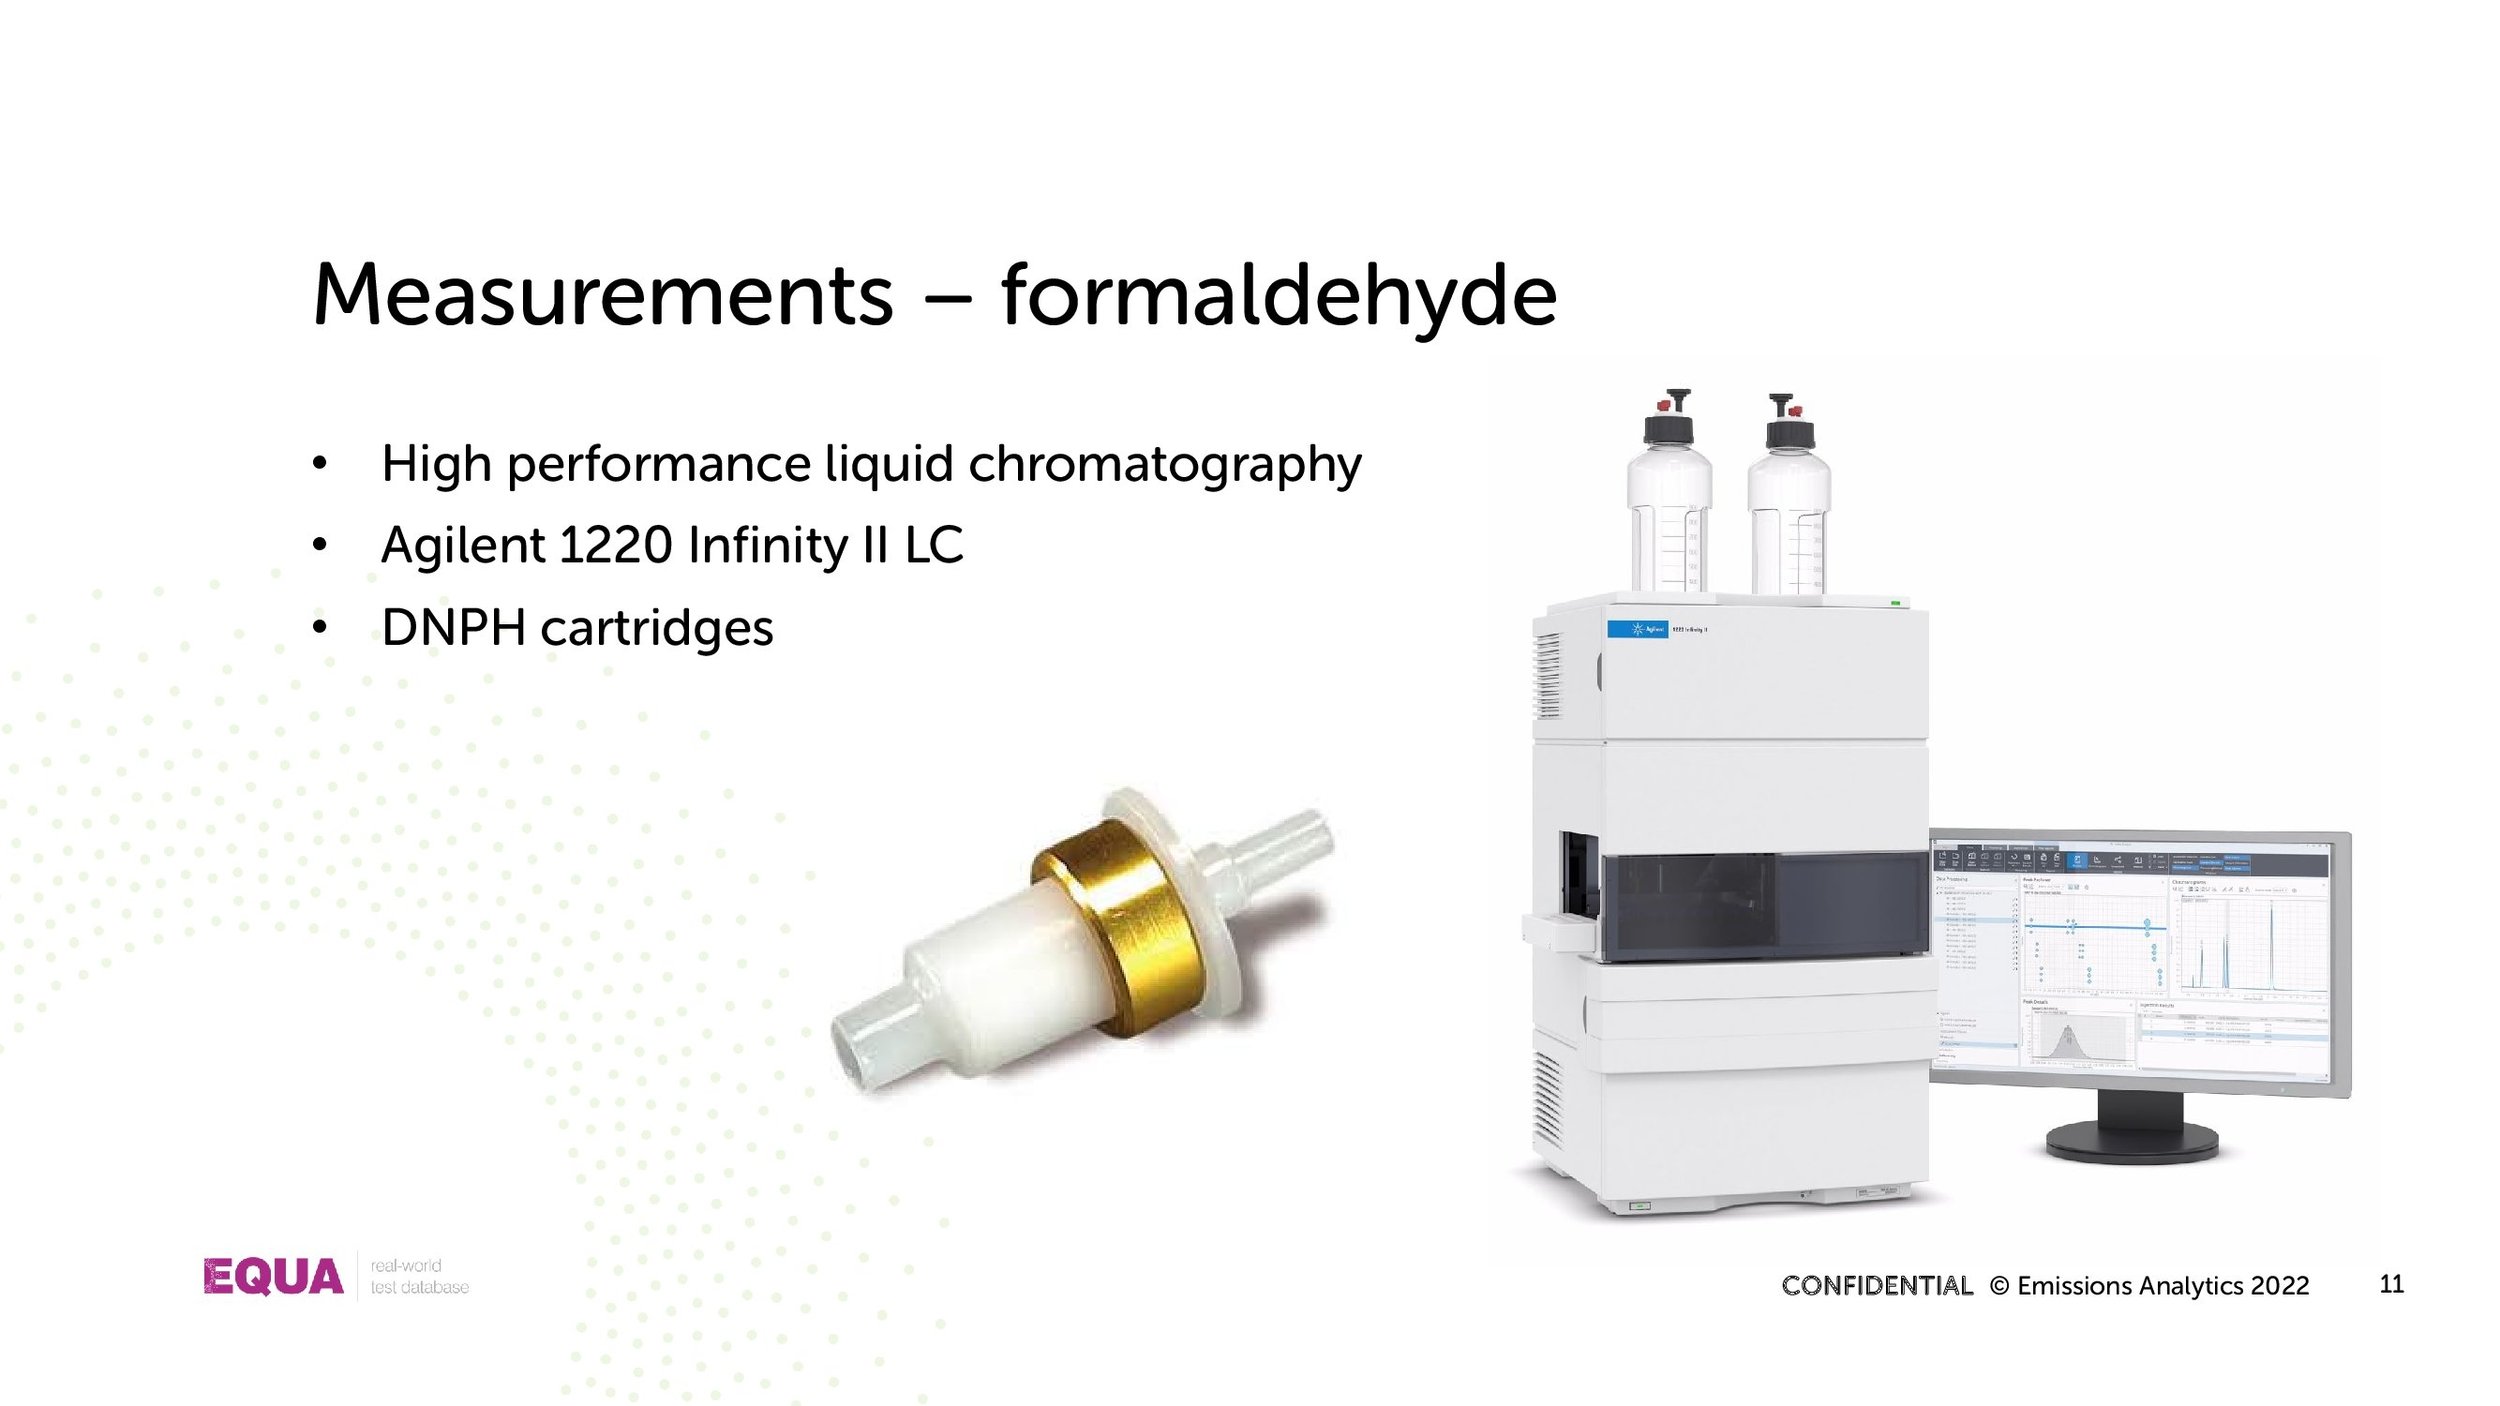
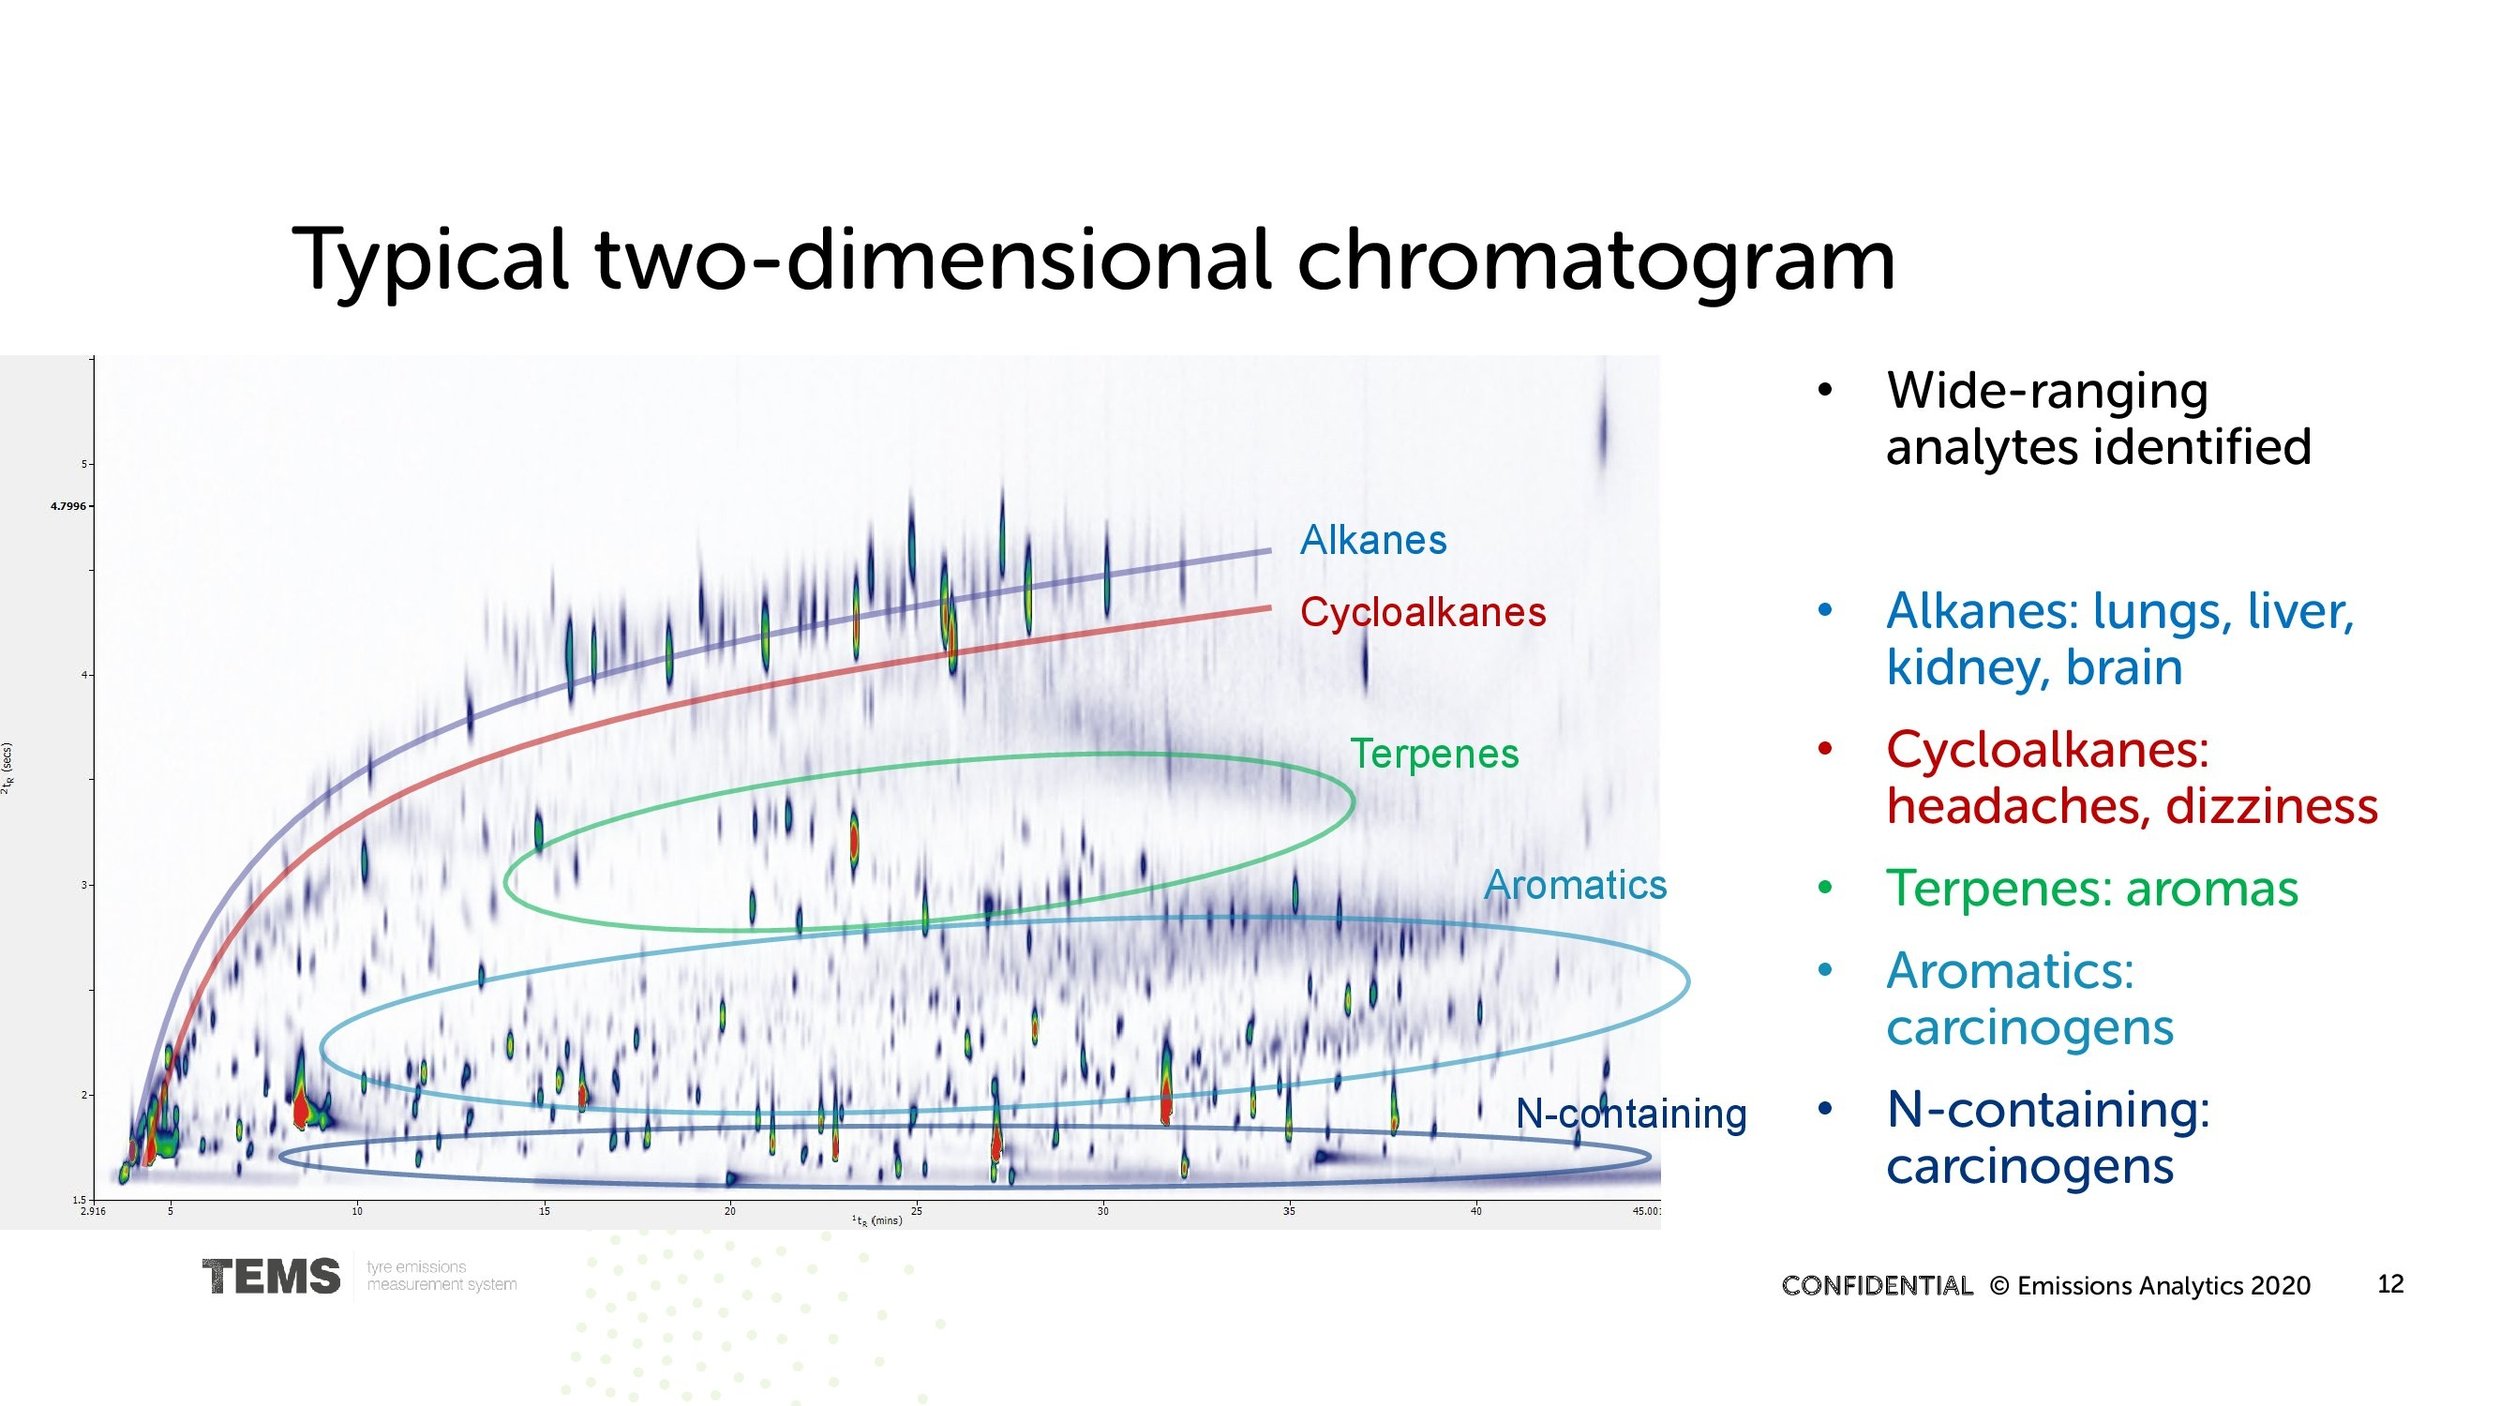
To address these challenges and limitations, Emissions Analytics has developed a proprietary, patent-pending system, that harnesses sample collection from the exhaust onto tubes while driving, which are then analysed later using laboratory gas chromatography. Using this, we can measure the concentrations of VOCs as well as semi-volatile organic compounds (SVOCs) – together covering compounds from with two carbon atoms (C2) up to at least 44 carbon atoms (C44) – formaldehyde (CH2O), nitrous oxide (N₂O), sulphur dioxide (SO2) and many others. Therefore, both the breadth of compounds measured and the speciation challenges are solved. Furthermore, the measurements can be highly sensitive, picking up very low concentrations, which may be critical for highly toxic species. The chromatogram below illustrates the large number of distinct compounds that are present in a typical exhaust, with the height of the peaks generally indicating relative amounts.

When deployed together with a traditional PEMS unit, with its capability for measuring total exhaust flow, the concentrations of VOCs can be turned into mass values. Combined with the GPS speed data, the distance-specific emission rates can be calculated, giving mg/km figures as is the basis for regulating most gaseous emissions.
The limitation of this approach is that the sample collection on tubes is cumulative over the test cycle and, therefore, there is no second-by-second signal. This creates two problems. First, when the average concentrations are multiplied by the total exhaust flow, the result is biased due to the highly variable nature of both the target gas concentration and exhaust flow at the instantaneous level. Second, the result is a combined value for the whole test cycle, without any breakdown between different driving modes.
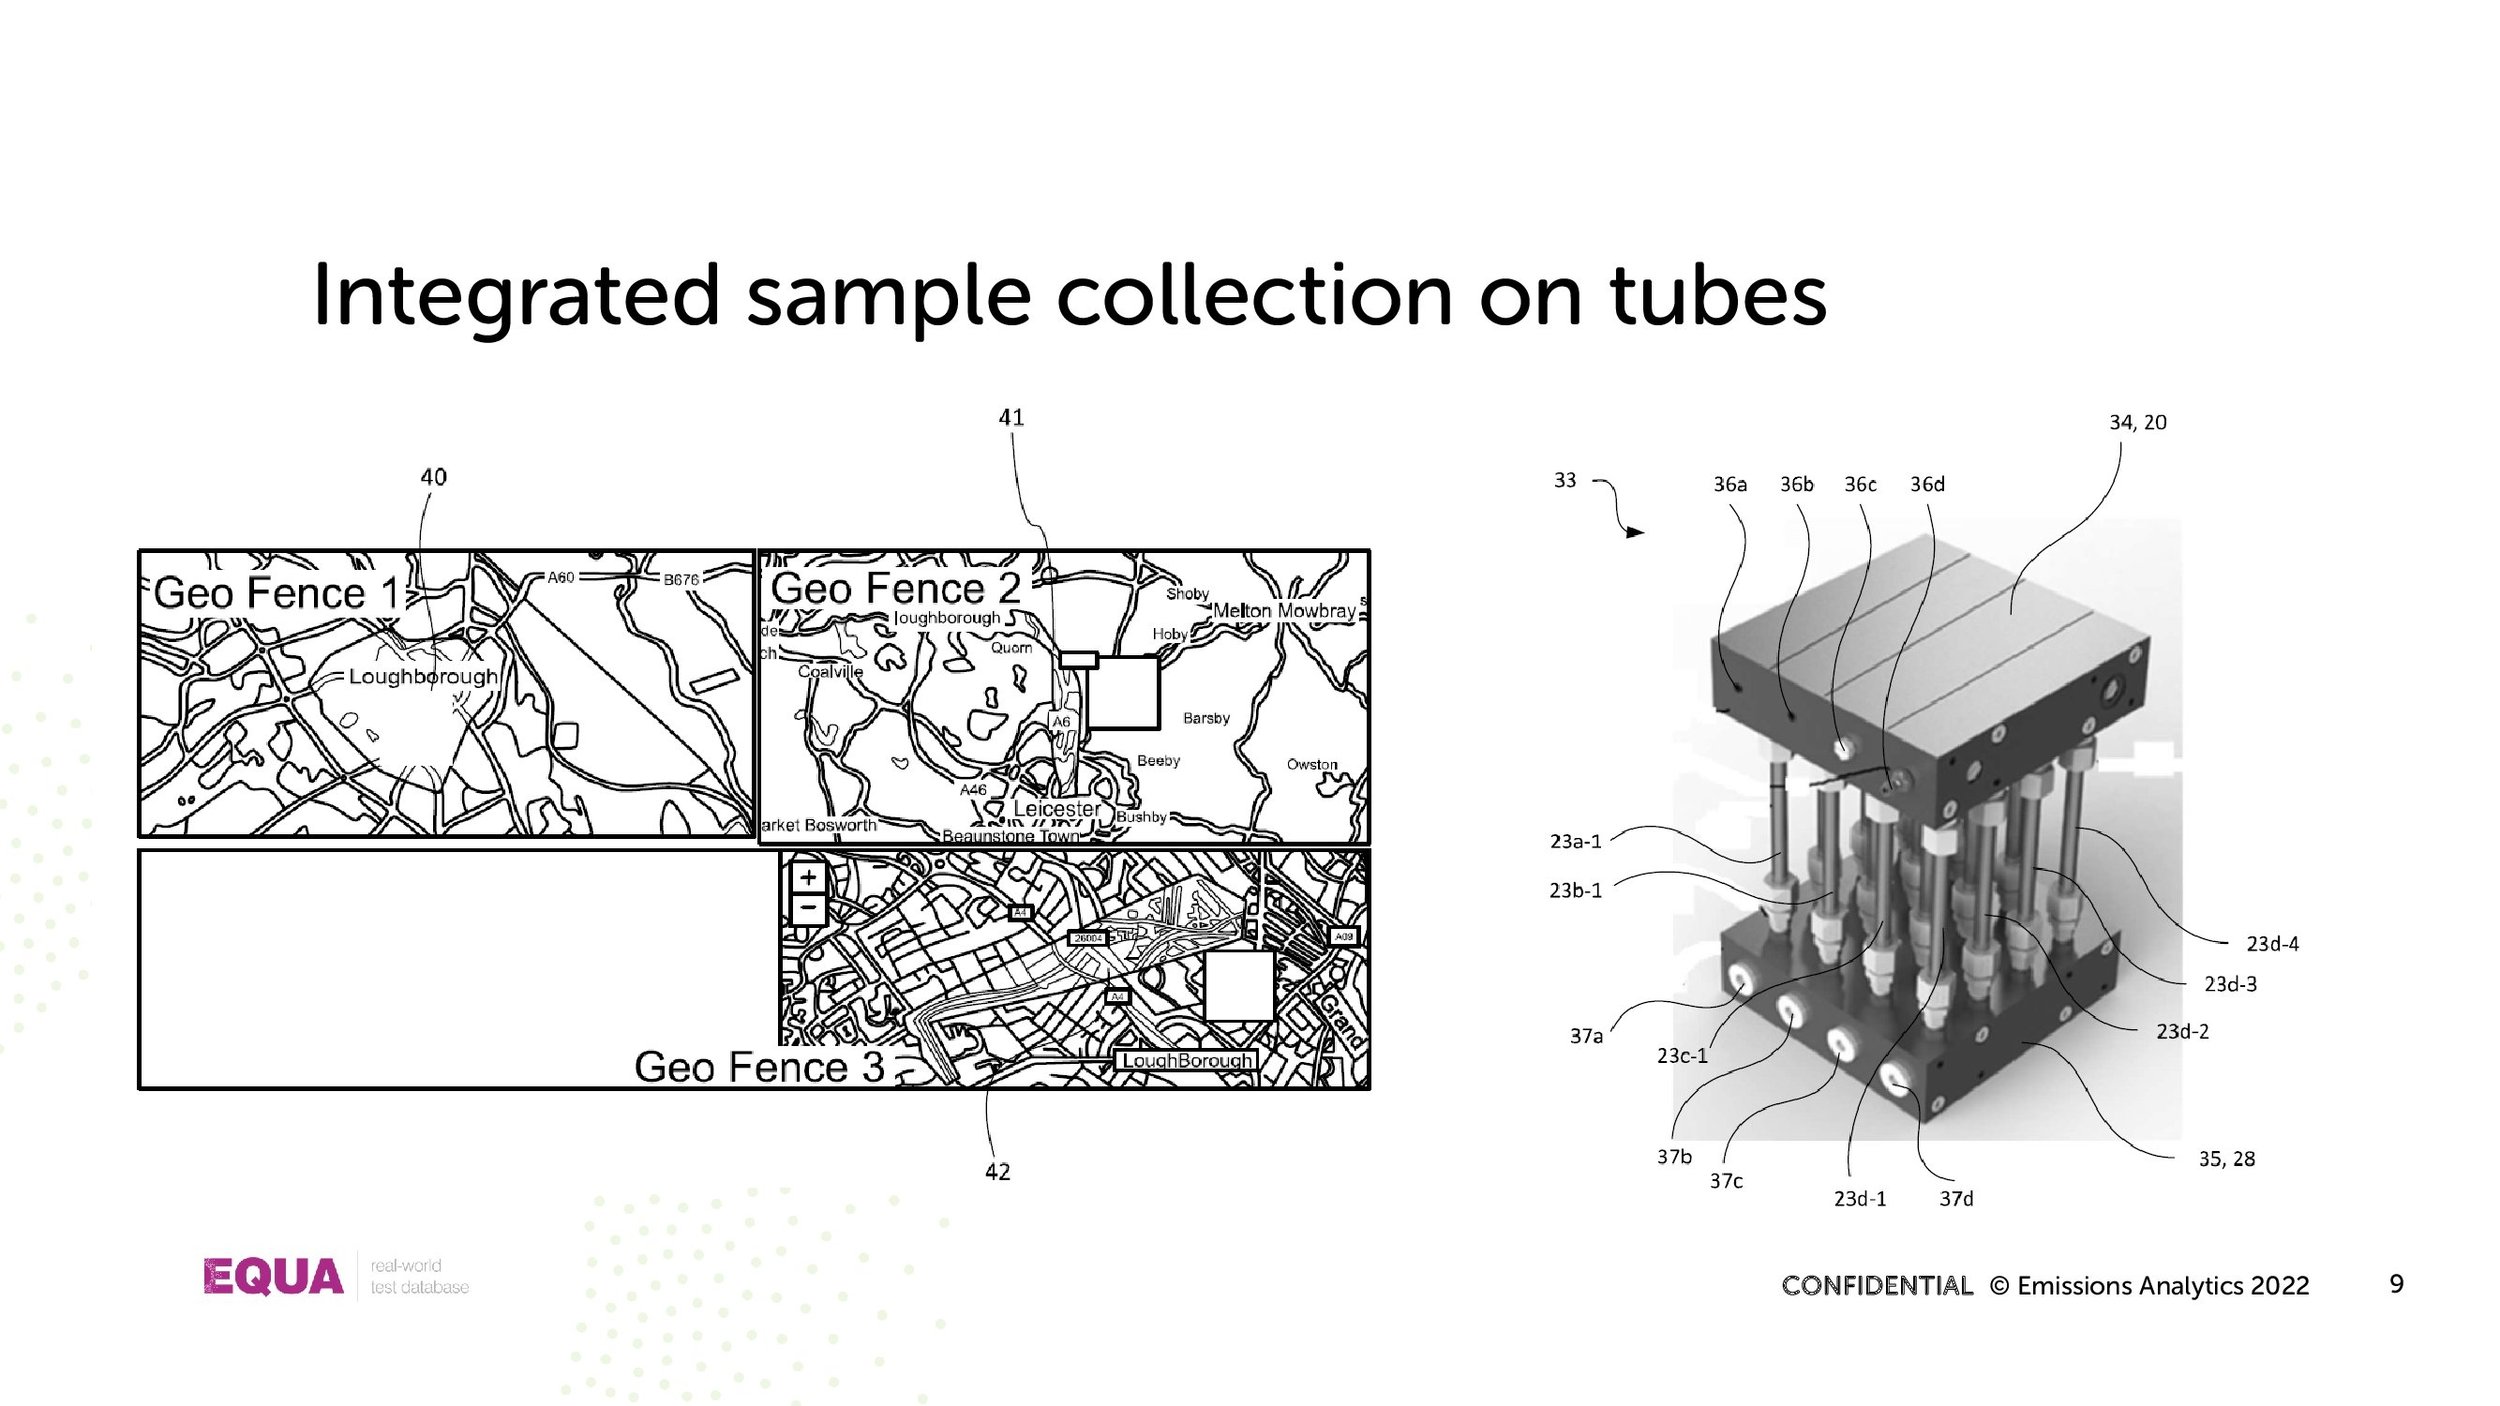
Our approach addresses both limitations. The sample bias issue is overcome using a proprietary on-board constant volume sampling and proportional flow dilution system. To give a breakdown of the combined cycle into useful sub-sections, a geofencing system automatically switches between different sample tubes to sample, for example, urban, rural and motorway driving separately.

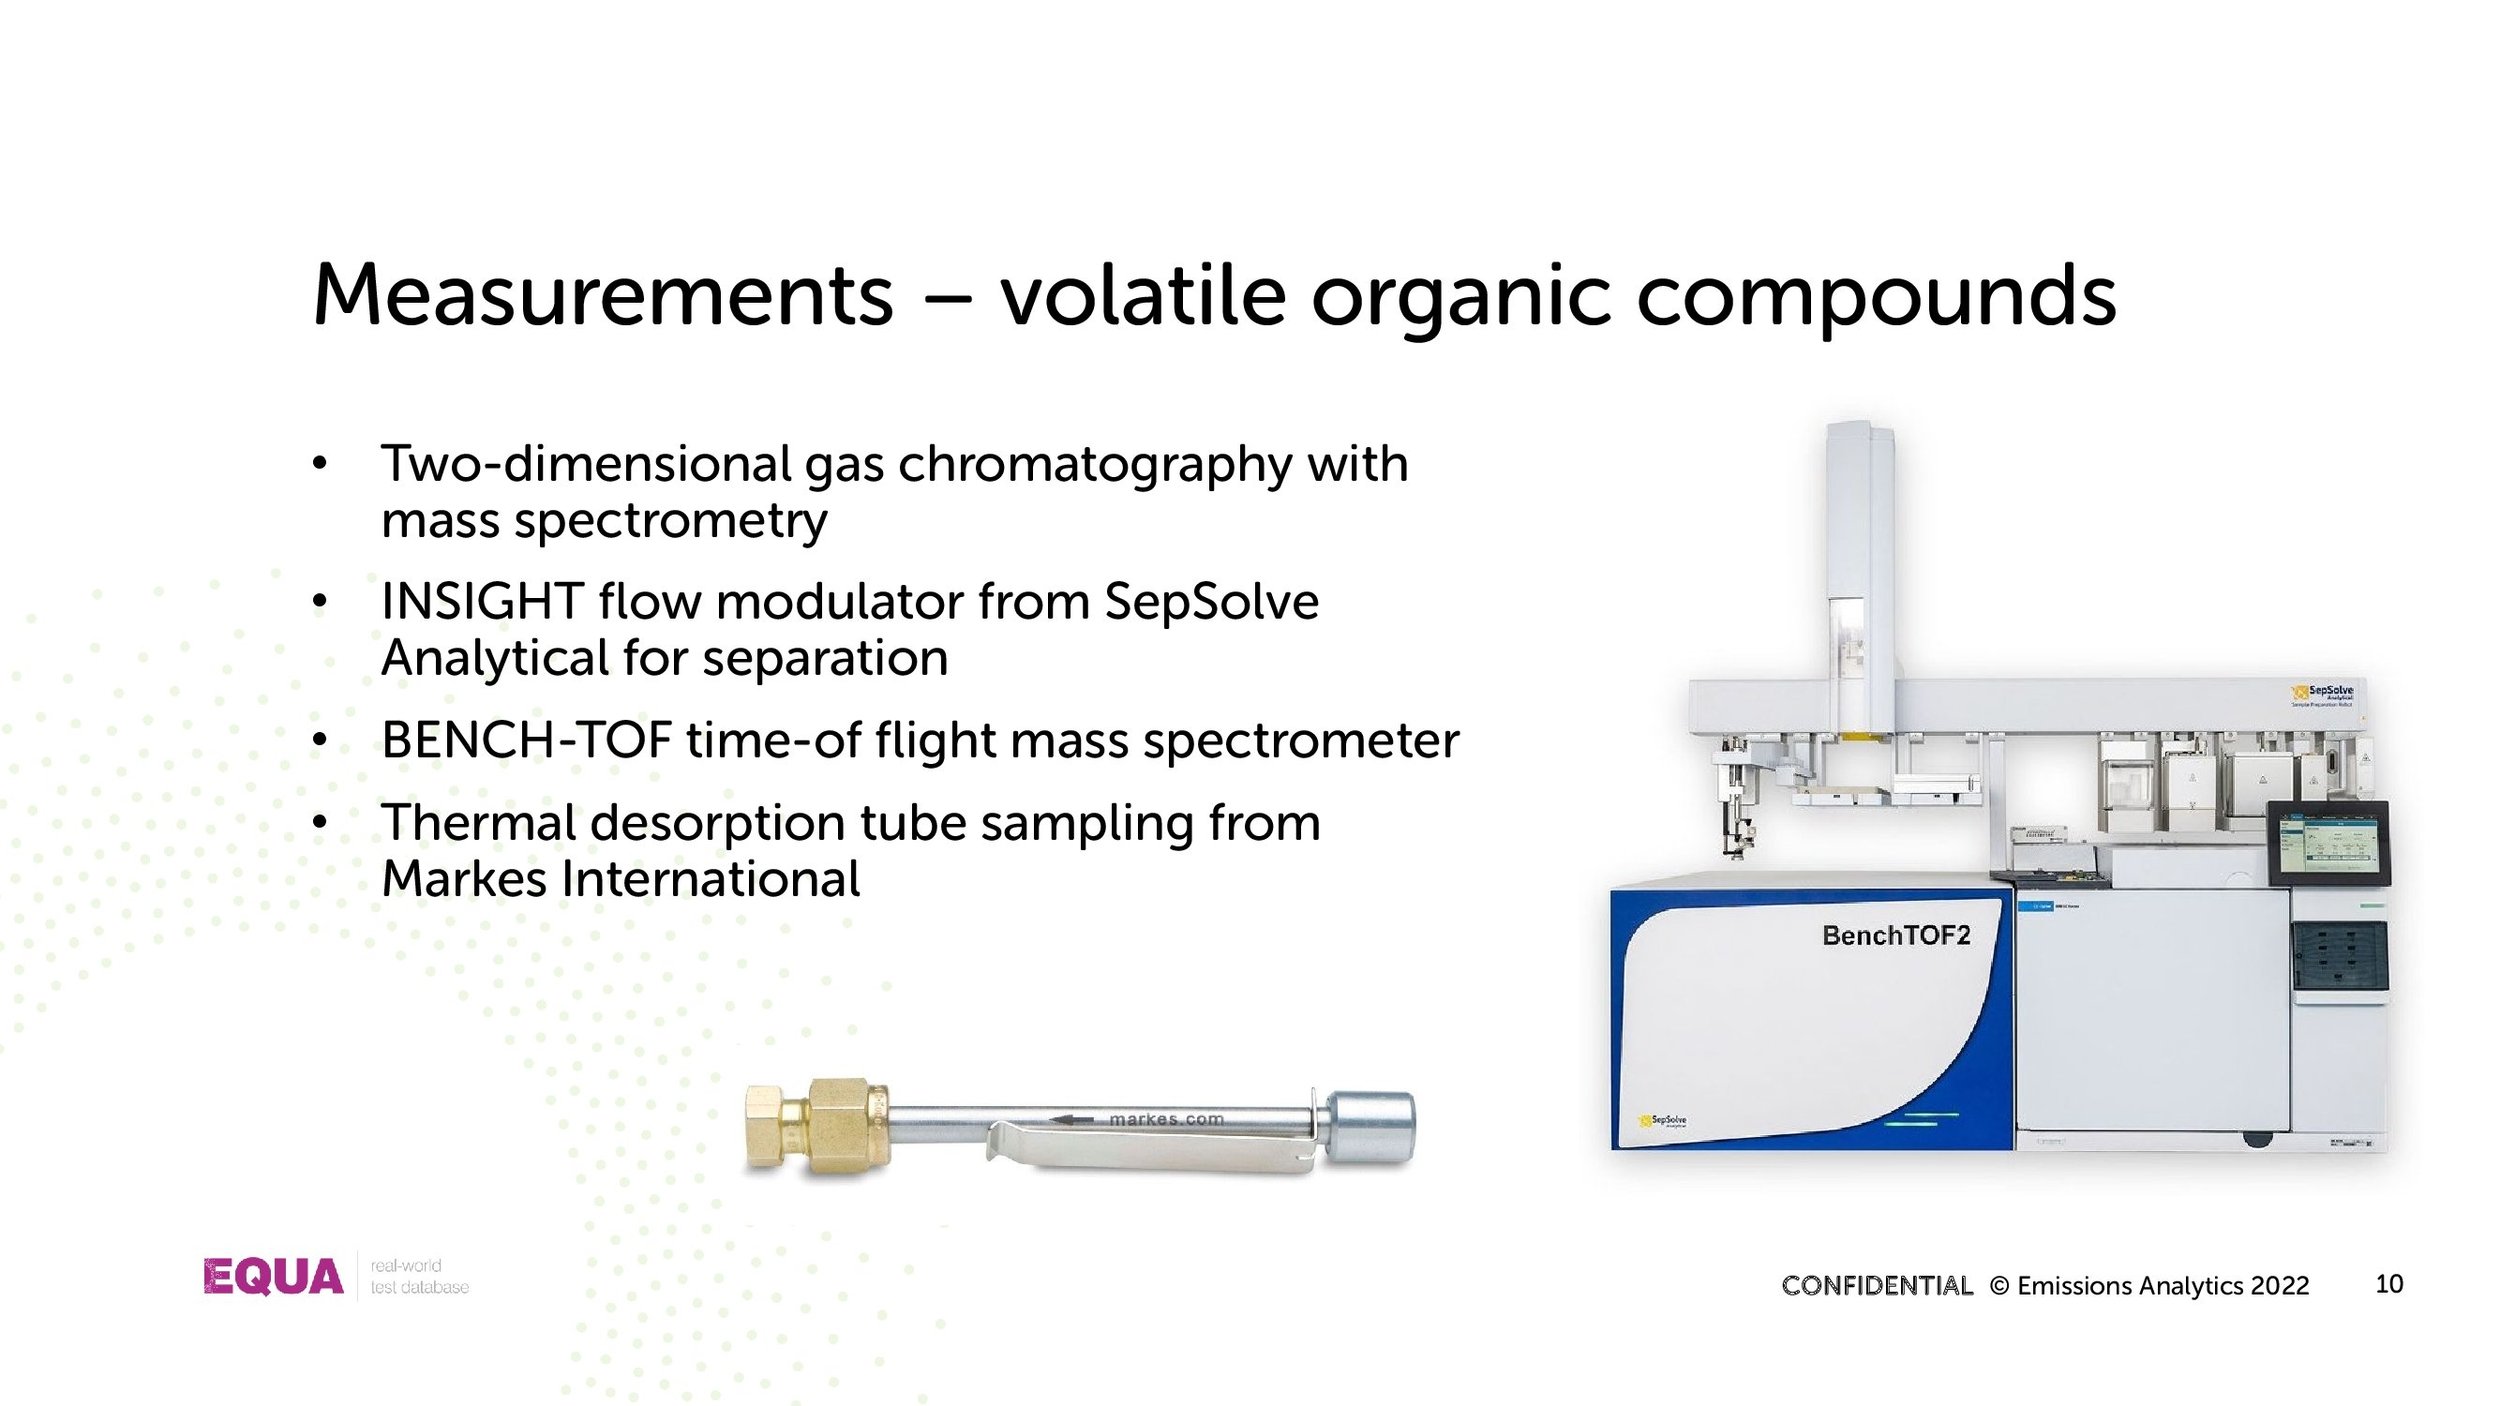
A notable advantage of the sample tube approach, from a practical and analytical point of view, is that it separates sample collection from sample analysis. This reduces the complexity of the vehicle test itself, which improves the success rate. Having the sample captured on a tube means that it can be analysed later, in batches for efficiency, and each sample can be analysed multiple times, which is useful for validation and uncertainty analysis. For the purposes of our tests, we use a two-dimensional gas chromatography (GCxGC) system coupled with a time-of-flight mass spectrometer (TOF-MS) from SepSolve Analytical and Markes International. The GCxGC achieves a separation of the hundreds of compounds that would not be possible in a one-dimensional system. The TOF-MS is crucial for identification of the compounds, as well as quantification, which is aided by other detectors such as a FID and electron capture detector (ECD) for N₂O.
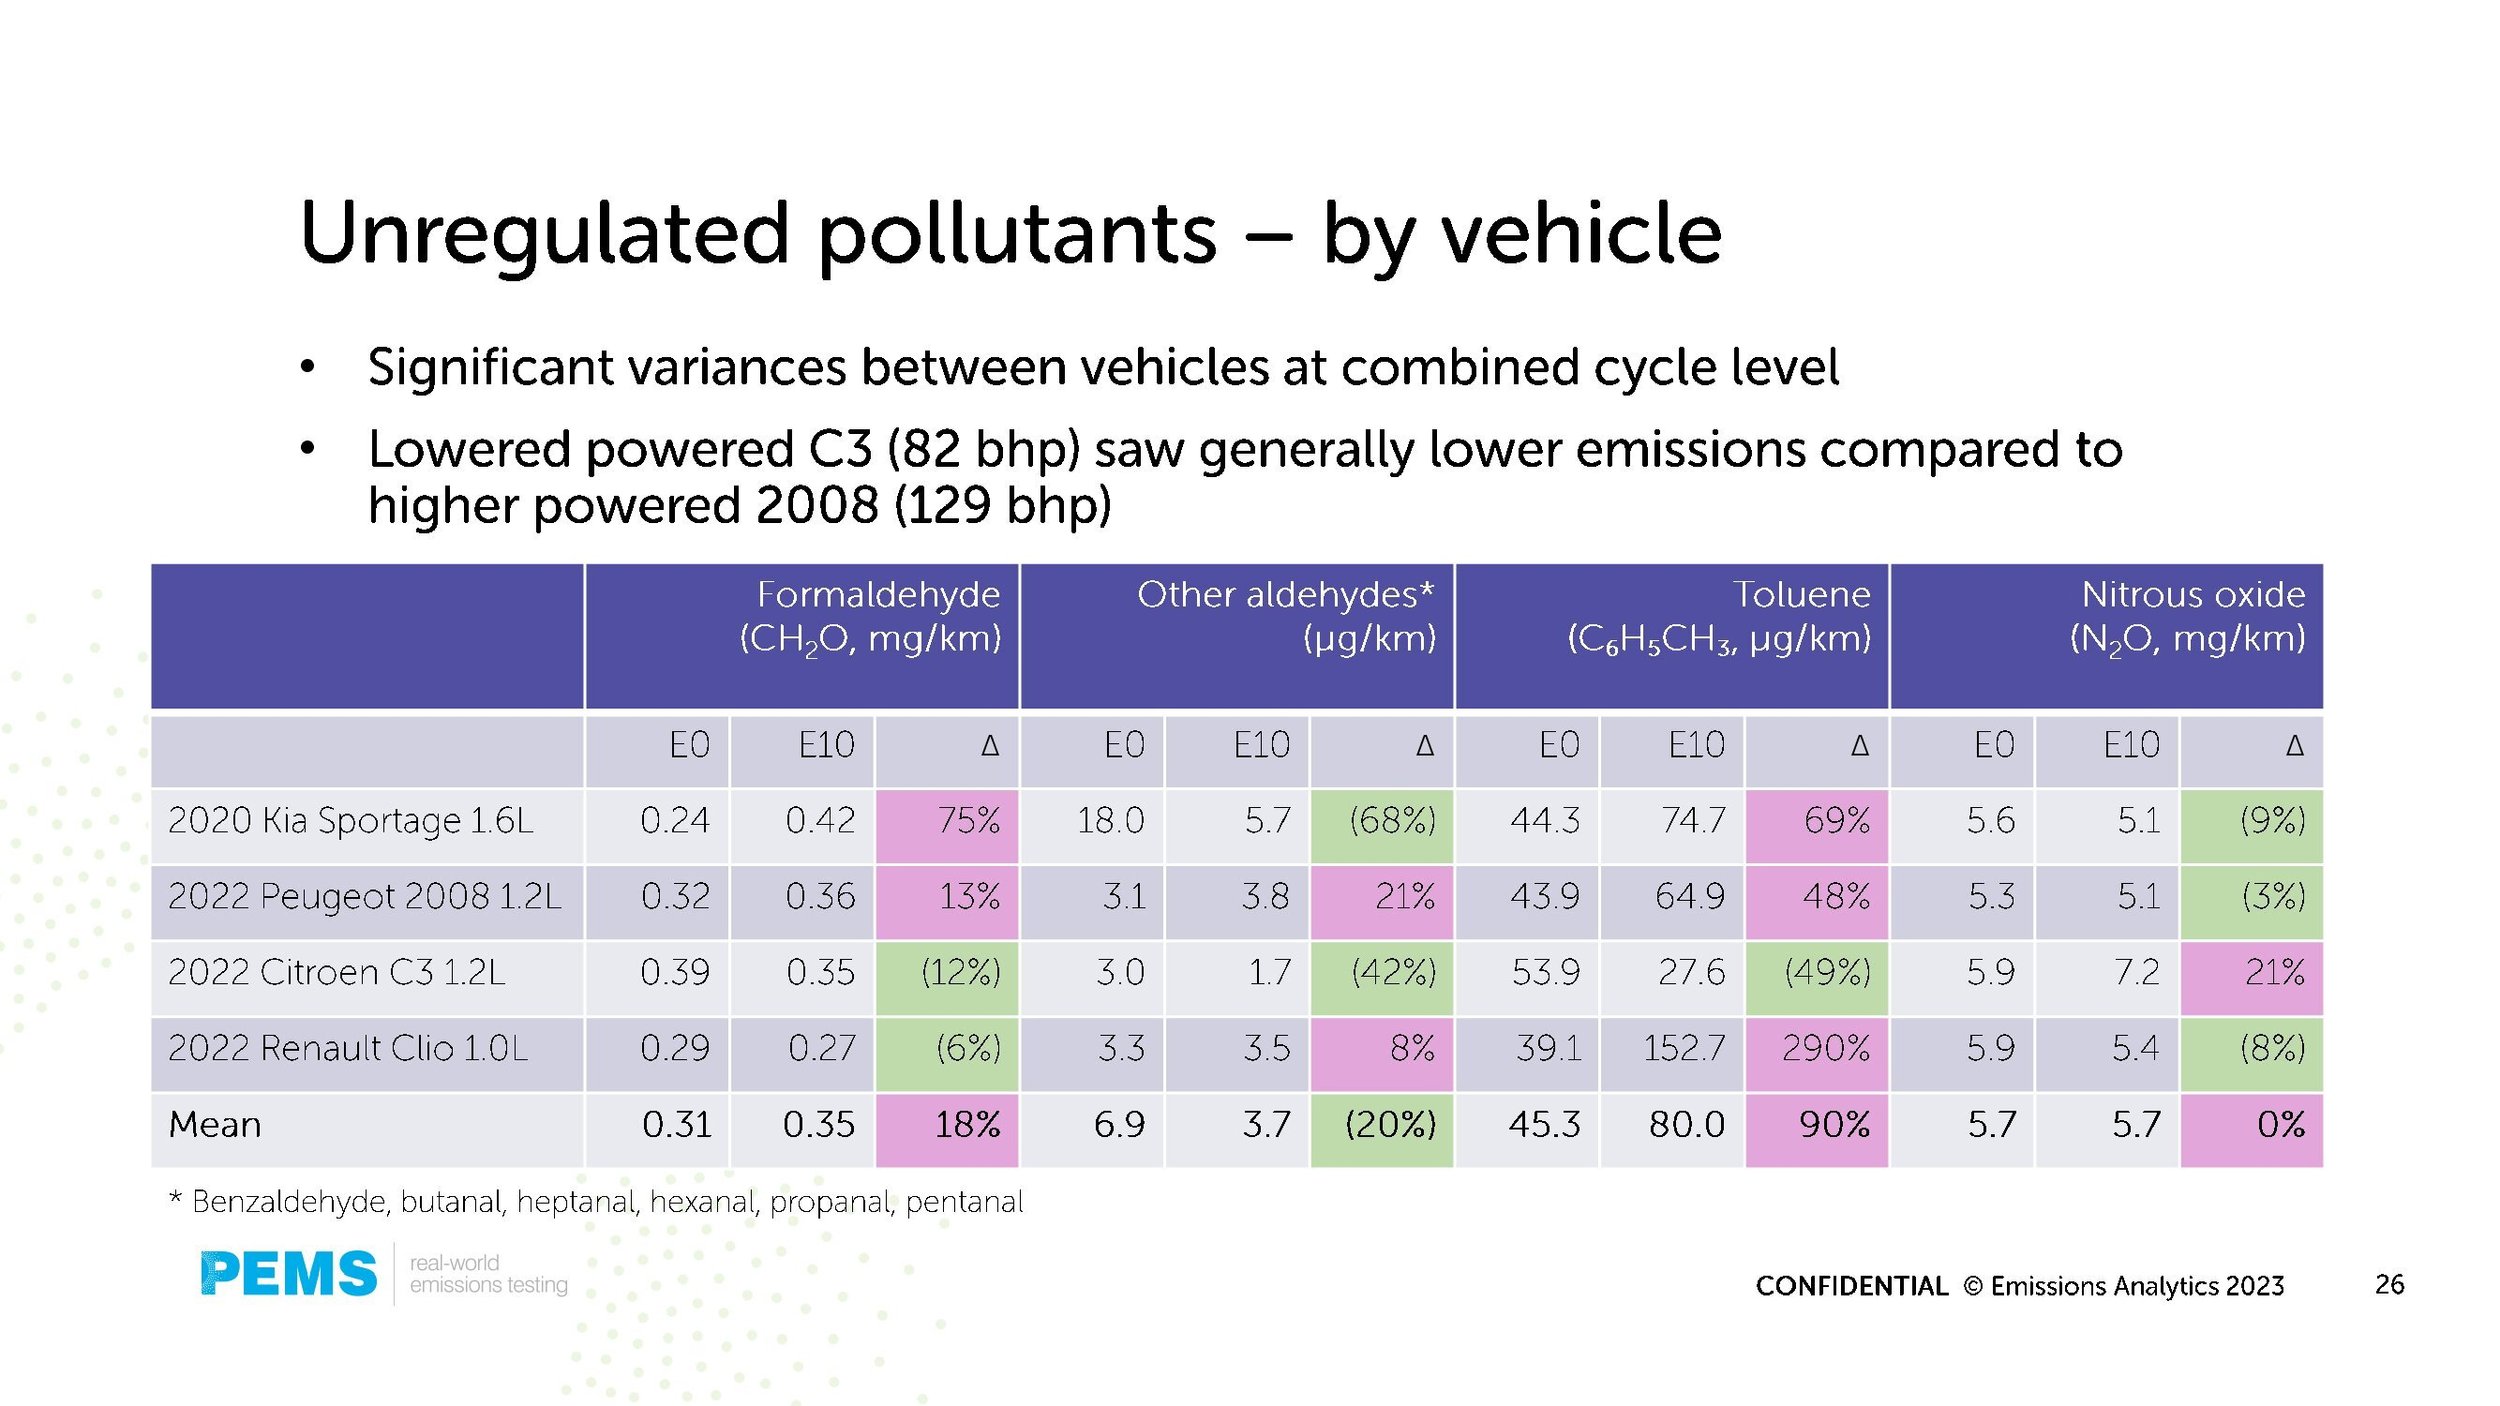
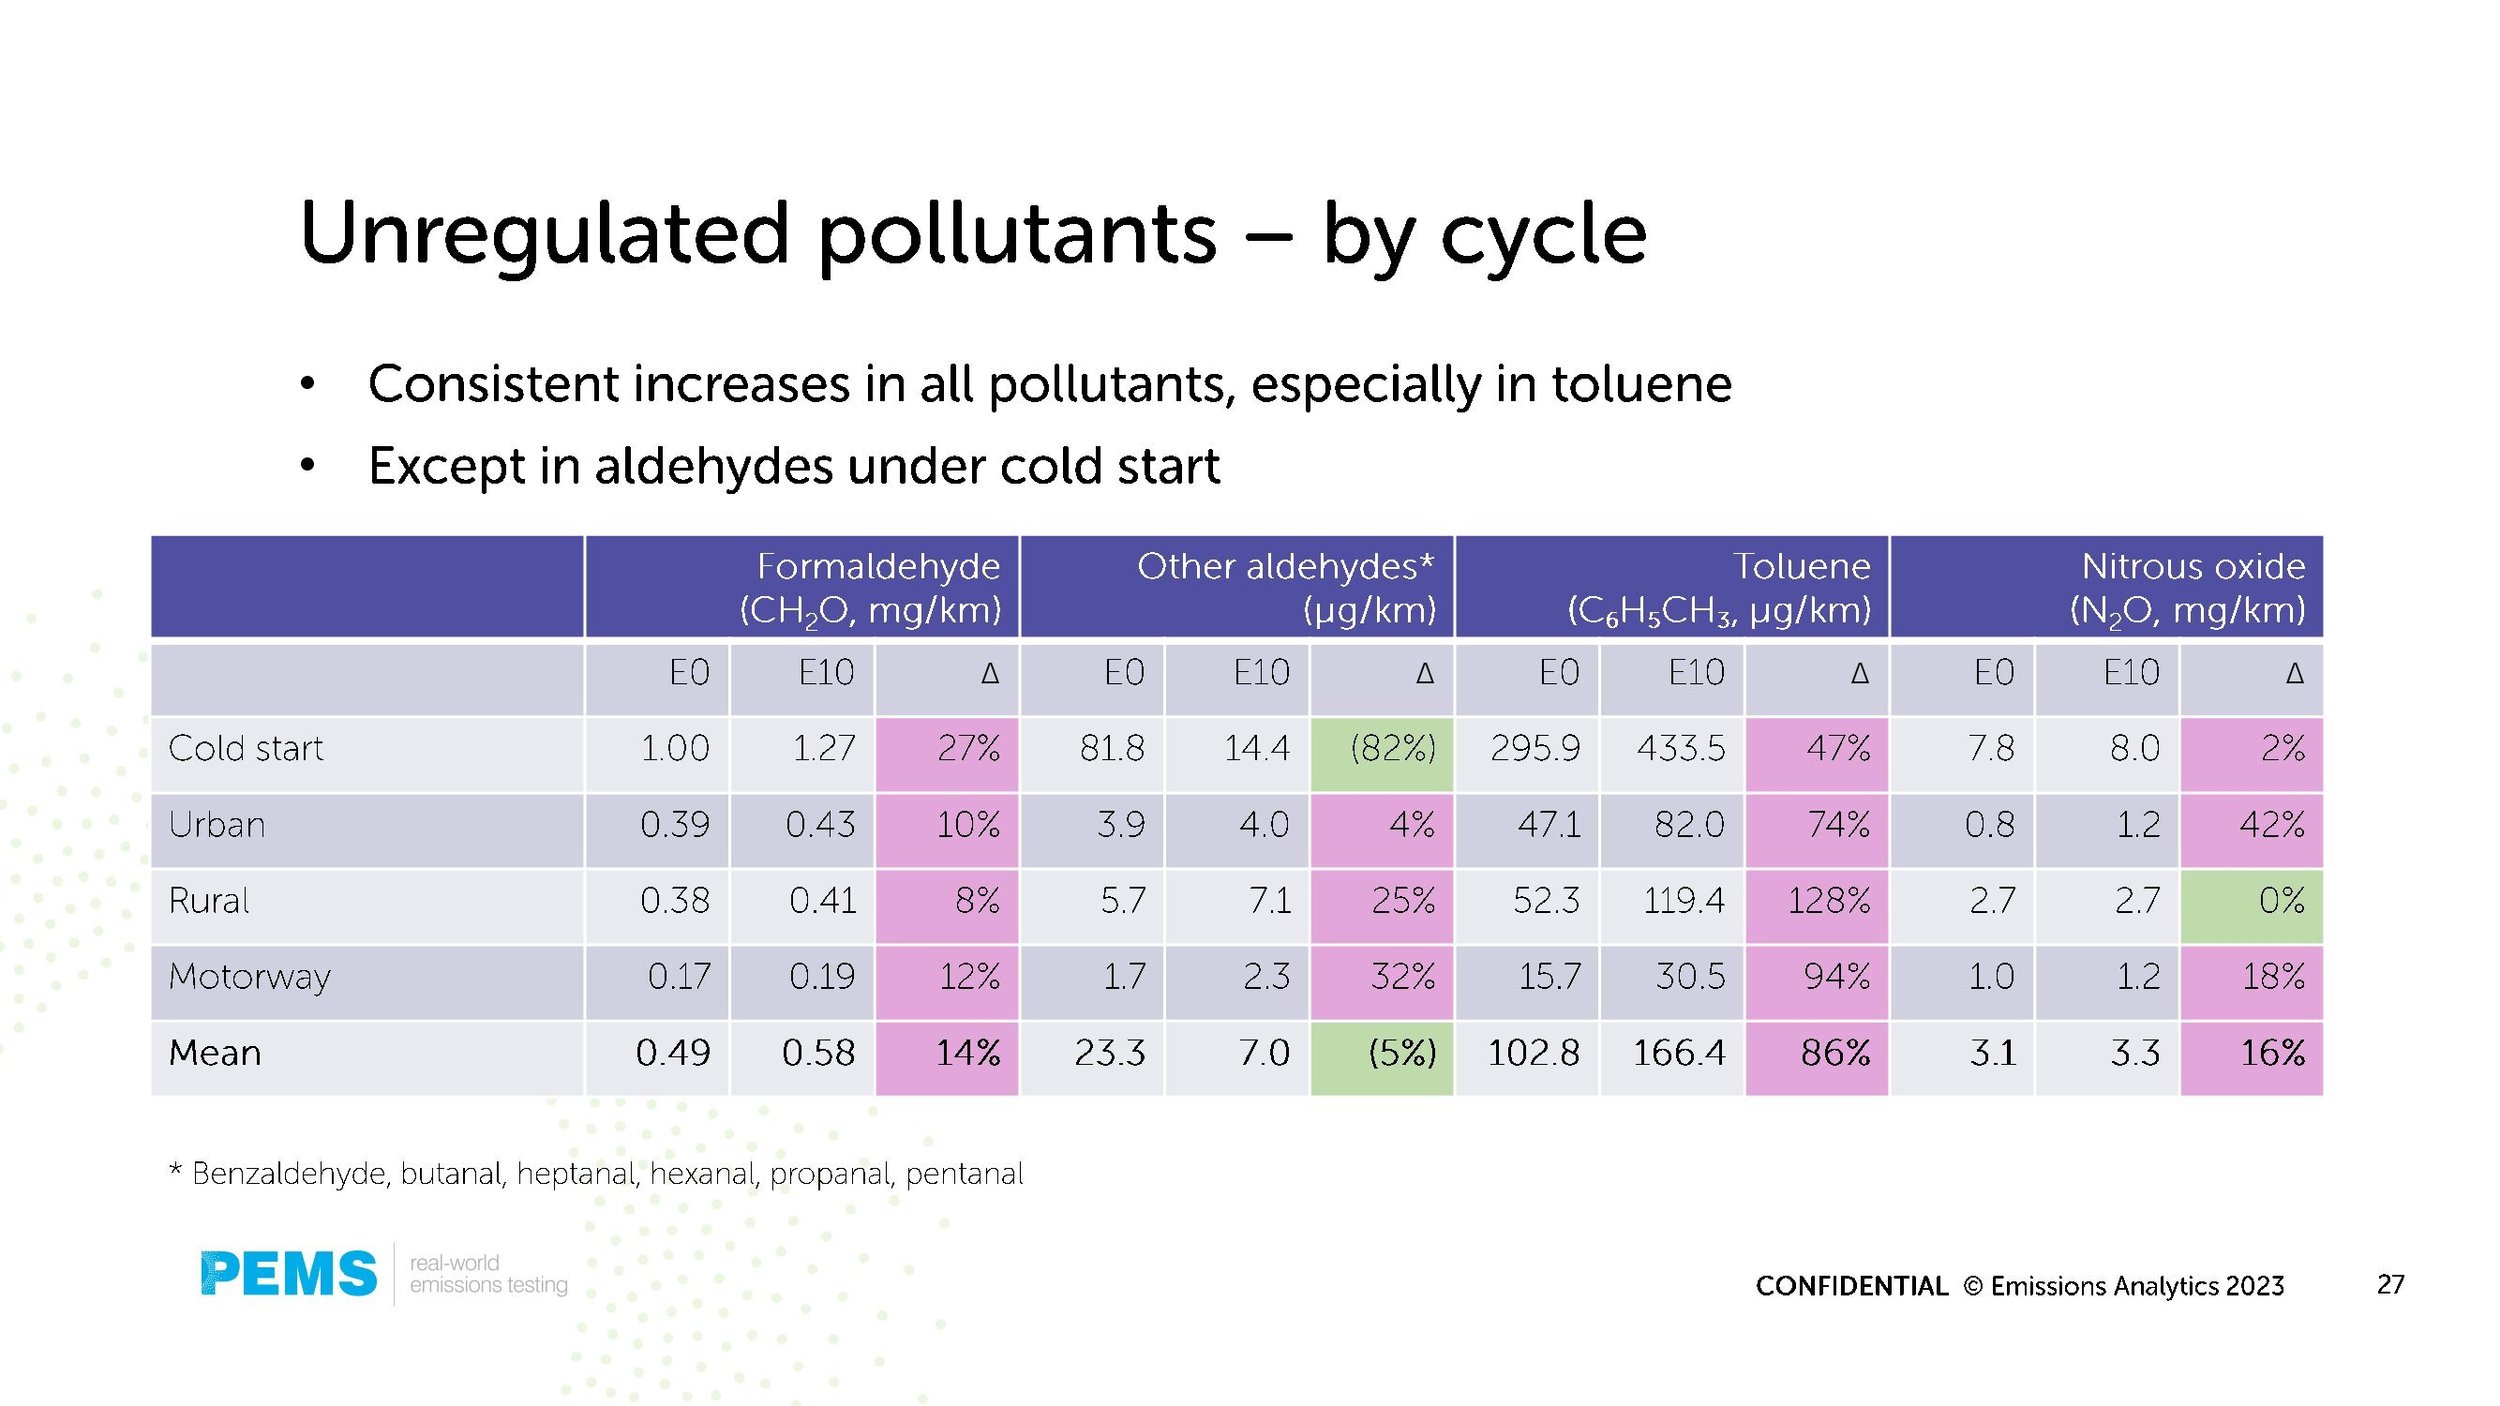
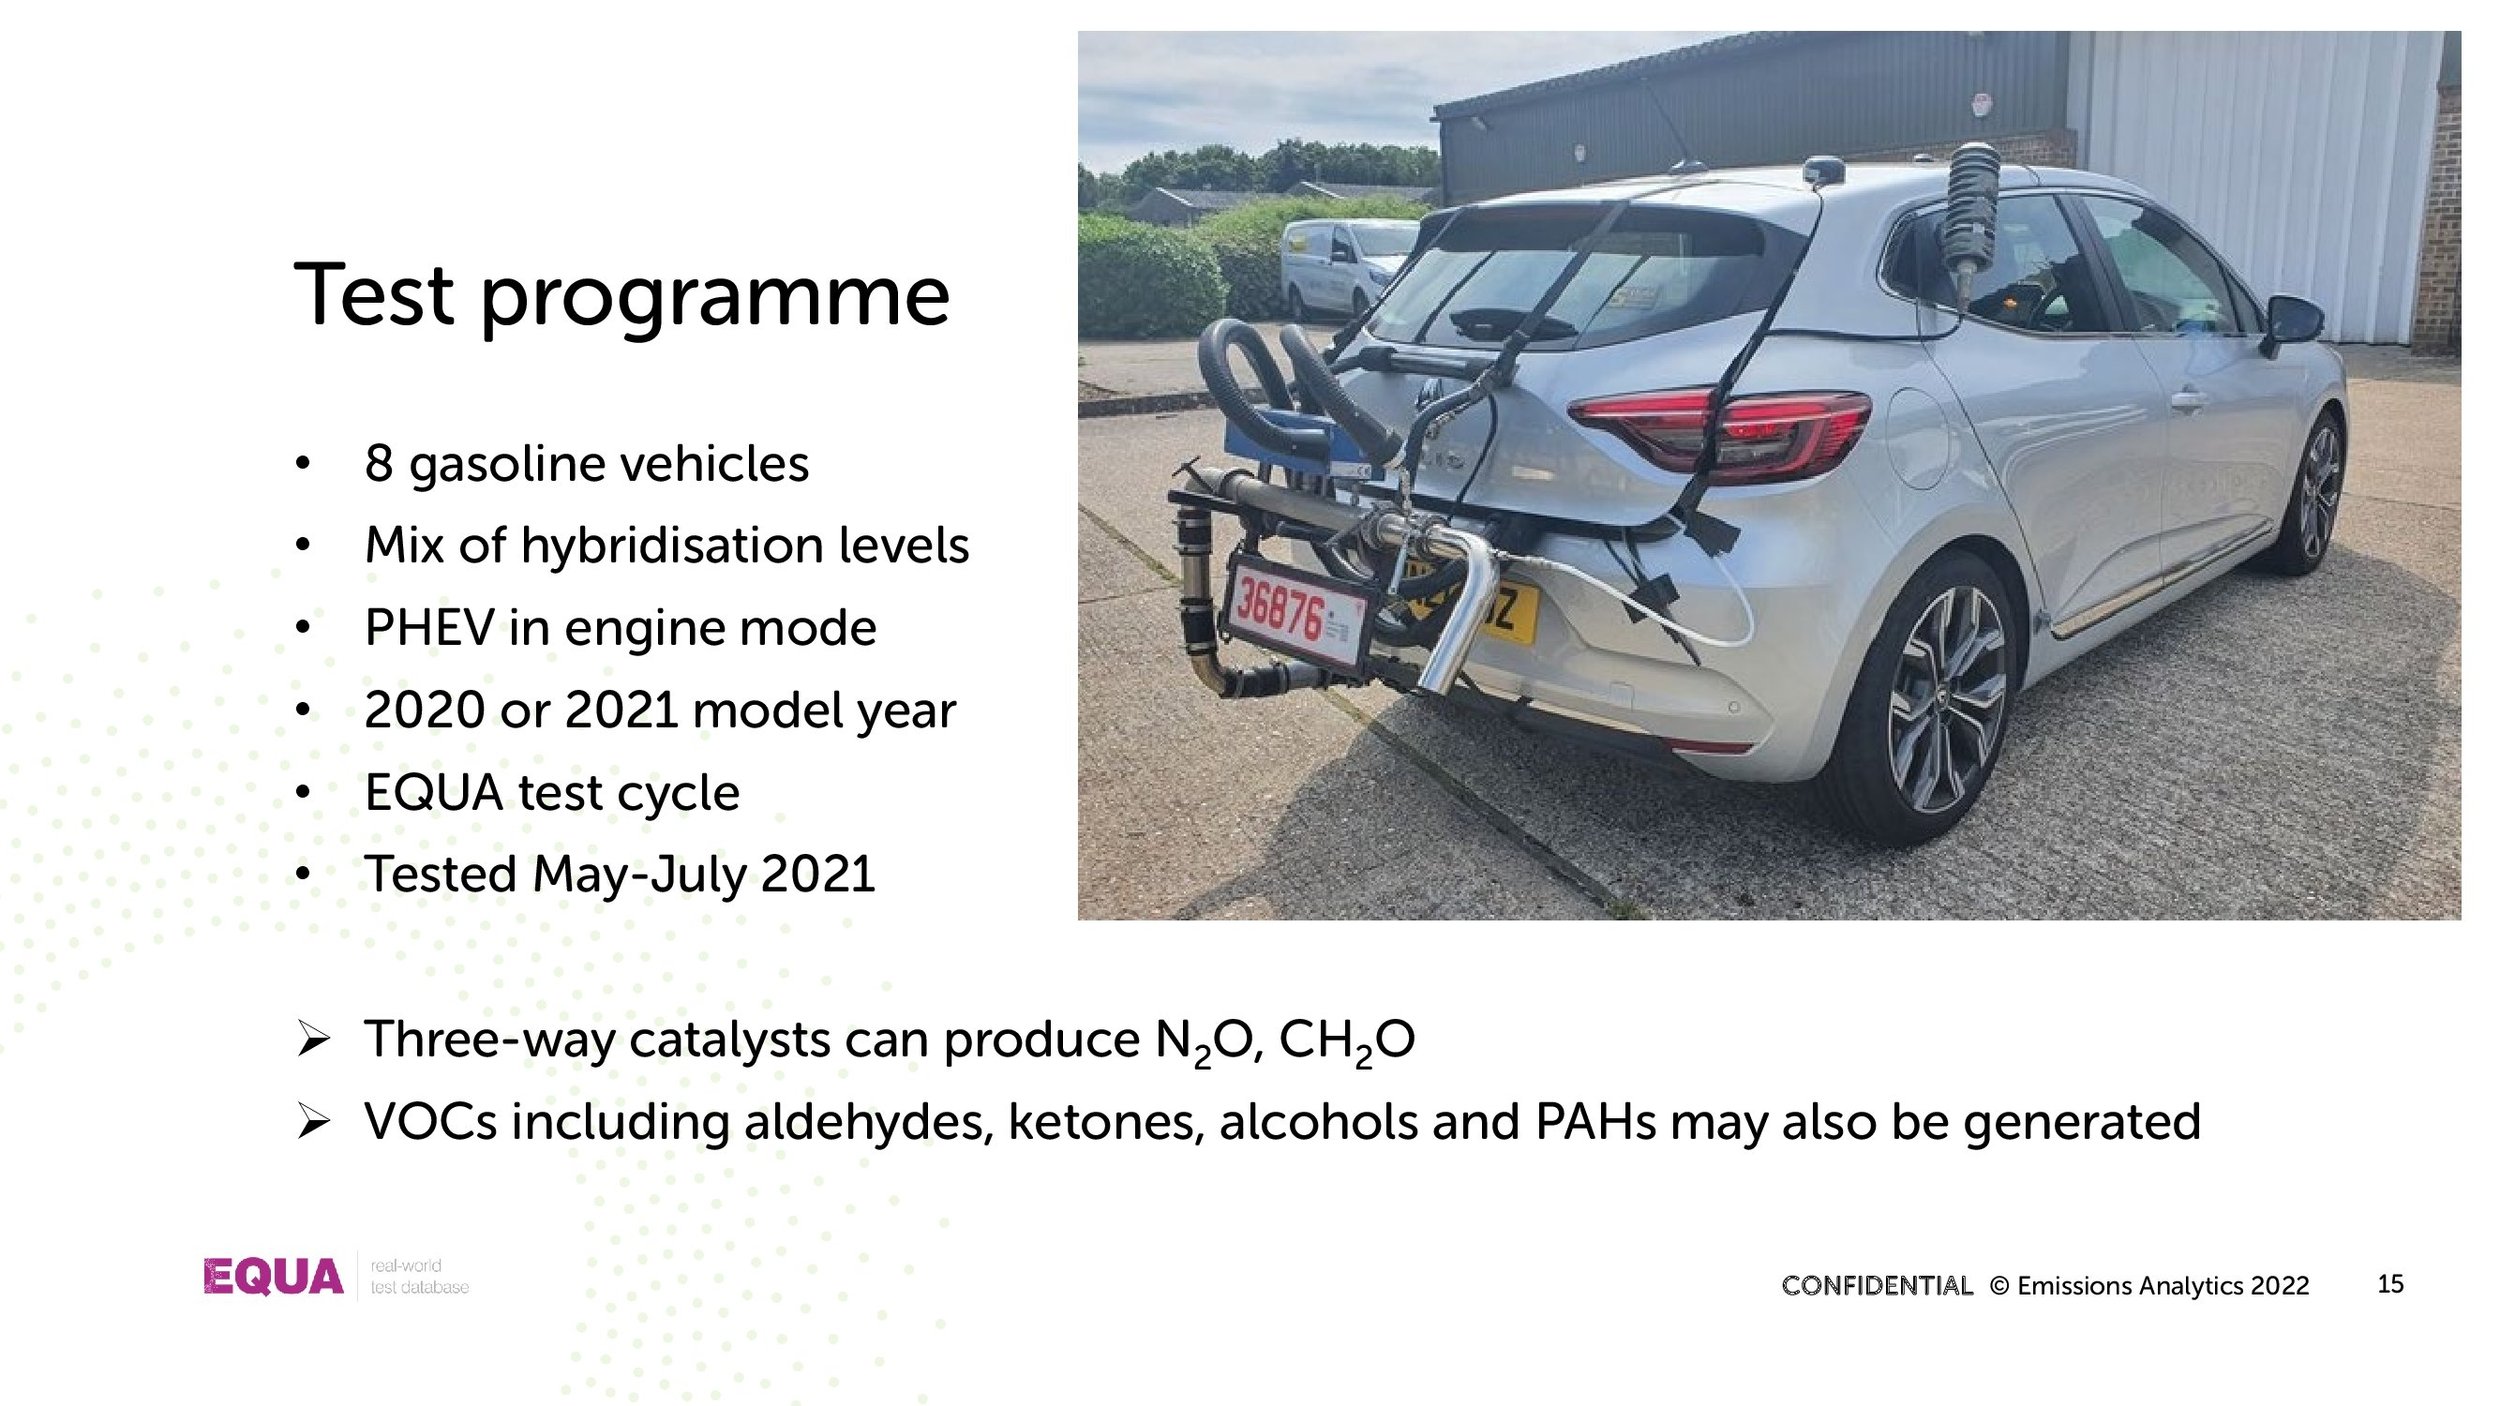
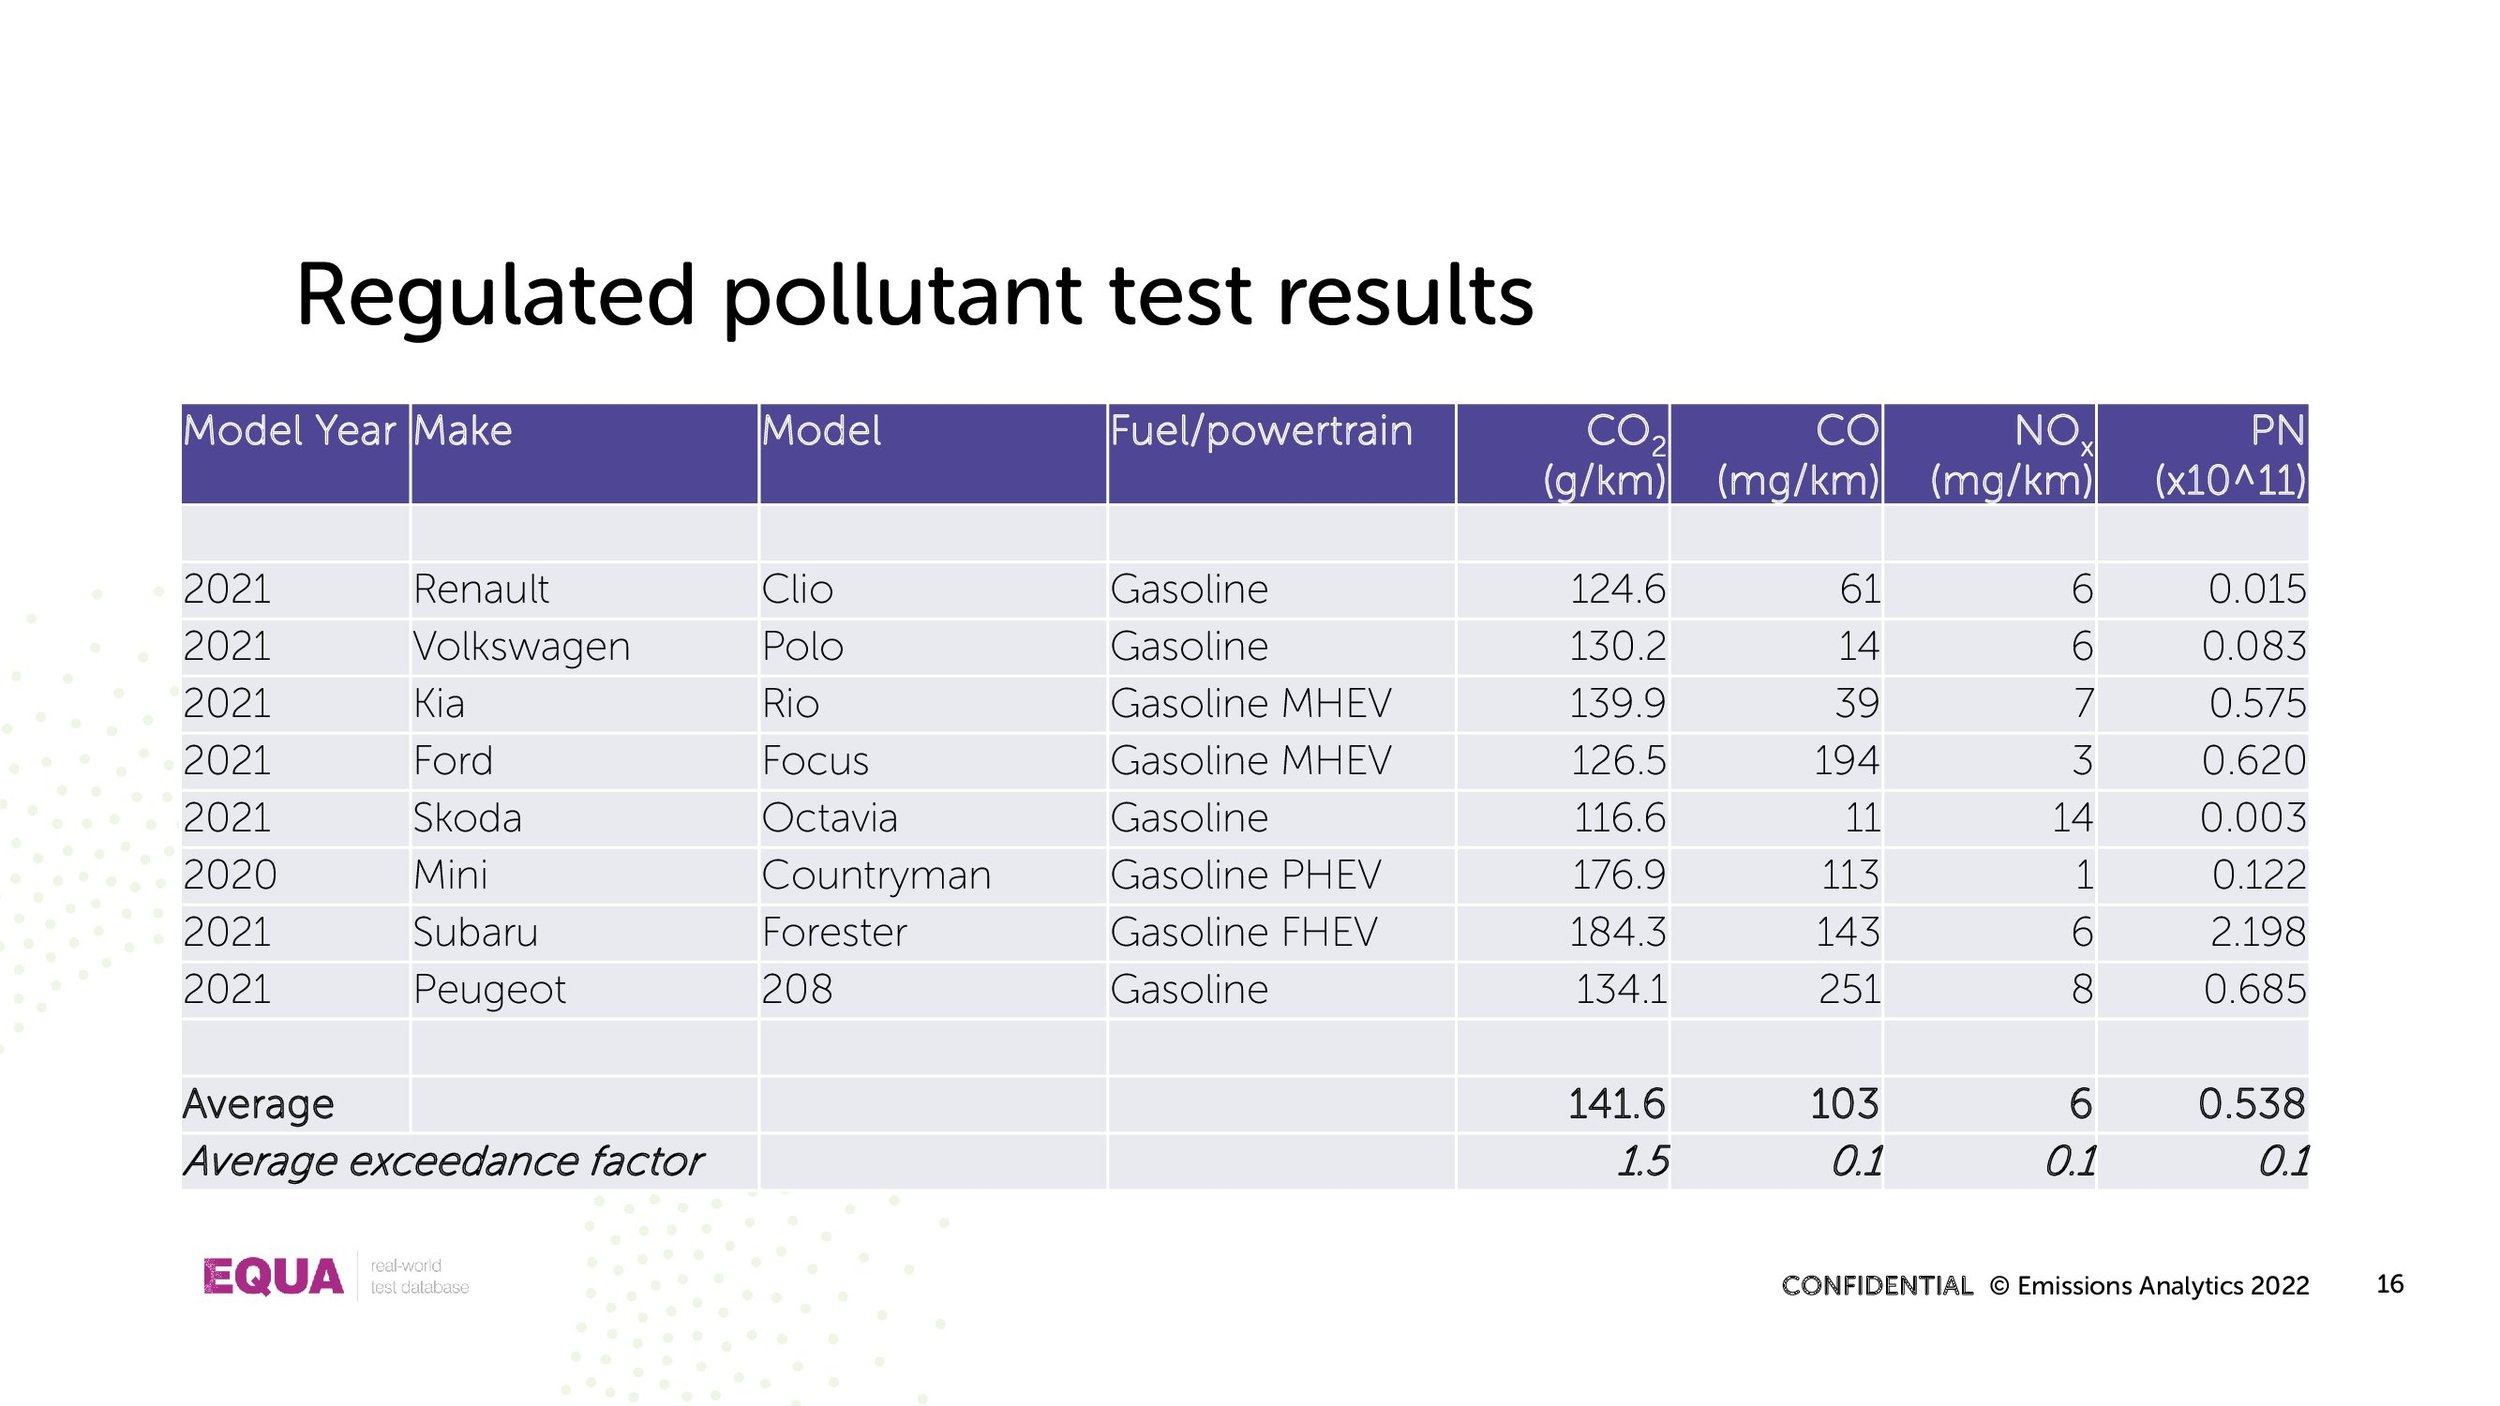
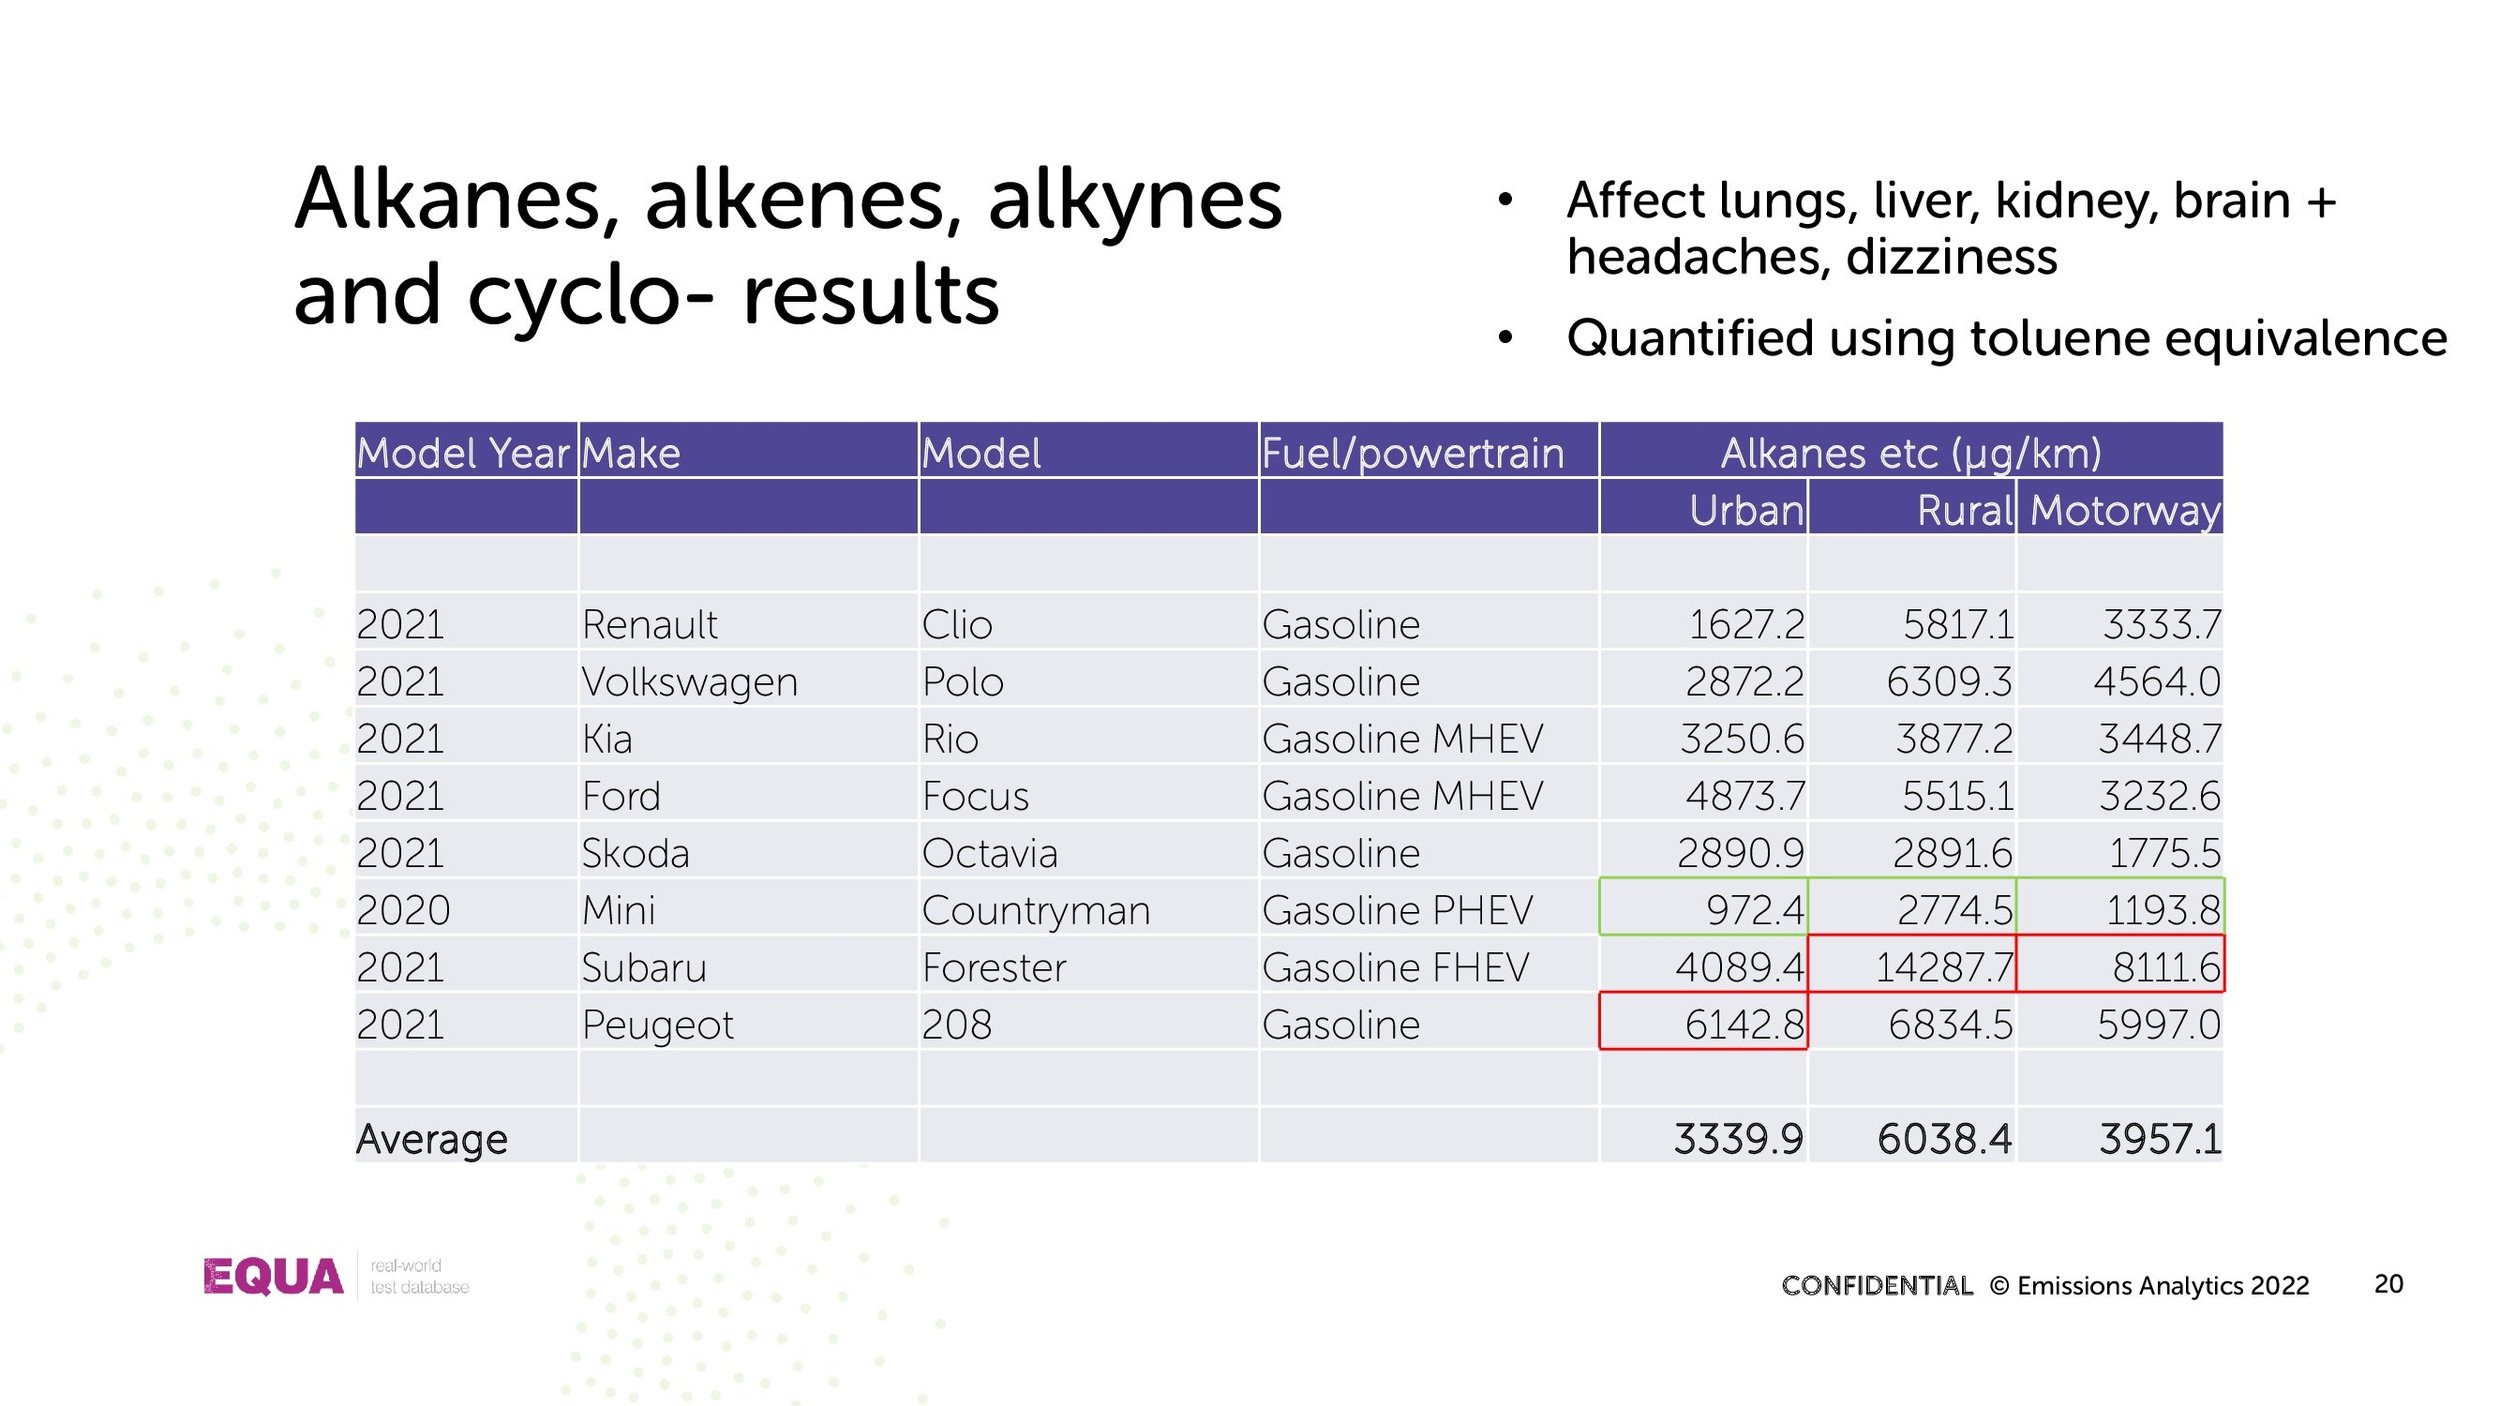
Putting these techniques into practice, Emissions Analytics tested eight recent gasoline vehicles in Europe. All were 2020 or 2021 model years, with four standard internal combustion engines, two mild hybrids, one full hybrid and one plug-in hybrid – drawn from eight different brands. All were tested on the standard EQUA Index test cycle set out in previous newsletters and the basis of all data in the Emissions Analytics’ subscription database. While similar to a certification Real Driving Emissions (RDE) test, it has a wider range of dynamic driving and is about twice as long.
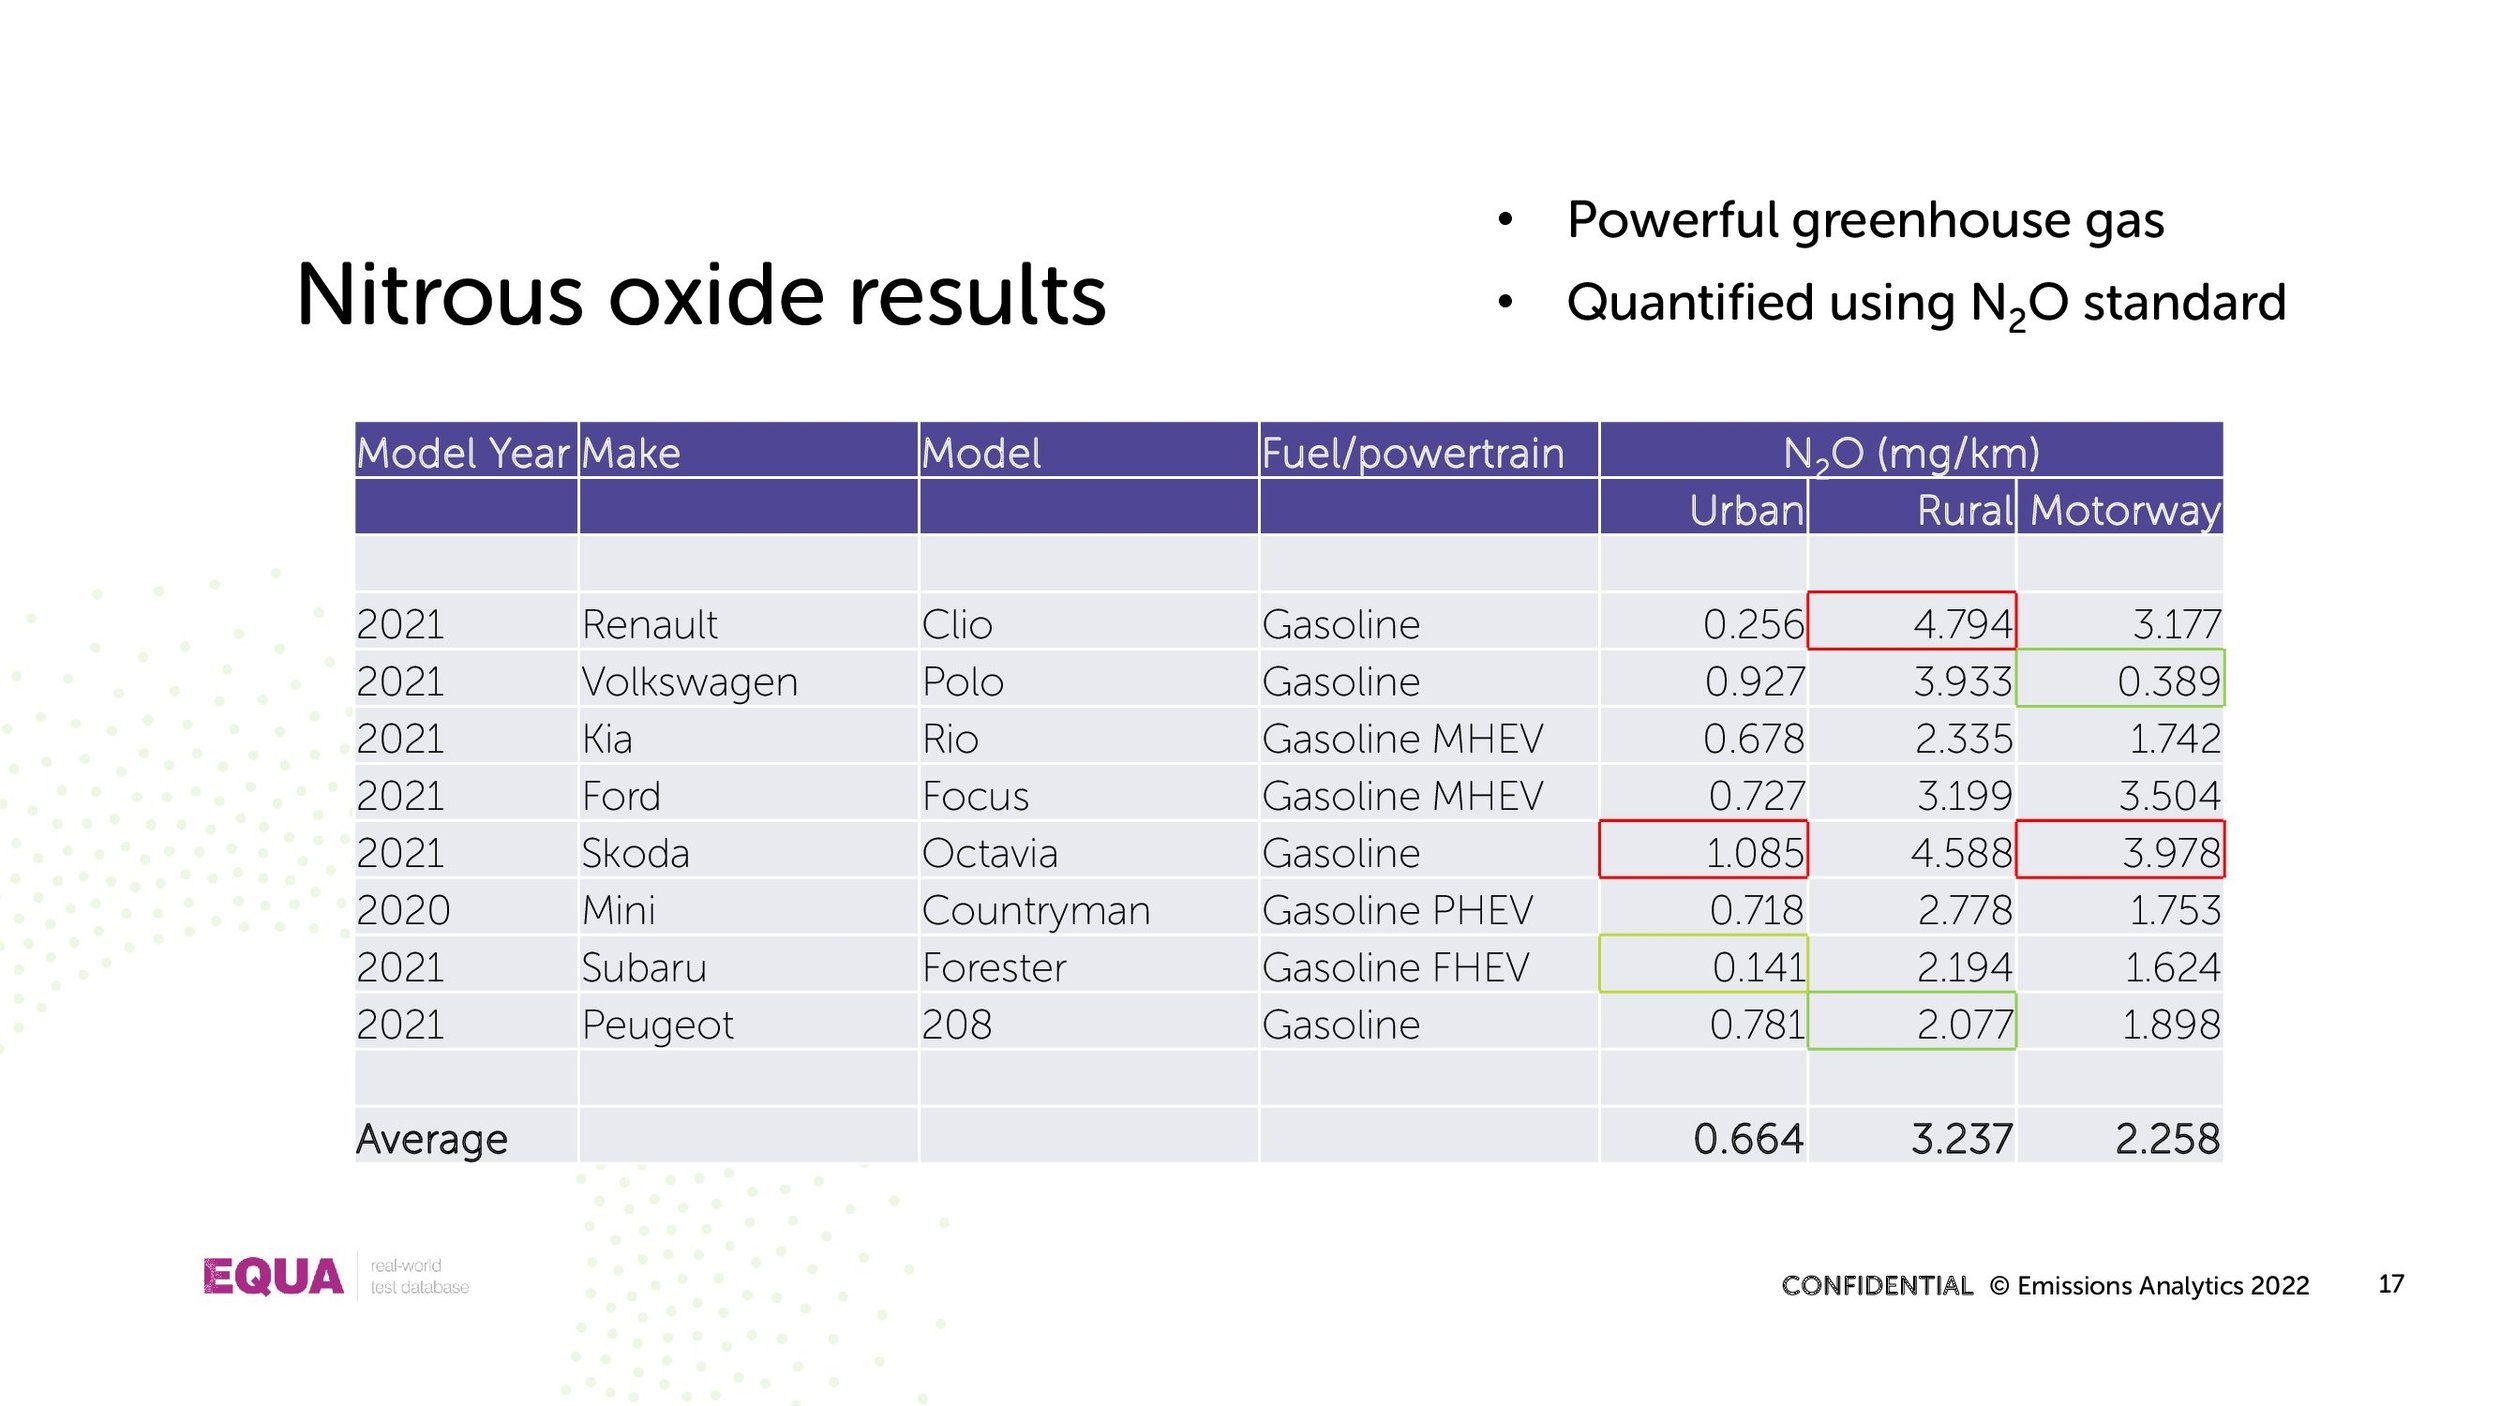
The N₂O results are set out in the table below, split between urban, rural and motorway driving. In each case the highest and lowest emitting cars are highlighted. Greatest emissions were seen in rural driving, with urban driving the lowest.

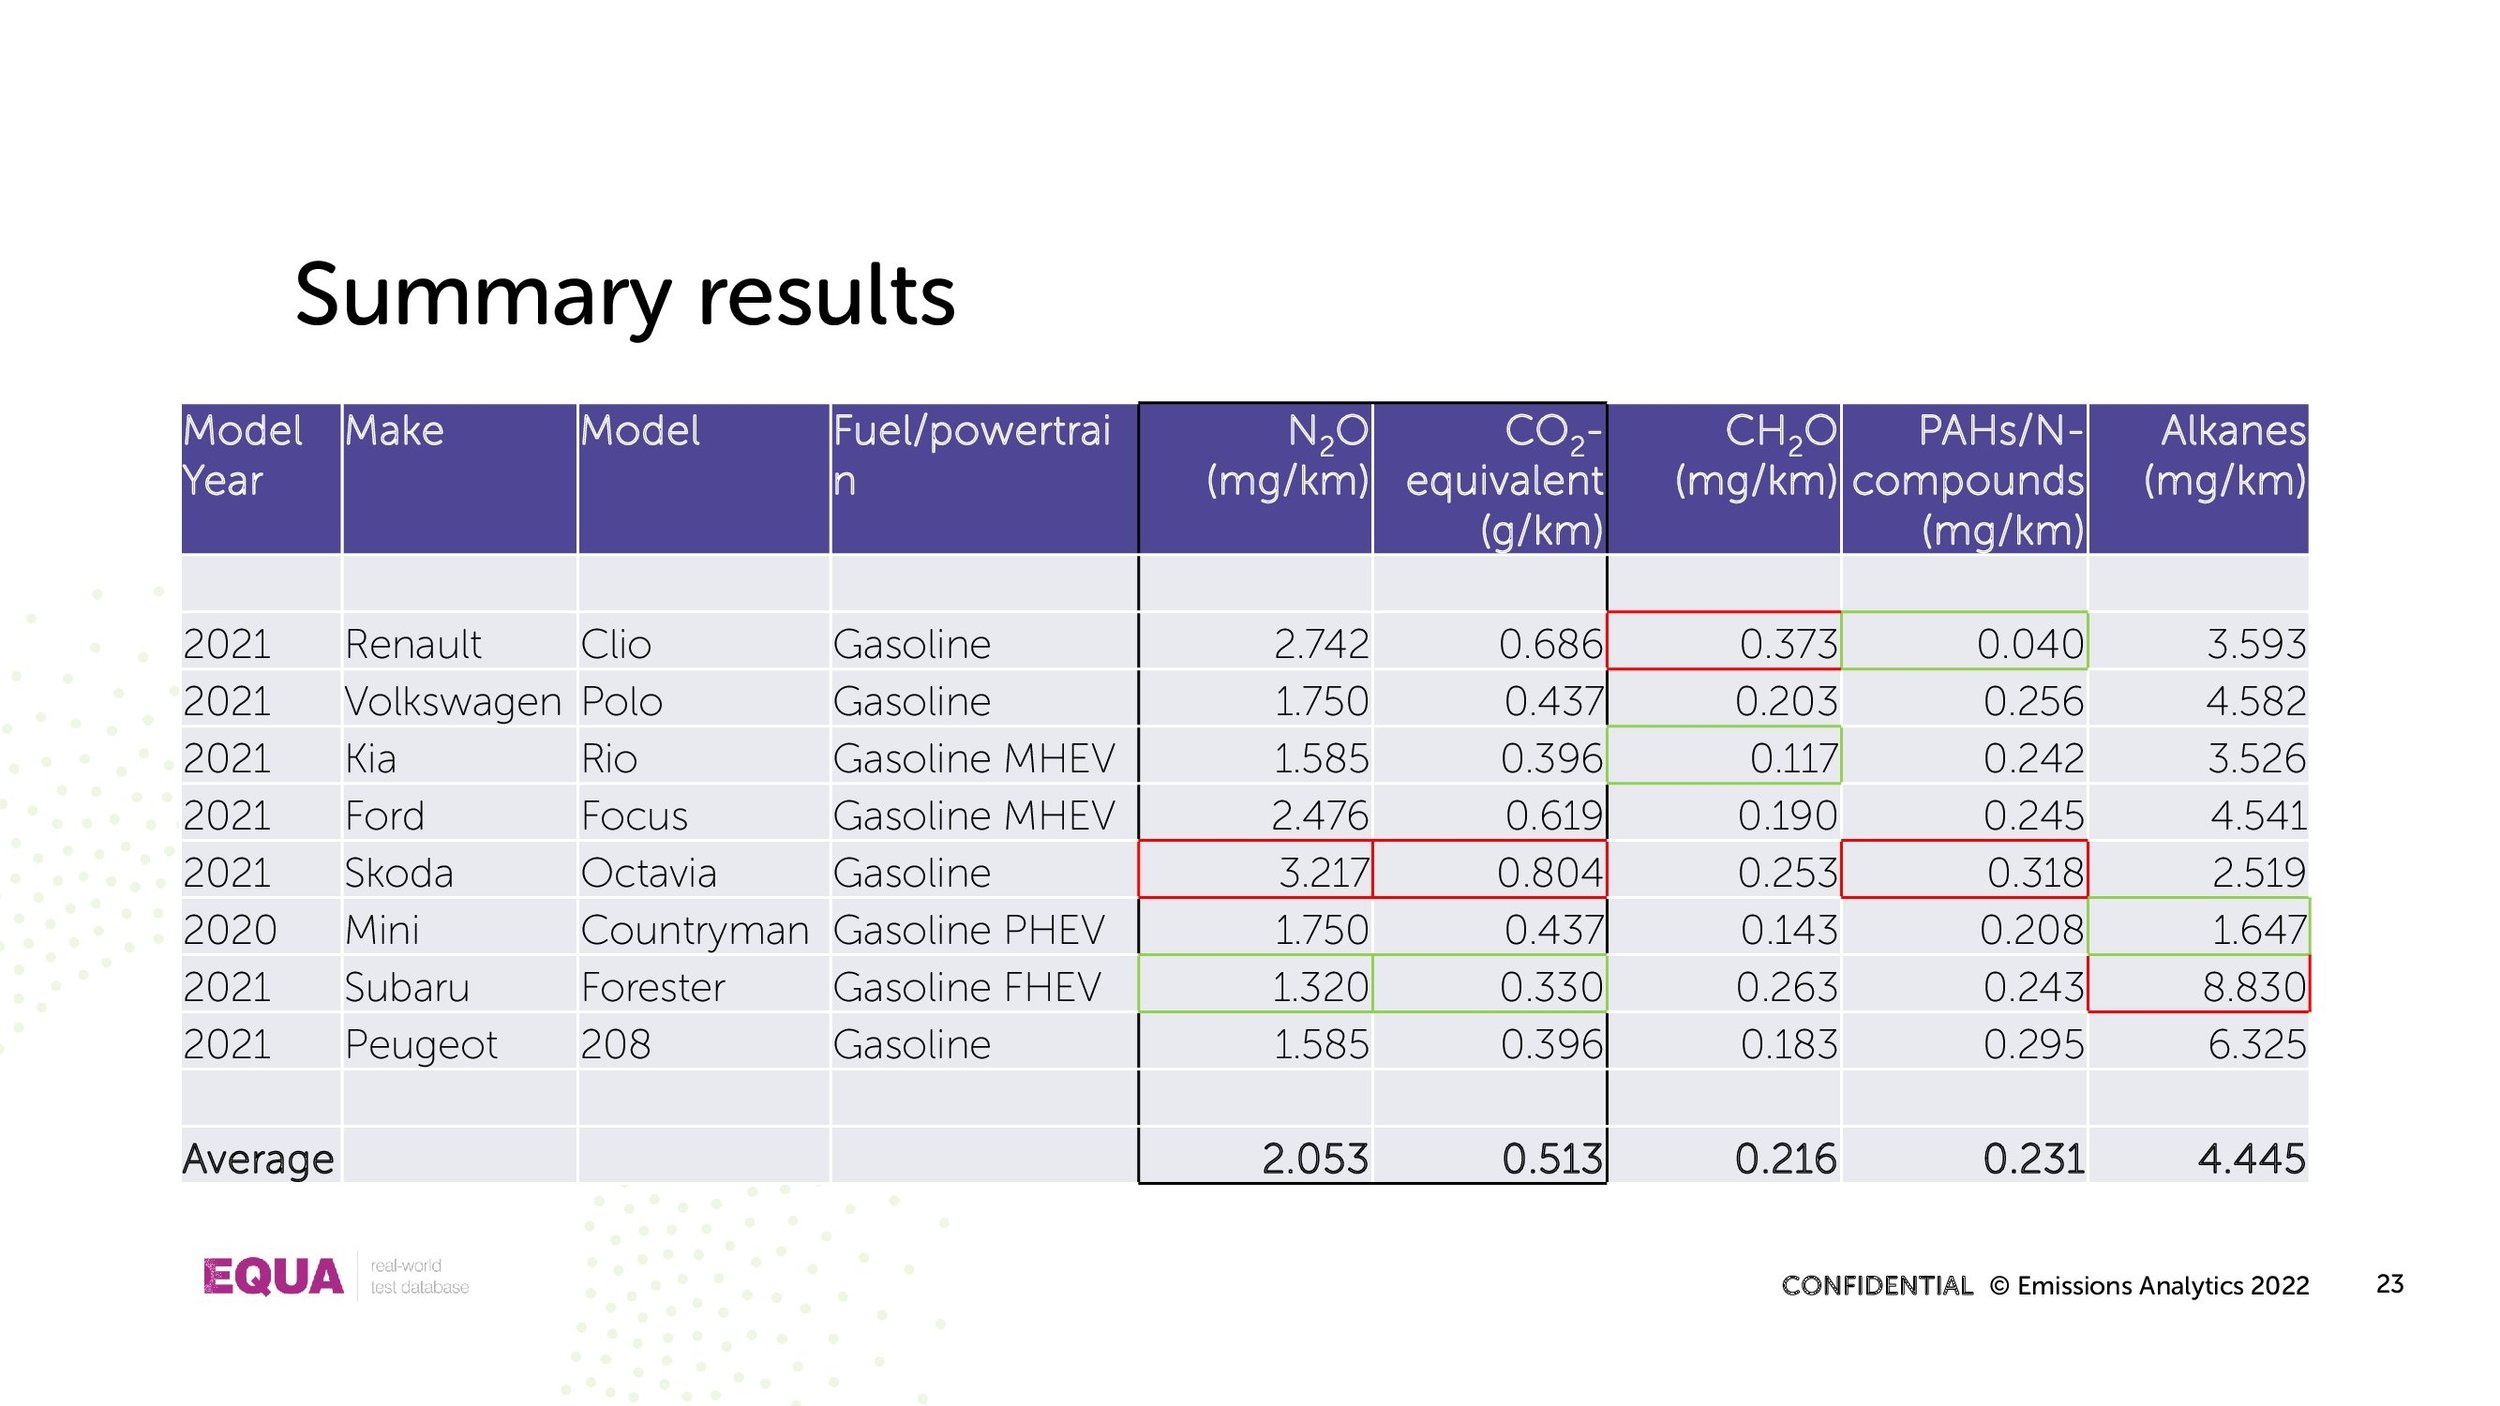
Emissions of N₂O are potentially important as the gas is a much more powerful greenhouse gas than carbon dioxide (CO2). Over a 100-year horizon, it has warming potential 265 times greater2. Therefore, small amounts of N₂O could undermine the extensive efforts to reduce primary CO2 from engines. On average, across the eight vehicles and three driving modes, the N₂O emissions were 2.1 mg/km. Converted to an equivalent CO2 this is just above half a gram. Real-world CO2 emissions of these test vehicles averaged 142 g/km. Therefore, these N₂O emissions were equivalent to well below 1% of total CO2 – within the measurement error of the CO2 value.
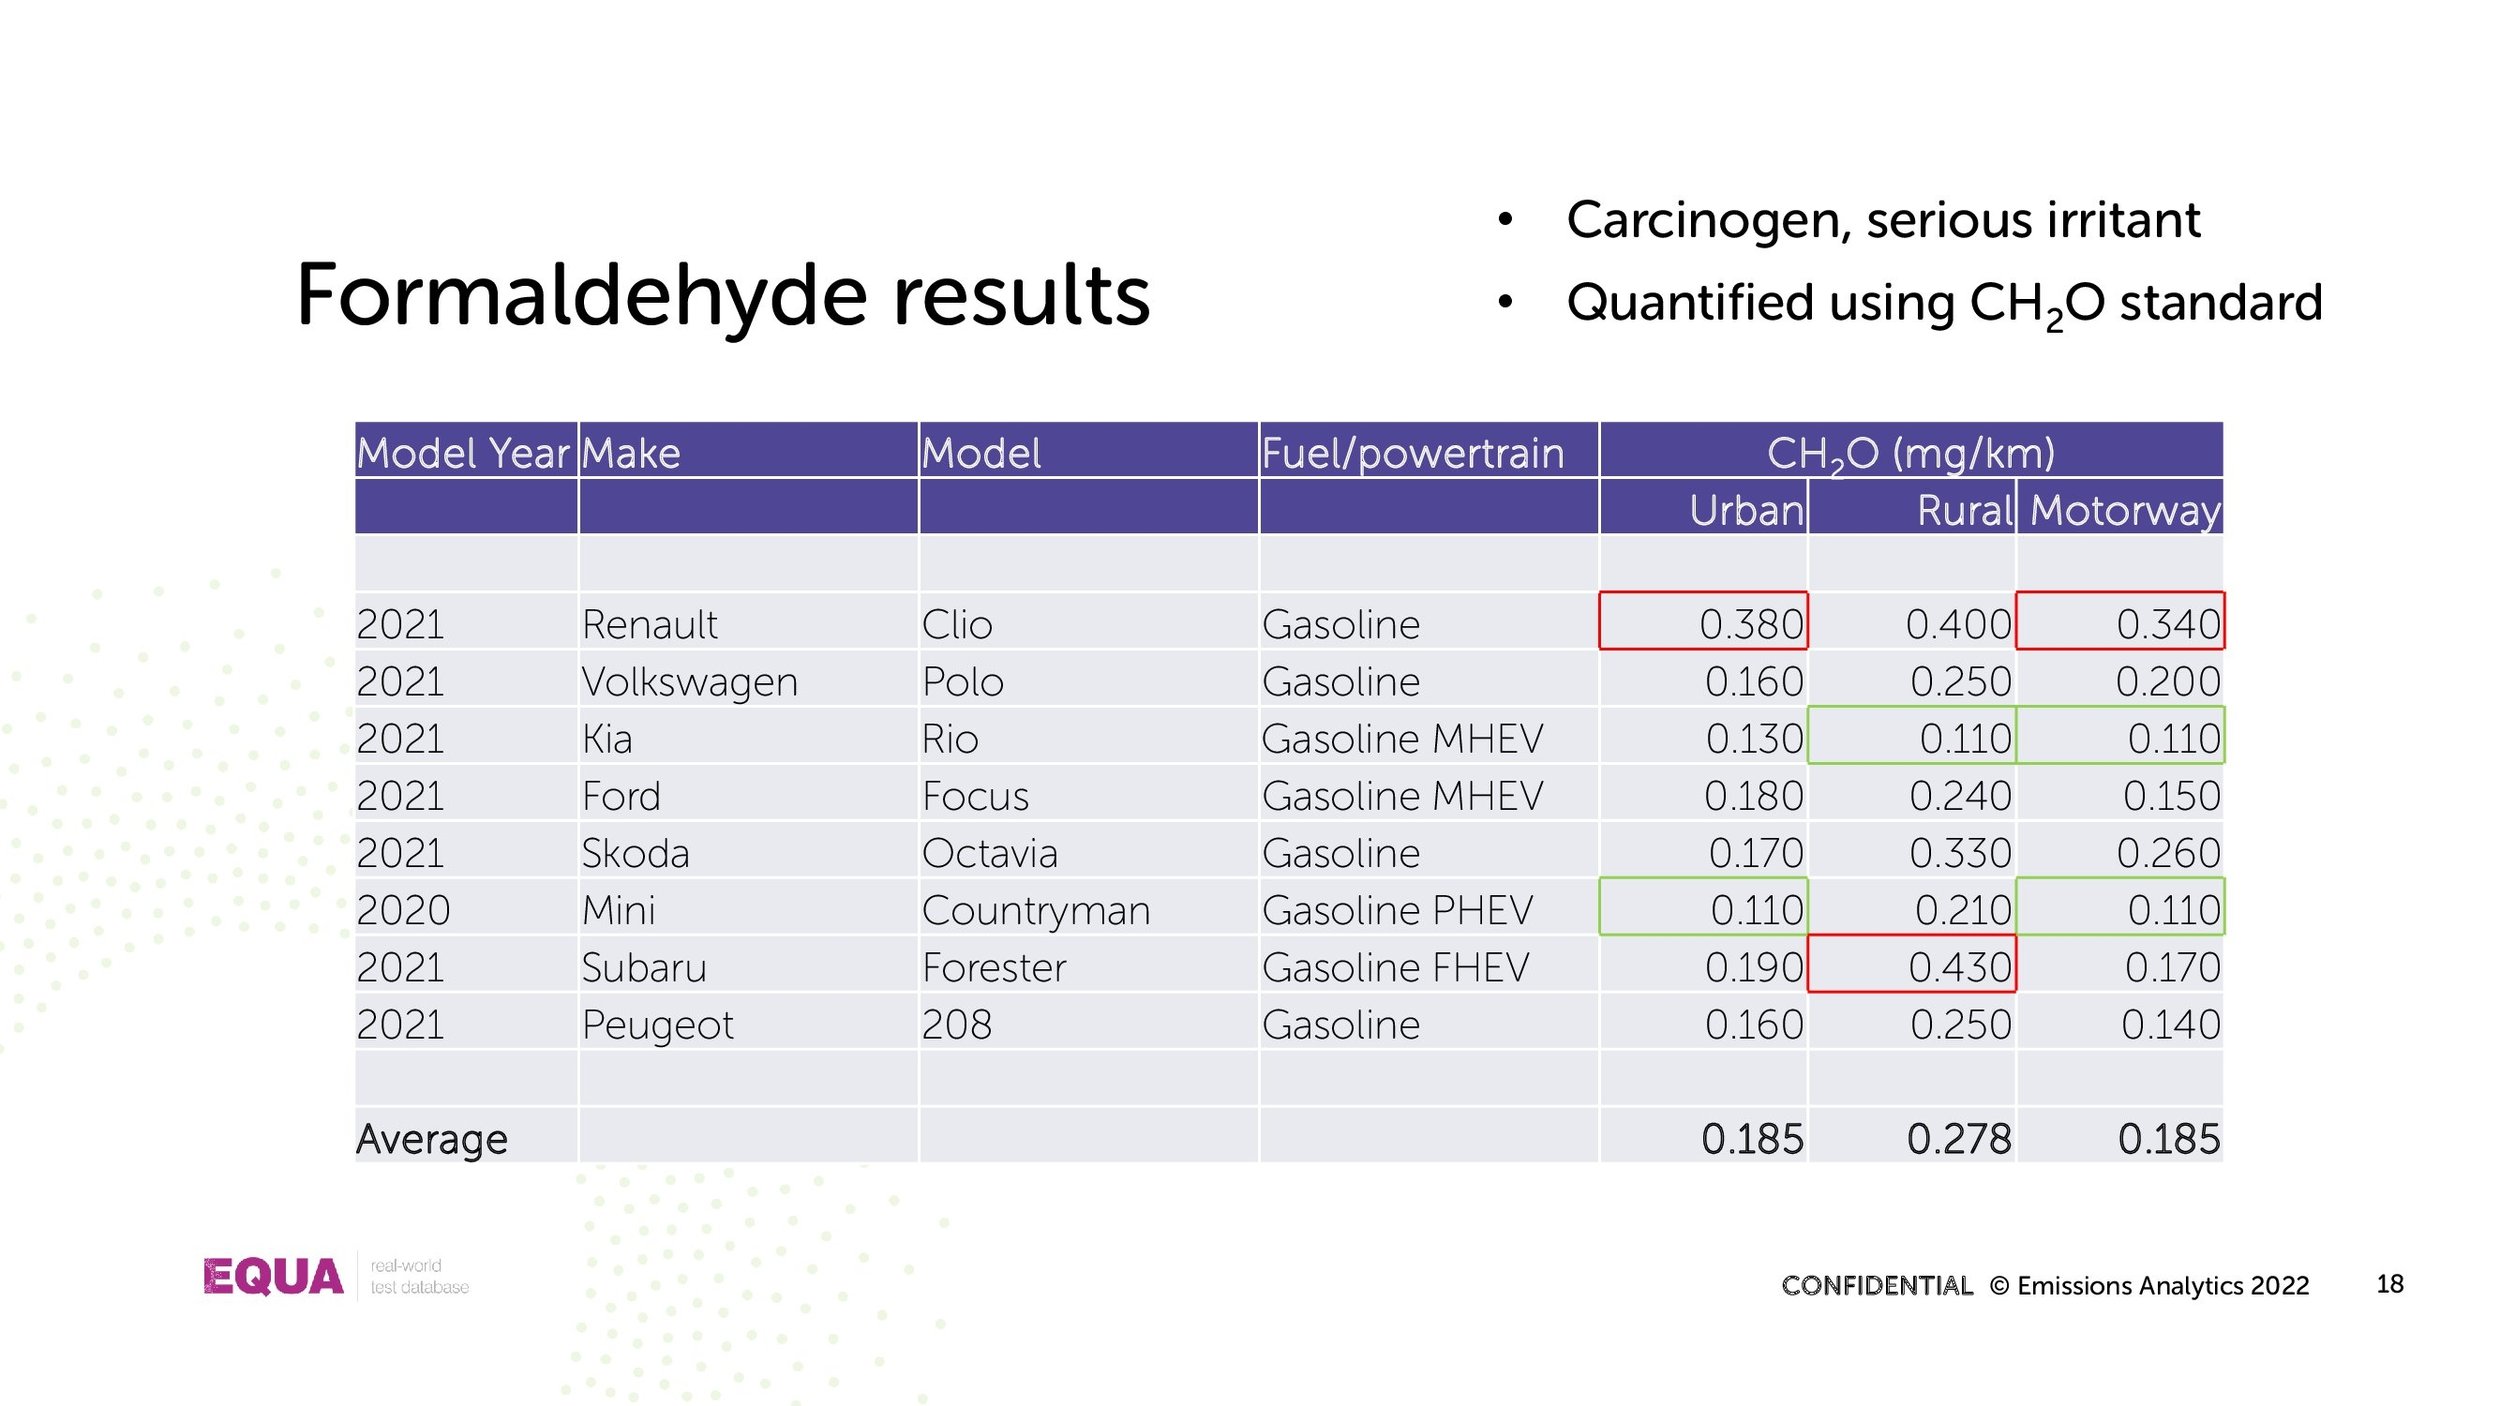
Formaldehyde is a pollutant of concern as it is believed to be carcinogenic and causes a wide range of irritation in humans, including to skin, eyes and lungs. The results from the same eight vehicles are shown below.

Again, highest emissions were seen in rural driving. Although the exact human health effects depend on factors such as the dilution and dispersion of the emissions, it can be seen from the data that there is about a factor of four difference between the cleanest and dirtiest cars.
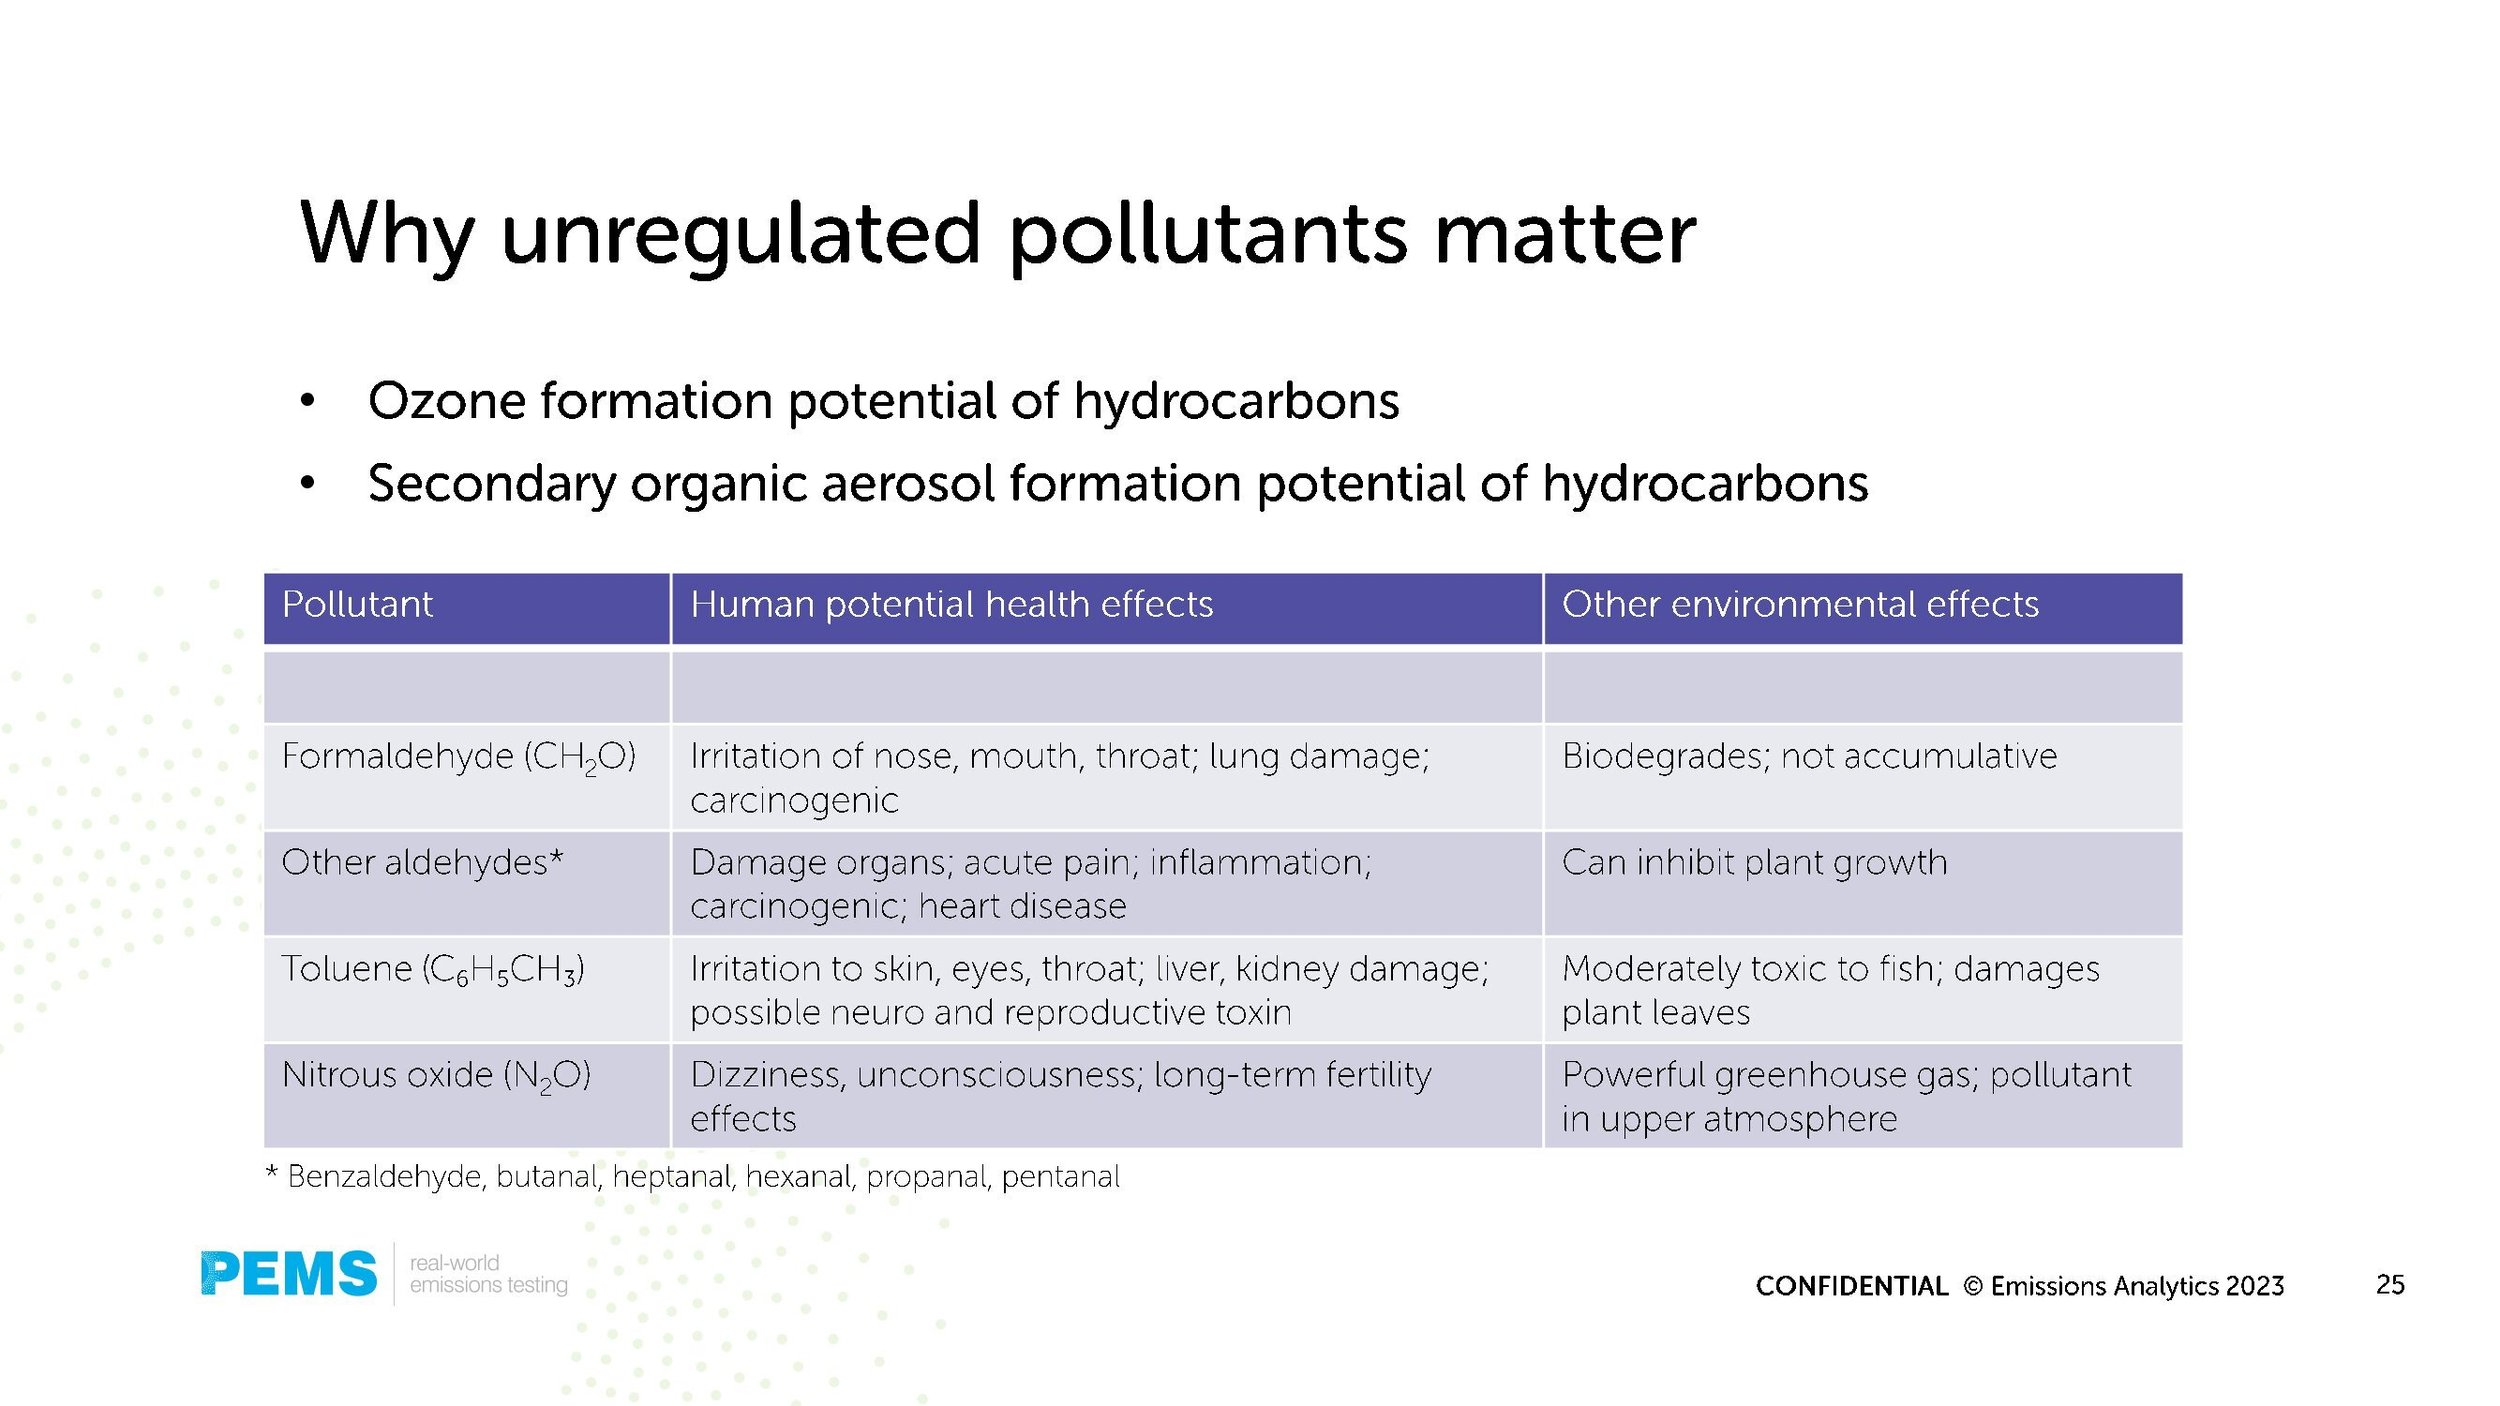
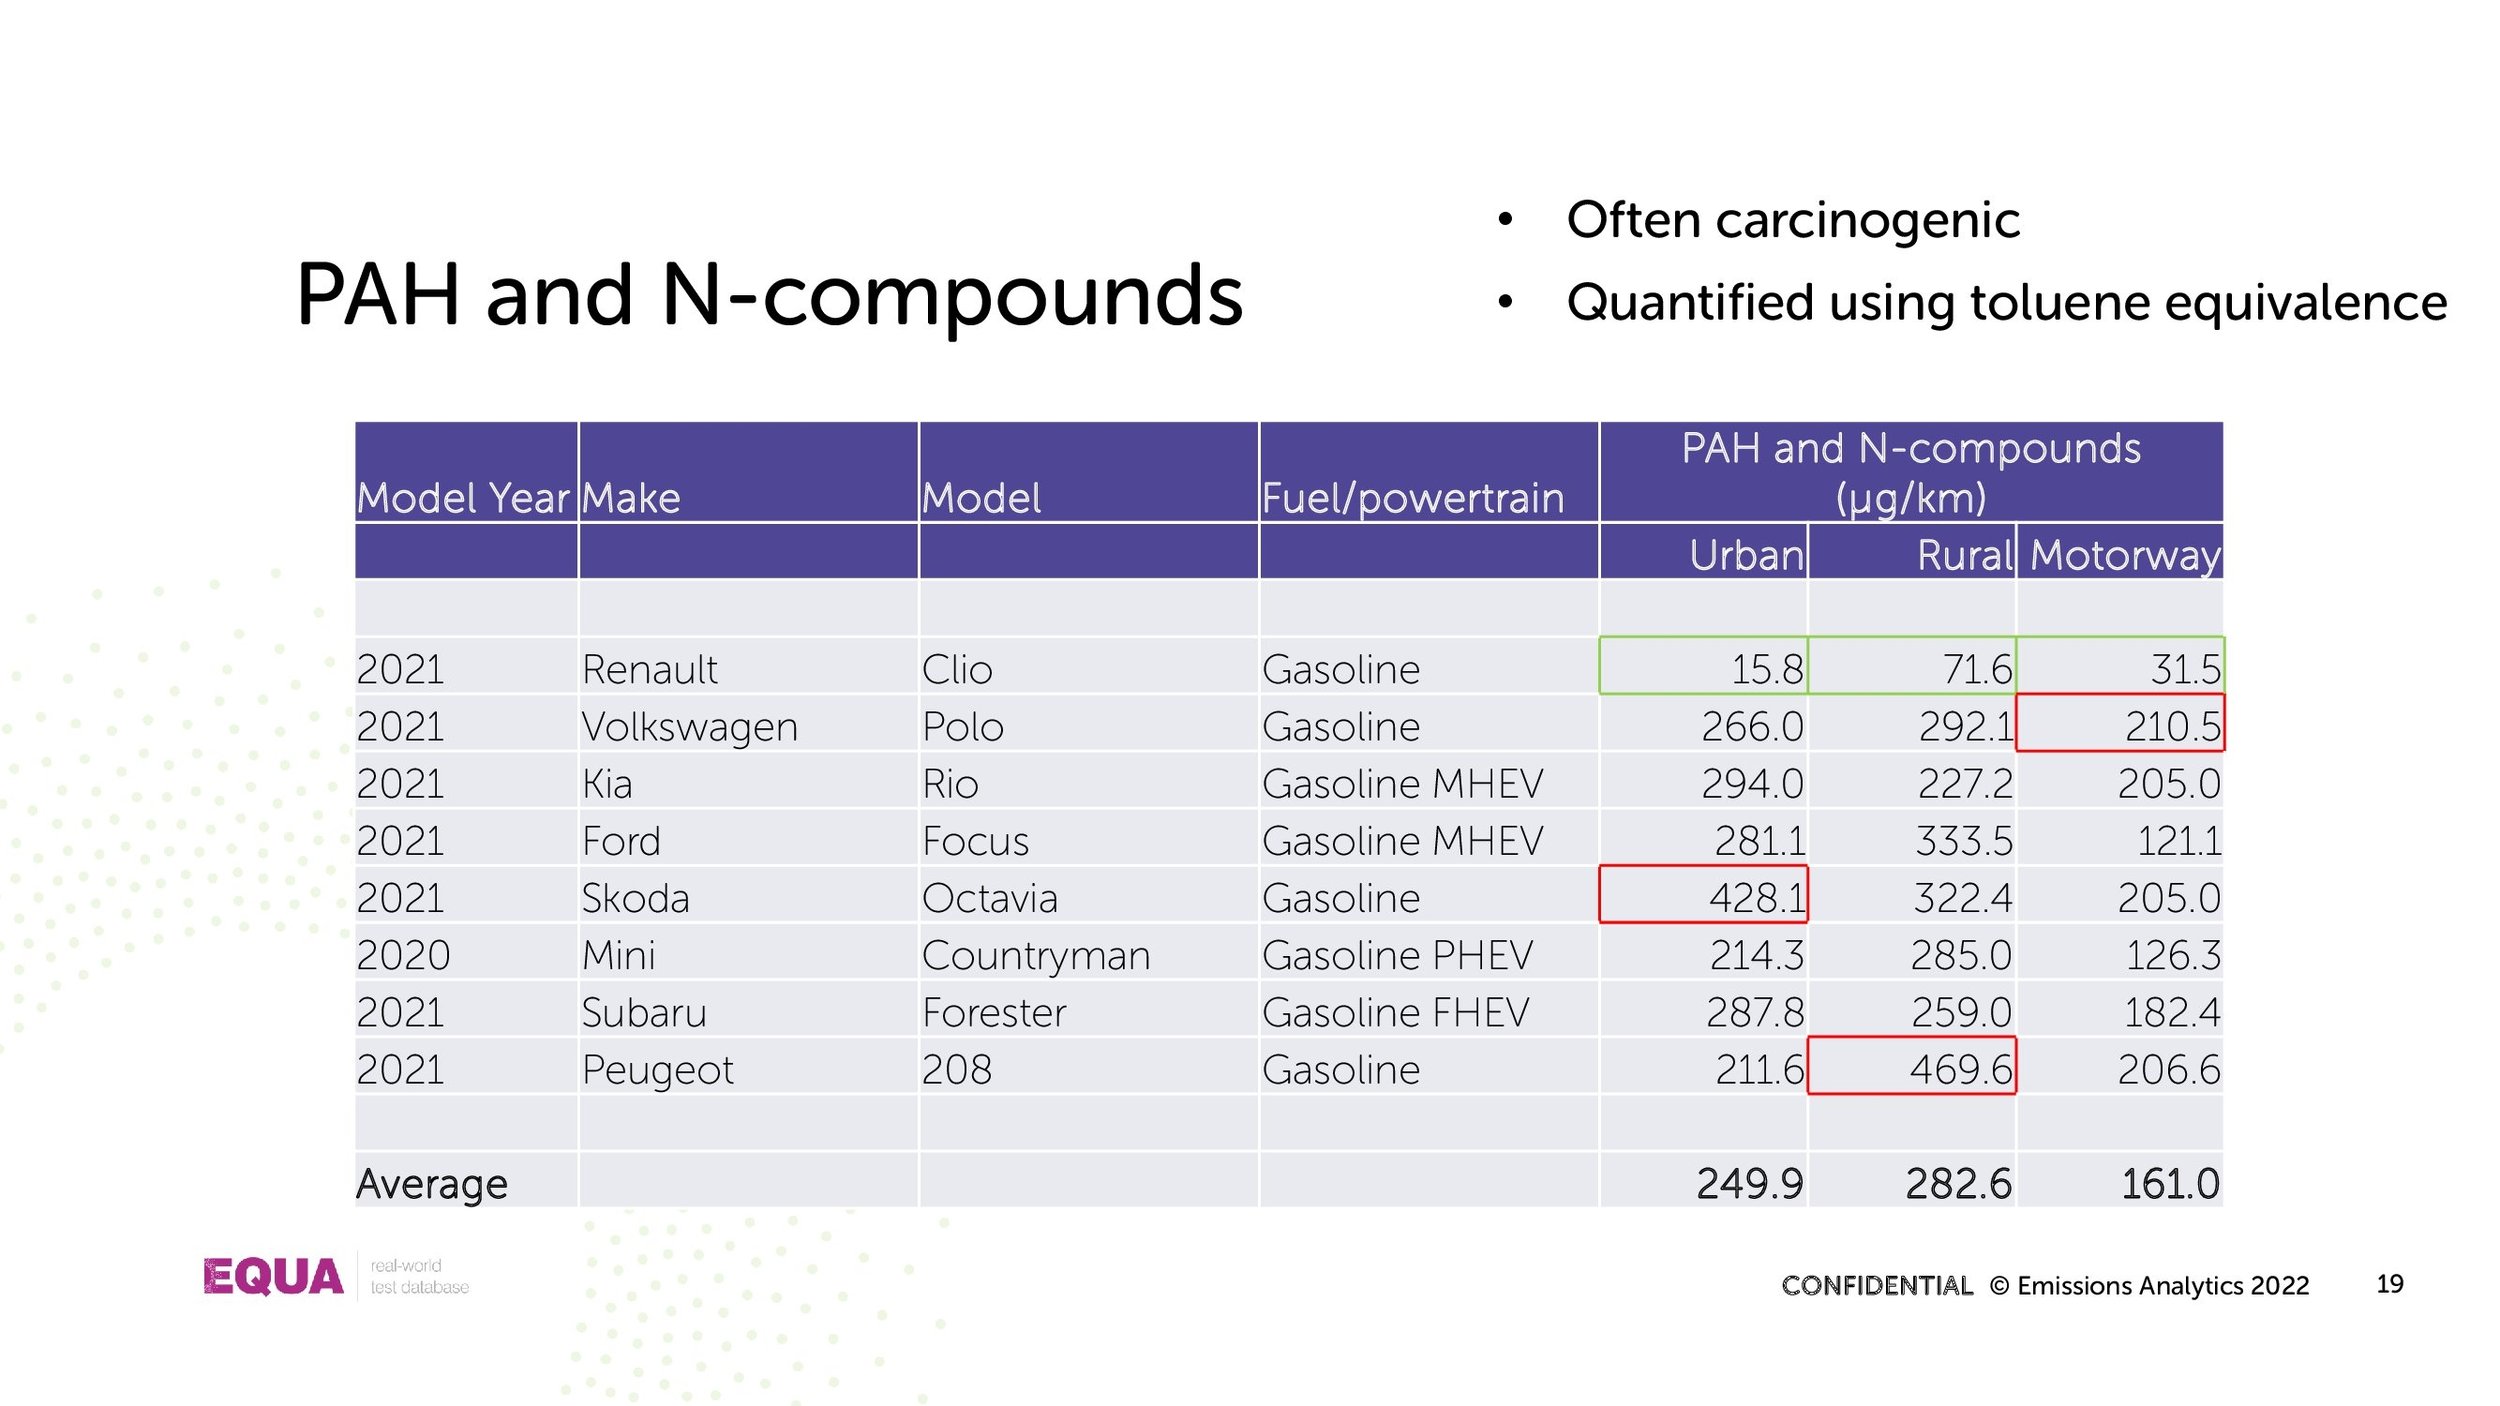
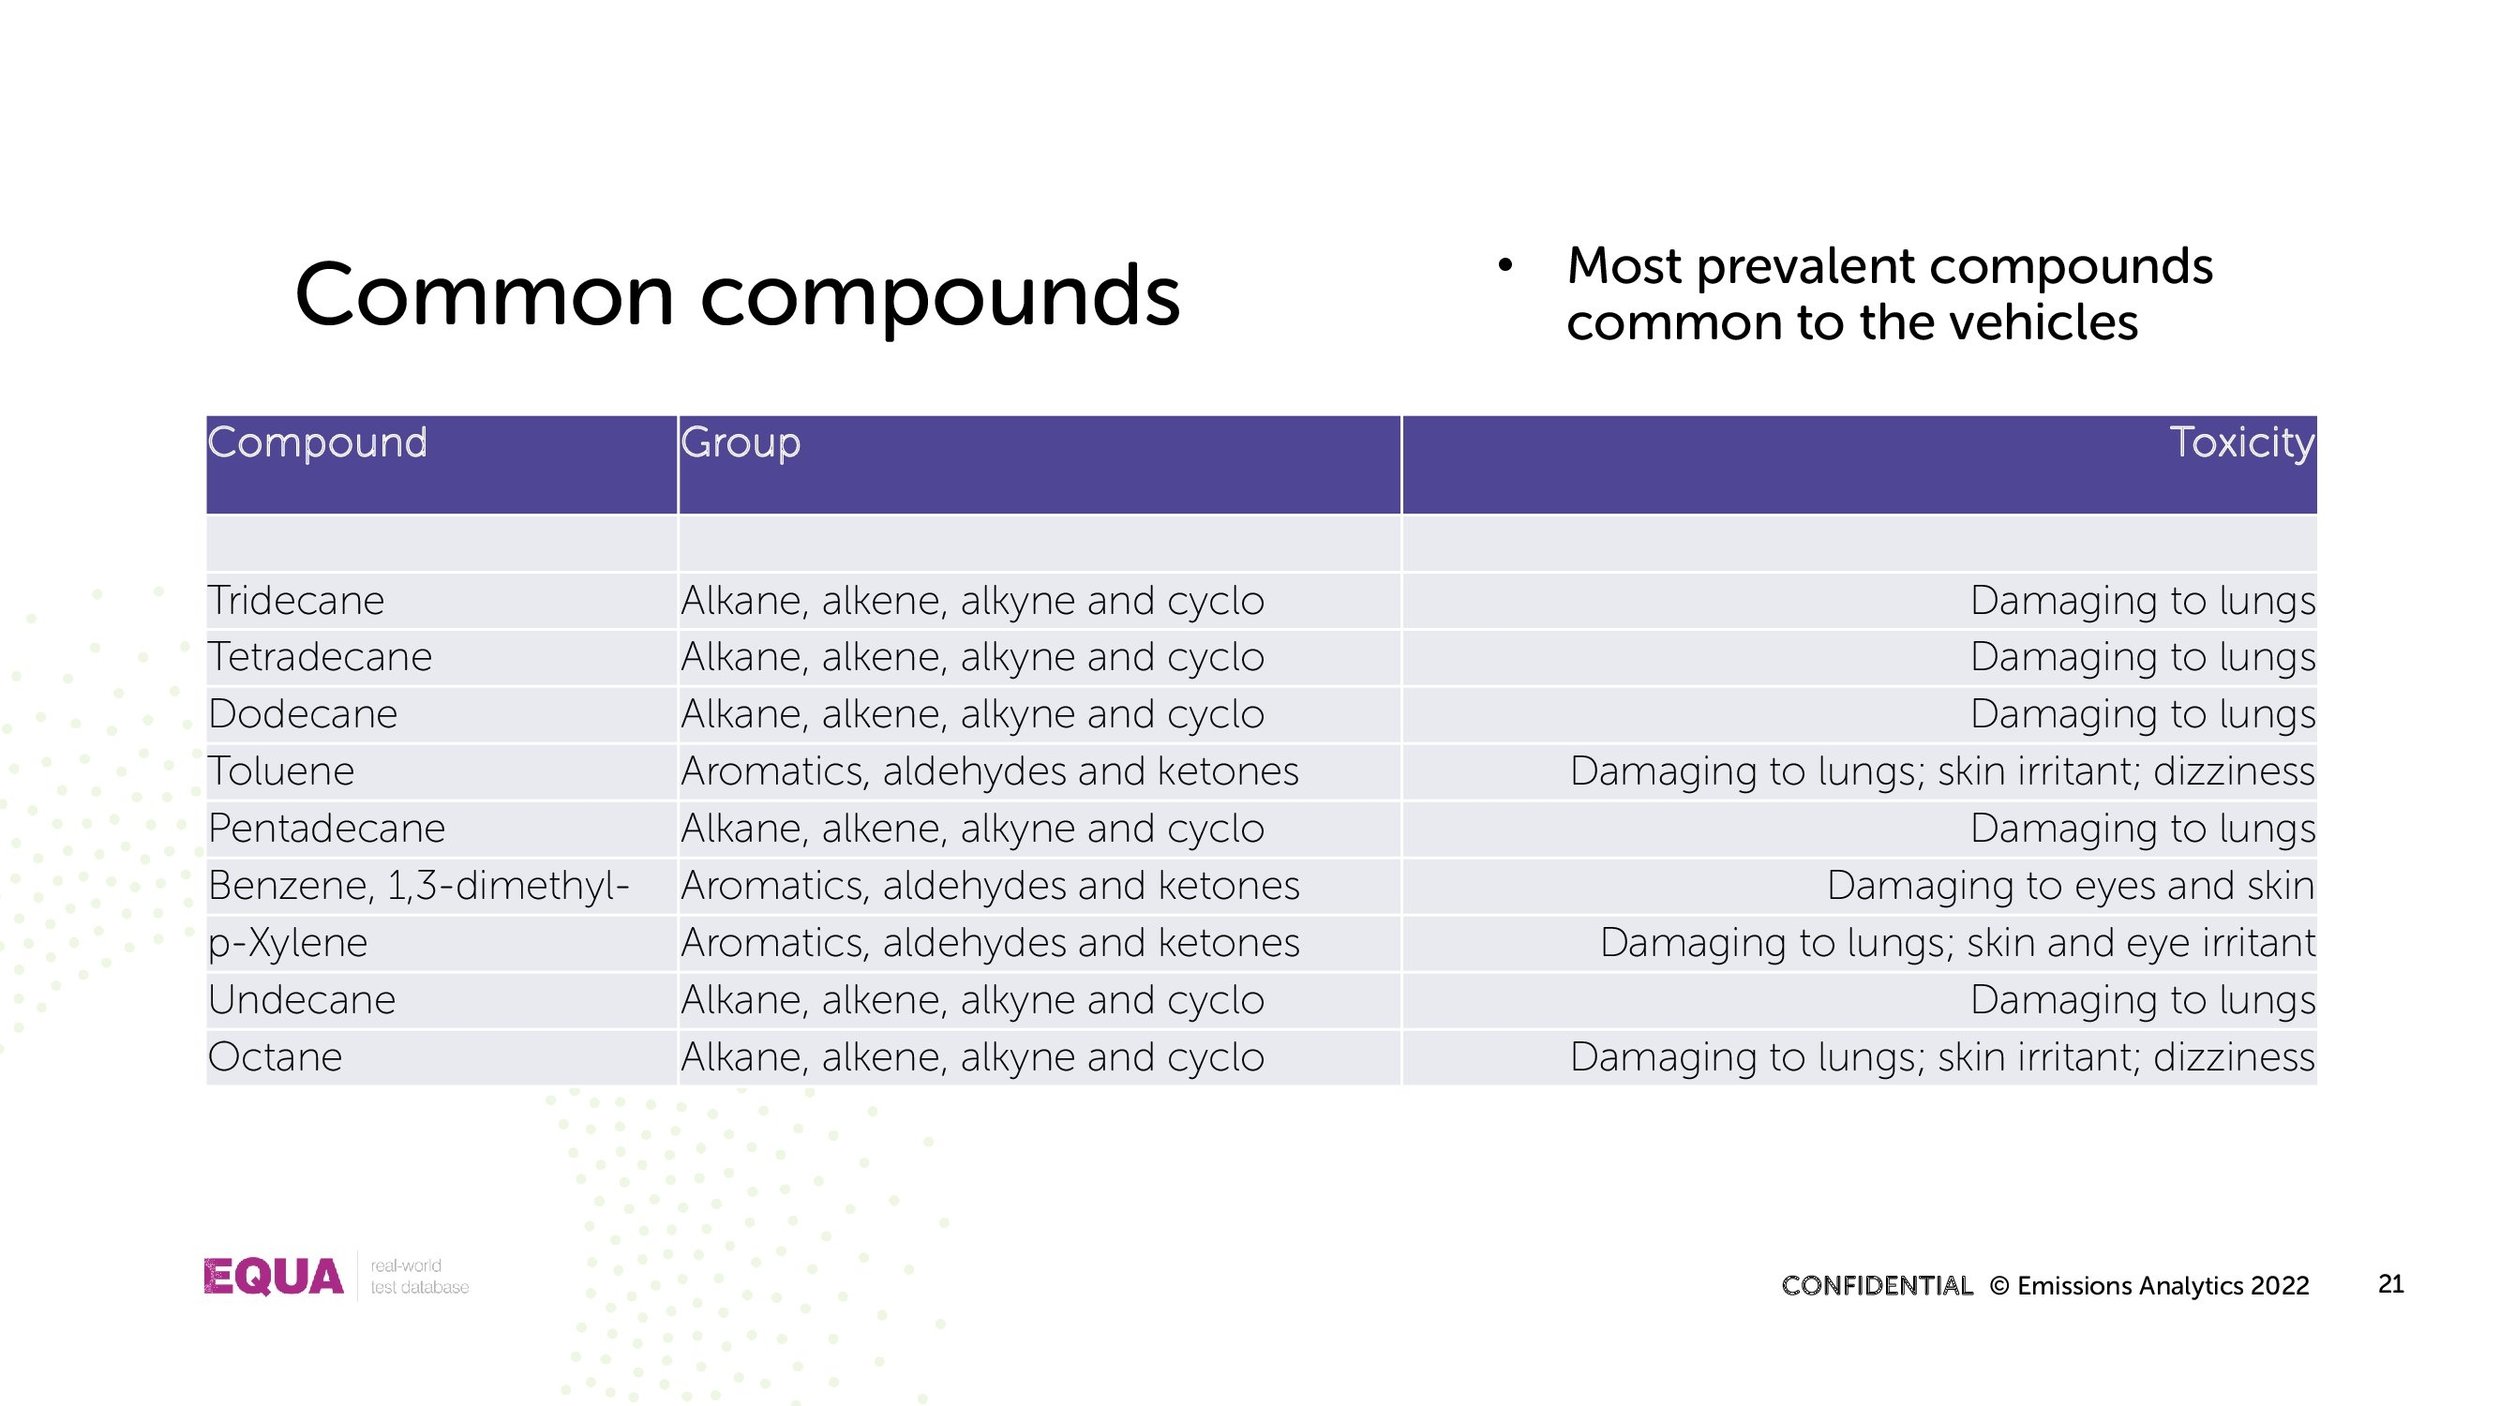
Turning to other VOCs and SVOCs, the tubes captured over 500 different compounds from each vehicle. Some of these were common to most or all, but other compounds were characteristic of specific vehicles. Taken together, each vehicle has its own chemical signature. The table below shows the top compounds that were common to each vehicle, together with their toxic effects. It should be noted that the actual effects on humans depend on the concentrations experienced.

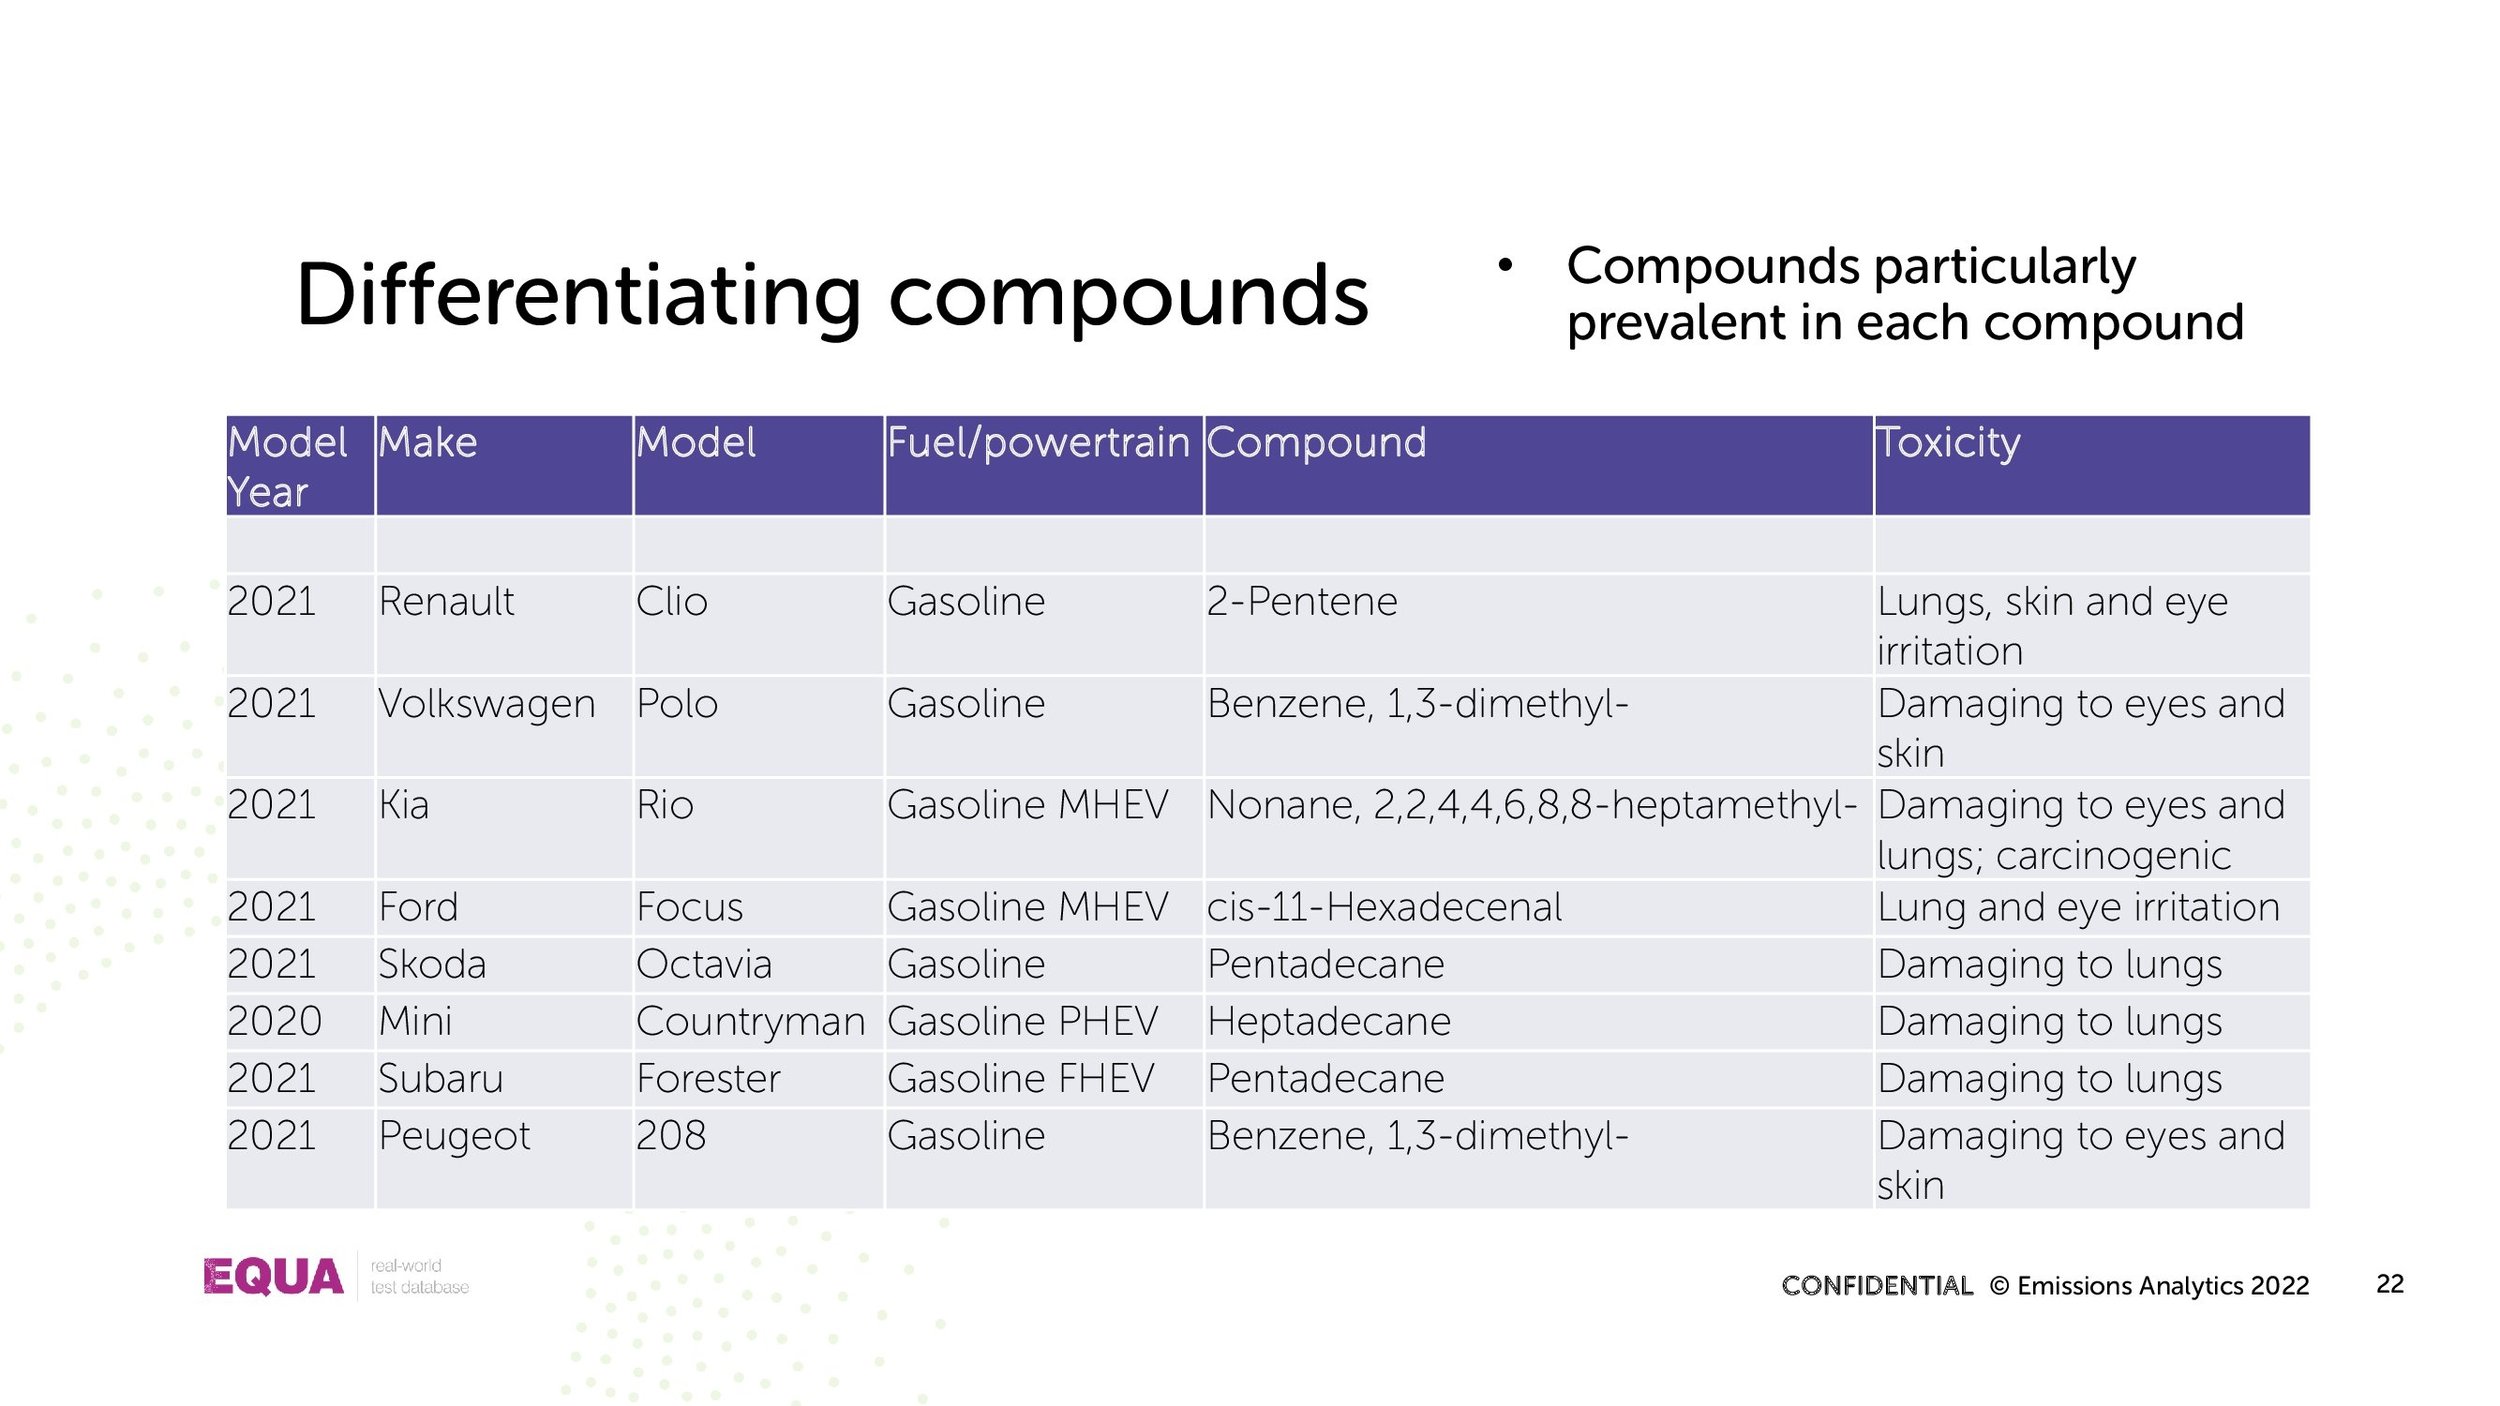
By way of contrast, the differentiating compounds are shown below. The compound listed is the most abundant chemical with particular prevalence in that vehicle.

On this first pass, therefore, there is good reason to move beyond the simple measure of total hydrocarbons and non-methane hydrocarbons in various regulations around the world. The next stages are to consider the absolute quantities of the compounds, model their dispersion in the environment, understand their toxic effects, and study their propensity to create secondary organic aerosols, i.e. solid airborne particles created as the SVOCs react in the atmosphere.
These initial results demonstrate the capability to identify and measure a wide range of VOCs and SVOCs in real-world driving – compounds that can have a wide range of deleterious effects on human health and the environment. The N₂O results may call into question the priority of adding this pollutant to the new Euro 7 regulation as the effects on global warming may be insignificant and come at the price of higher priced cars with the added regulatory burden. Better to focus on the ongoing effects of VOCs, whether the direct effect on humans and the biosphere, as precursor to ozone and smog, or as they lead to formation of airborne particles matter – which we will look at in a later newsletter.

Video: CRC Oral Presentation March 2021
Our CEO & Founder, Nick Molden recently spoke at the annual CRC Real World Emissions Workshop.
Our CEO & Founder, Nick Molden recently spoke at the annual CRC Real World Emissions Workshop.
In this presentation, Nick discusses: ‘Are gasoline vehicles being promoted over diesels as an artifact of the pollutants measured?’
Construction: the neglected source of urban emissions?
Emissions data on construction equipment is scarce, often out-of-date and gathered in unrealistic conditions. These machines fall within the generic category of non-road mobile machinery (NRMM), or ‘off-road’.
Real-world emissions test results from building sites
Emissions data on construction equipment is scarce, often out-of-date and gathered in unrealistic conditions. These machines fall within the generic category of non-road mobile machinery (NRMM), or ‘off-road’.
This segment of machinery is often overlooked in preference for passenger cars or heavy goods vehicles, but, like non-exhaust emissions, it is a source of growing importance to urban emissions. As wider exhaust emissions are brought down, so the share from construction sites may well rise as a proportion of the whole. Regulations in this area have lagged behind heavy-duty goods vehicles, while there remain many older engines in service – 25% of the registered London fleet in 2019.

To understand the situation better, Emissions Analytics, together with Kings College London, conducted an extensive real-world field test on 30 different construction machines, including nine different types ranging from static generators to telehandlers and excavators.
The 2016 London atmospheric emissions inventory estimates that the construction sector contributes 34% of the total PM10 (including fugitive dust), 15% of PM2.5 and 7% of the total nitrogen oxides (NOx) – the largest, third largest and fifth largest sources, respectively.
It can be seen immediately that construction sites are an important part of any regulatory effort to improve urban air quality.
The purpose of our field test mirrored the approach we have taken with other classes of vehicle, namely to compare regulatory standards with real-world emissions, premised on the possibility that real-world emissions are typically higher than their laboratory counterparts.
The results of our extensive field test can be summarised as follows:
Absolute improvements are clear from construction equipment certified to the latest regulatory stage, resulting mostly from deployment of better engine management and after-treatment technology.
Exceedances of certification values were observed, although were not as widespread as with light-duty vehicles before the introduction of Real Driving Emissions testing.
Significant variability exists between machines.
Emissions are sensitive to engine load.
Across the board we found that the highest NOx emissions were from older construction machines, typically Stage III-A and III-B, but which reduced in the newer Stage IV engines owing to more advanced engine management systems and exhaust after-treatment, as shown in the left-hand chart below. Average Stage VI emissions are down 78% on the prior stage.

However, we also found that Selective Catalytic Reduction (SCR) systems could be better. They perform poorly when an engine is left to idle for longer than ten minutes, whereupon the exhaust temperature falls below 200 degrees Celsius, which explains many of the high conformity factors among Stage IV machines shown in the right-hand chart above. However, it should be emphasised that a conformity factor above 1.0 does not necessarily entail any non-compliance as these tests were undertaken on machines performing routine work rather than according to the mandated test cycle for certification.

The issue of falling exhaust temperature can be seen in this example of a 129kW excavator operating with regular 15-minute idling periods. The instantaneous NOx emissions and exhaust temperature are shown in the graph below. During idling, the exhaust temperature falls and then on resumption of work there is a large spike in NOx emissions. Overall, the exhaust temperature is below 200 degrees Celsius for 42% of the time. This demonstrates the importance of careful thermal management of after-treatment systems to ensure low real-world emissions.

Another aspect concerns generators, which typically being ‘static’ are overlooked as NRMM. In fact they comprise 5% of the London fleet of NRMM and have a fundamental role to play on almost every construction site. While in London they only needed to be type-approved to Euro Stage III-A historically, with no exhaust after-treatment to control for NOx or particle emissions, approval to the new Stage V is required from 2020.
We also found that numerous generators exceeded their regulated limits for NOx emissions. The 80, 200, 320 and 500 kVA generators were 1.25, 1.08, 1.58 and 1.46 times their respective EU Stage III-A NOx emission standards. The 320 and 500 kVA generators emitted above their standards at all loads, while the others showed the worst performance at low and high loads.
On a positive note, the generator we tested that had been retrofitted with SCR yielded an 85% reduction in NOx emissions. While this wasn’t good enough to comply with Stage V emissions, it represented a strong reduction in emissions at all engine loads: on the ISO 8178 test cycle they fell from 6.03 g/kWh to 0.95 g/kWh. We found that the introduction of an exhaust filter reduced particle number by two orders of magnitude and to within the future Stage V particle number limit of 1 x 10¹² # per kWh.
By the nature of the ISO 8178 test, it is possible to plot the NOx emissions against the load demand on the generator, as shown in the chart below.

In all cases, there is a characteristic U-shaped relationship, with the lowest emissions per unit of work done occurring between 25% and 50% of maximum load. The lowest emissions on average were seen on the mid-size, 200kVA, generator, although it obviously had power limits at the top end. These results illustrate the benefit in choosing the best sized generator for a given task: too small and the emissions are higher as well as the lack of top-end power; too large are the emissions are also higher.

In summary, there are some echoes, but less extreme, of the issues of NOx exceedances for passenger cars in this test work on construction equipment and generators. Overly-downsized engines and poor after-treatment calibration in both cases can lead to elevated emissions. However, these results show significant progress in NOx reduction at Stage IV, and early evidence is showing further improvements at Stage V. The focus here has been on NOx as our results show few exceedances on particle emissions – again similar to passenger cars since the Euro 5 regulatory stage.
Putting this in the wider context of greenhouse gas emissions, although there are no CO2 standards for non-road machinery, cities are likely to be conscious of any trade-offs between better air quality and climate change effects. Indeed, our tests show a 9% increase in CO2 emissions from Stage III-B to Stage IV, although that comes after a 40% reduction from Stage III-A to III-B. This shows that the perennial tension and trade-offs in controlling different pollutants, and will continue to provide policy dilemmas that can only be resolved by use of real-world testing.

Low Emission Bus Trial in the Republic of Ireland
One of the big contributors to poor urban quality, both for nitrogen oxides (NOx) and particulates has historically been bus fleets.

One of the big contributors to poor urban quality, both for nitrogen oxides (NOx) and particulates has historically been bus fleets. However, Emissions Analytics’ experience across multiple types of vehicle, from light- to heavy-duty, has been that performance can differ markedly from model to model of seemingly similar technologies, and also between official figures and the reality of performance on the road.
To improve urban quality, Ireland’s National Development Plan committed the country to stop purchasing diesel-only buses for the urban public fleet by July 2019. To ensure that it make the best purchasing decisions in order to achieve that objective in the most effective way, the Irish Department for Transport, Tourism and Sport (DTTAS) commissioned Emissions Analytics to test eleven different types of bus in realistic conditions in Dublin and Cork. Emissions Analytics’ independence ensured that unbiased, real-world data could be gathered, rather than relying on existing third-party information.
The test equipment proposed by Emissions Analytics, largely relied on a Portable Emissions Measurement System (PEMS) from Sensors, Inc of the USA. The unit was certified to the standards required when used for official certification in Europe, even though these tests were not regulatory tests. The equipment passively measures both the flow of gas and pollutant concentrations from the bus tailpipe.
The buses tested ranged from existing diesels on the fleet such as the 2008 and 2013 Volvo B9TL, and the 2018 Mercedes-Benz Citaro BlueTEC 6, through to a new diesel Wrightbus Streetdeck Hybrid and a new Scanio Enviro 400 CBG powered by natural gas. Also covered were retrofits to these existing Volvos to understand the effectiveness of the after-market installations of Selective Catalytic Reduction (SCR) systems aimed at reducing NOx emissions.
Together with DTTAS and consultants Byrne Ó’Cléirigh (BOC), Emissions Analytics designed test cycles on the road of Dublin and Cork, based closely on existing bus routes. As the buses were tested when not in public operation with passengers, it was necessary to mimic the behaviour around regular bus stops to ensure that the average speeds and dynamicity of the cycles mirrored as closely as possible the reality of typical live operation. Taking this one step further, results were gathered for ‘cold start’ operation, where emissions are typically higher as the bus is warming up from cold, and also during regeneration of the diesel particulate filter, which similar leads to heightened emissions.
While the focus was on reducing pollution from NOx and particle emissions, the test programme covered a wider range of measurements to give a more holistic view. Other pollutants measured were carbon monoxide and, where relevant, total hydrocarbons. Relevant to the greenhouse gas agenda, carbon dioxide was measured, from which, using the carbon balance methods, the fuel consumption was derived. In this way, a rounded view on pollution and operation cost was formed, thereby ensuring that decisions around reduction of certain pollutants did not lead to unintended other consequences.
The final report detailing the findings from the trial has now been published.

Emissions Analytics Speaking at the International Vienna Motor Symposium
James Hobday will present ‘Managing Reputation and Emissions Compliance through Independent Testing’ at the International Vienna Motor Symposium in April.

James Hobday will present ‘Managing Reputation and Emissions Compliance through Independent Testing’ at the International Vienna Motor Symposium in April.
Now in its forty-first year, the event will bring together more that 1,000 decision-makers from the most important enterprises of the world’s automotive engineering industry.
Speaking at 11.45am on 24th April, James Hobday will look at how - using Emissions Analytics’ database of over 2,000 vehicle tests – emissions stakeholders can calculate risk ratings, identify weaknesses and benchmark between vehicles.
An increasing number of sources of compliance risk: homologation, conformity of production and in-service surveillance under Real Driving Emissions
Reputational and policy risk: media, consumer and political perception
How it’s not sufficient to hide behind flawed regulations (such as WLTP)
The need for a holistic view of pollutant emissions, carbon dioxide and fuel efficiency
The Emissions Analytics independent testing programme - covering hundreds of vehicles across three continents each year
How this data is analysed and available in a unique database that is accessed by a governments, industry and others
How EQUA Index helps manage these risks using the Emissions Analytics’ database of over 2000 vehicle tests, covering passenger cars, light commercial, heavy commercial and off-road
Calculating risk ratings, identifying weaknesses and benchmarking between vehicles
Registration for this event is open here.
If you’d like to discuss any of the above topics in more detail, then email James Hobday to book a meeting or call James on + 44 (0)207 193 0489.

Real Driving Emissions is a tough regulation, but also a risky one
Aggressive driving on average increases pollutant emissions by 35% in rural driving and by around five times on the motorway, according to testing of the latest passenger cars by Emissions Analytics on its EQUA Index programme.

Aggressive driving on average increases pollutant emissions by 35% in rural driving and by around five times on the motorway, according to testing of the latest passenger cars by Emissions Analytics on its EQUA Index programme. Even higher “hotspots” have also been identified, where emissions at high speed can peak at more than ten times typical levels of nitrogen oxides (NOx) – the pollutant gas that was at the centre of the #dieselgate scandal.
The need to identify hotspots is becoming vital with the new Real Driving Emissions (RDE) regulations, which is a much tougher regulation of driving in normal conditions. The consequence of this will be that a greater proportion of total emissions may be concentrated in a small number of more unusual or extreme events. Unless those are well understood, the effect of the new regulations may be blunted.
The in-use surveillance requirements set out in the fourth package of RDE are aimed at monitoring vehicle compliance in all normal driving conditions, not just the cycle on which the vehicle was certified. Broadly, a vehicle should pass any RDE test within its useful life, whenever and whoever conducts the test. This is both a significant challenge for manufacturers, and brings with it risk as it is impossible a priori to guarantee compliance on all possible RDE tests.
To help quantify this risk, Emissions Analytics is launching a new evaluation programme that will quantify the risk of excessive emissions for each vehicle tested. Currently, EQUA Index ratings (www.equaindex.com) are published to allow the performance of different vehicles to be compared on a standard, normal cycle. This new programme leaves that rating unchanged, but puts the vehicle through an extended test designed to measure performance in more extreme and unusual driving conditions. The variance between that, the standard EQUA Index and the regulated level will yield a rating for the risk of exceeding the regulated level.
The main factors considered are:
Higher speeds
Higher and lower rates of acceleration
Cold start emissions
Emissions under regeneration of the diesel particulate filter.
Considering eight diesel cars certified to the new RDE standard (Euro 6d-temp), the effect of driving at speeds up to 160 kph can be shown in the chart below.

In all cases the NOx emissions on the standard cycle – with maximum speeds up to 110 kph – are within the regulated limit of 80 mg/km plus 2.1 times conformity factor, even though certification does not apply this to the motorway section separately. In fact, many of the vehicles are comfortably below this limit. Allowing the maximum speed to rise to 160 kph shows significant proportionate increases on all but one vehicle, with the average percentage increase across all eight vehicles being 552%. All but two of the vehicles remain below the limit despite the increases; however, the worst two vehicles emitted around 650 mg/km.
For reference, under the RDE regulation, the vehicle’s velocity can be driven between 145 and 160 kph for up to 3% of the total motorway driving time. The risk of compliance therefore comes from a vehicle that has a significant emissions uplift at 160 kph and is relatively close to the limit at more moderate speeds.
Under cold start, vehicles 7 and 8 also showed an average increase in emissions of 160% compared to an average of 110% across the other vehicles.
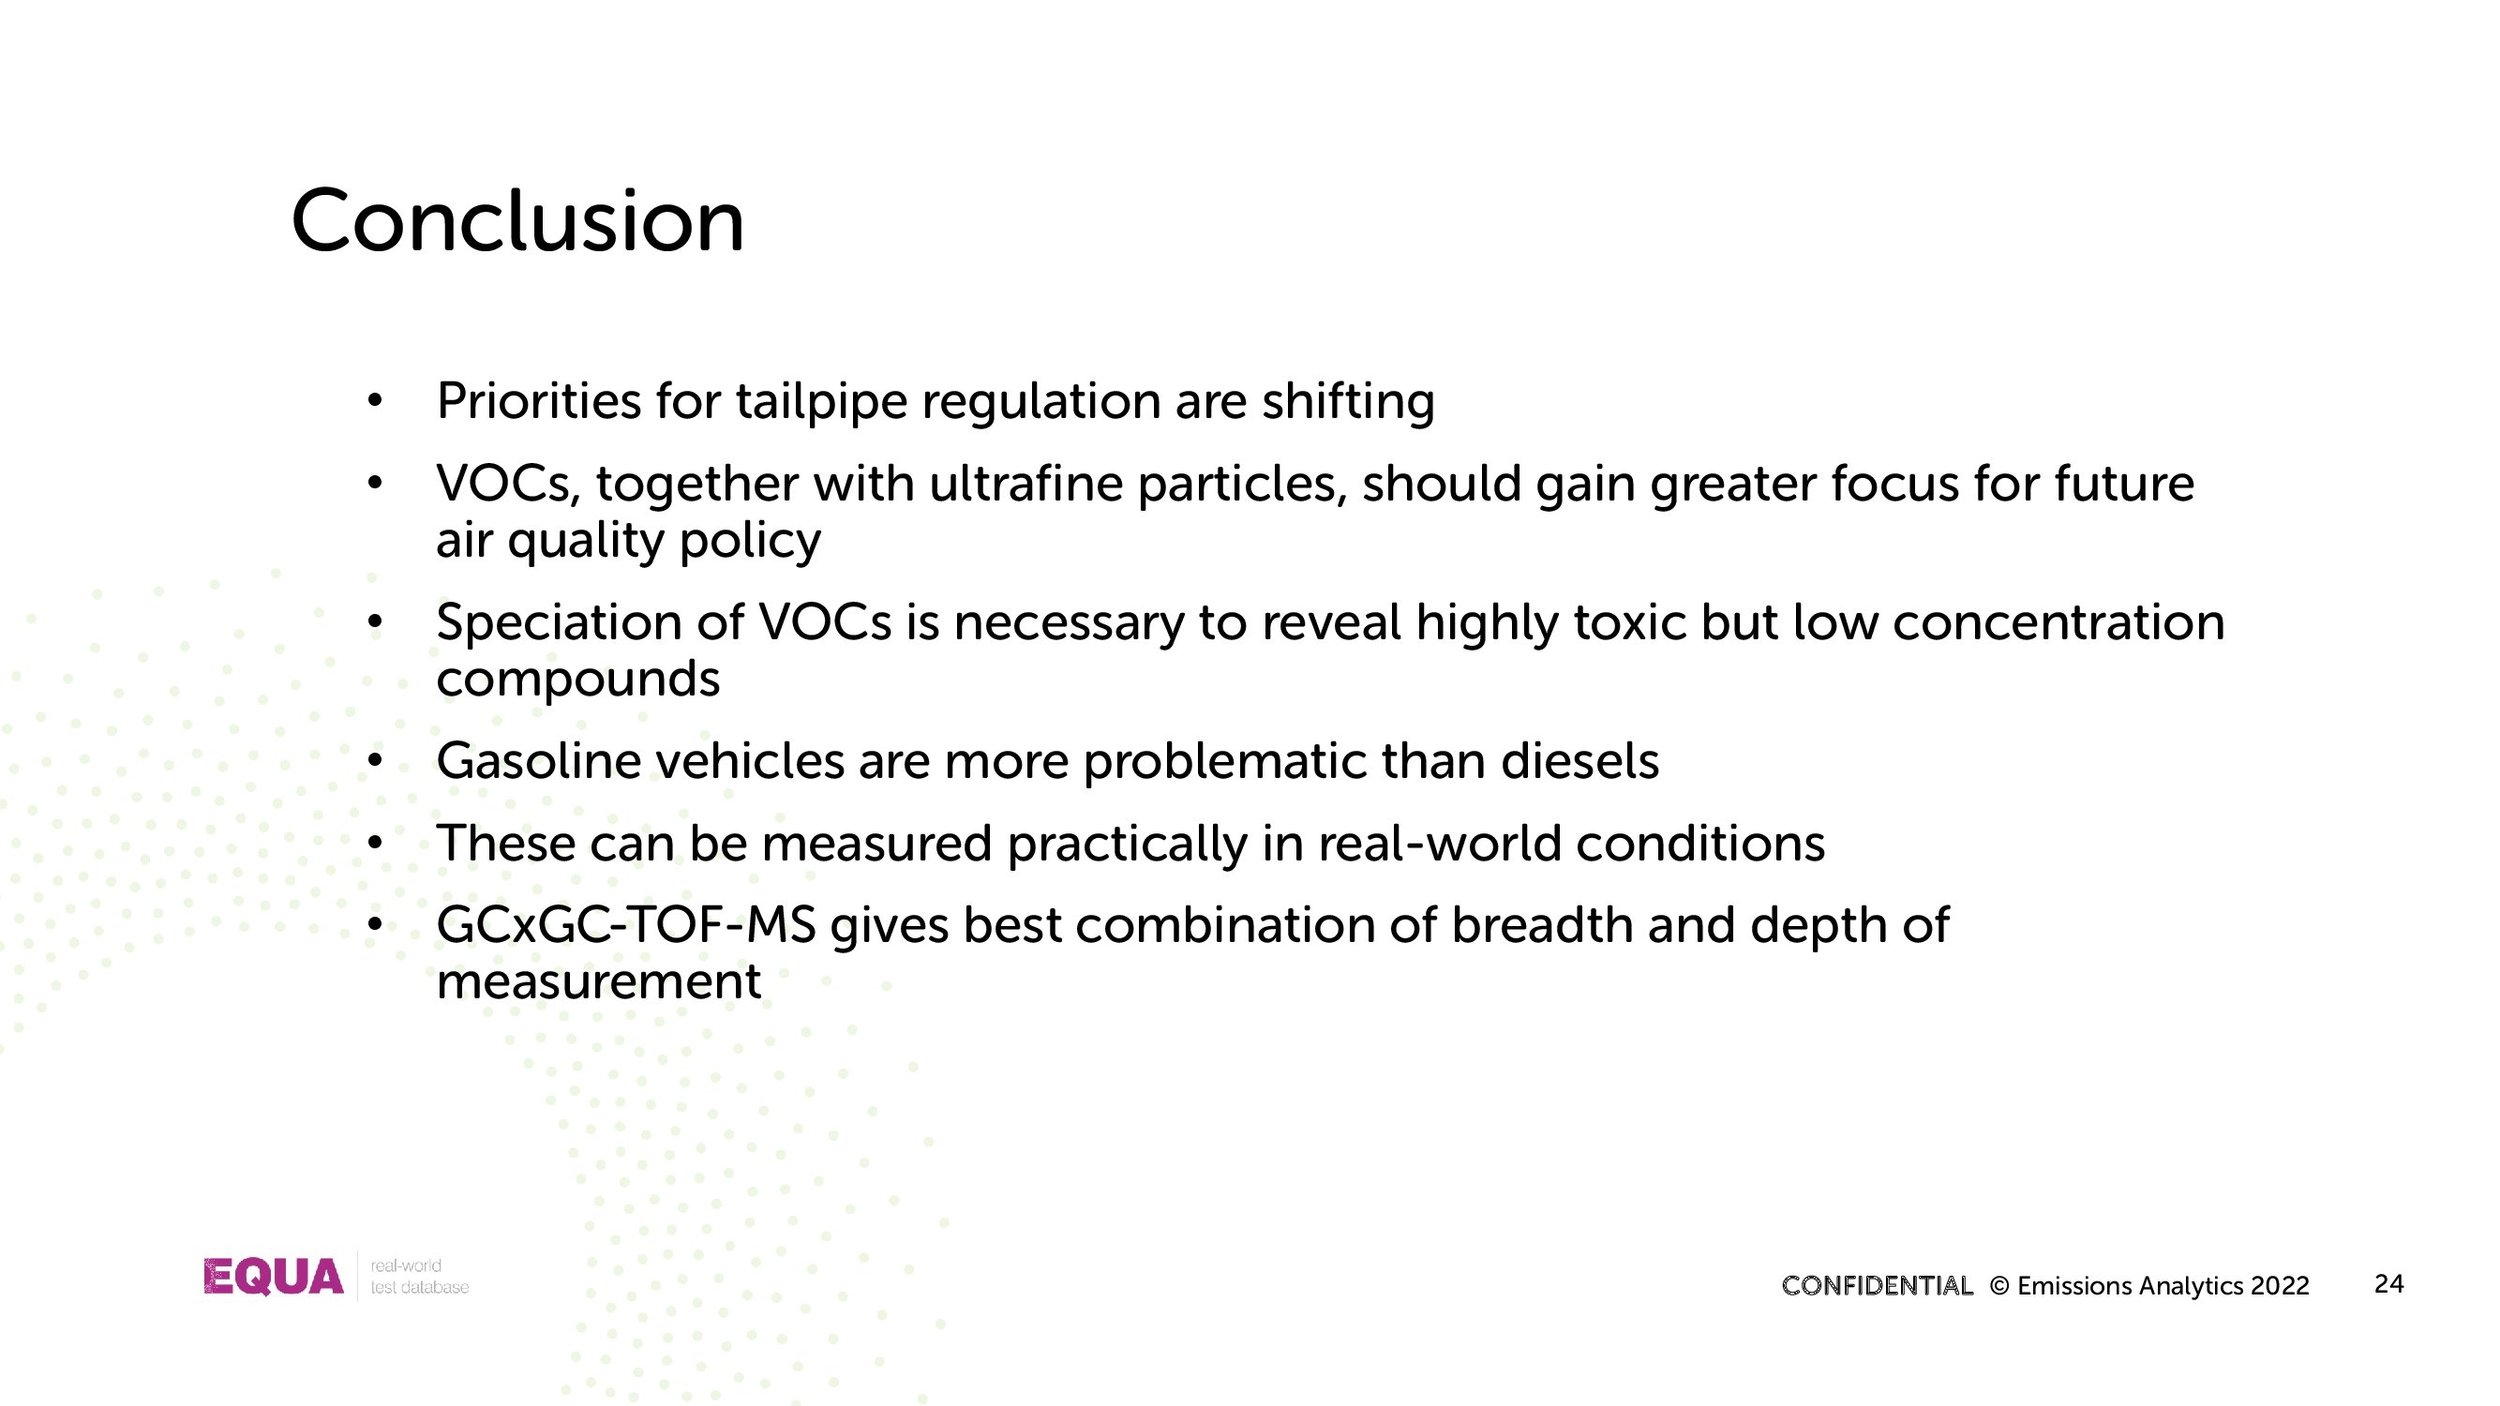
Putting this data together with performance in other parts of the test cycle, it is possible to derive ratings of the risk of excessive emissions on RDE and on RDE-like cycles but with more relaxed boundaries, as shown in the table below.
It is important to note that a red rating does not necessarily imply non-compliance but, rather, it identifies elevated risk of non-compliance using results from the Emissions Analytics’ test, which runs a cycle similar to RDE but that is not strictly compliant.
Considering Euro 6 diesels, whether RDE or prior, the effect of cold start is that NOx emissions are 2.8 times higher on average during the cold start phase compared to the whole warm start cycle. During regeneration of the diesel particulate filter NOx emissions are on average 3.3 times higher than in mixed driving with no regeneration. Therefore, the frequency and geographical location of these events can be critical to the overall real-world vehicle emissions.
These results are important for cities, manufacturers and regulators. For cities, it is vital to know that the latest vehicles do not have emissions hotspots that could undermine their air quality targets. For manufacturers, facing third-party RDE testing to check compliance, it is important to quantify the risk of high emissions being found in unusual driving conditions, where every scenario cannot practically be tested. For regulators, it is important that RDE is seen to function well in order to draw a line under the failed regulation of the past.
Emissions Analytics will continue to test a wide range of the latest vehicles to publish comparable ratings between vehicles, but now with the added quantification of the risk of elevated emissions around the boundaries of normal driving.
Discrepancies between best and worst diesel cars reaches record high
The first diesel vehicle that met the regulated Euro 6 limit for nitrogen oxides (NOx) on our real-world EQUA Index (www.equaindex.com) test using a Portable Emissions Measurement System (PEMS) was in May 2013.
The first diesel vehicle that met the regulated Euro 6 limit for nitrogen oxides (NOx) on our real-world EQUA Index (www.equaindex.com) test using a Portable Emissions Measurement System (PEMS) was in May 2013. Of the vehicles we tested in that year, the cleanest 10% of diesels emitted 265 mg/km and the dirtiest 10% emitted 1777 mg/km – a ratio of 7 to 1. In 2017, the cleanest 10% achieved an impressive 32 mg/km, but the dirtiest 10% were 1020 mg/km, a ratio of 32 to 1.
On average, progress has certainly been made, with average diesel NOx emissions having fallen from 812 mg/km to 364 mg/km from Euro 5 to Euro 6, or a 55% reduction, driven by the prospect of the new Real Driving Emissions (RDE) regulations together with the aftermath of dieselgate. The very worst vehicles have now disappeared from the new car market. It is also true that in around 10 years’ time, the majority of diesels on the road are likely to be of the cleaner variety, through natural turnover of the fleet.
We have now tested six of the latest RDE-compliant diesel vehicles, also known as 'Euro 6d-temp'. Their average NOx emissions were 48 mg/km, 40% below the regulated limit itself, and 71% below the effective limit once the Conformity Factor of 2.1 is taken into account. (As ever, it should be noted that while the EQUA Index test is broadly similar to an RDE test, it is not strictly compliant.) However, it should be noted that there are many cleaner diesels even before RDE, with 30 prior models achieving real-world emissions of 80 mg/km or less.
While this sounds like good news, the elongated transition to RDE, and growing spread from the best to the worst, are creating a growing policy and consumer choice problem in the meantime. A vehicle in the highest-emitting decile today will likely be a significant contributor to urban NO2 pollution. Yet, the cleanest diesels are getting close to the average NOx emissions from new gasoline vehicles, which is 36 mg/km. Without the contemporary data to show this, policy makers would be forgiven for simply banning all diesels from urban locations.
The lowest NOx emission recorded so far this year is the 2017 model year Mercedes CLS, with selective catalytic reduction after-treatment and type-approved for 6d-temp, which recorded 15 mg of NOx per km.

New Real Driving Emissions regulation increases pressure on annual inspection and maintenance testing system
The European Union Roadworthiness Directive came into force on 20 May 2018 and will play a role in enforcing type approval emissions limits, subtly but powerfully changing its role and previous focus on safety, to the benefit of air quality.
The European Union Roadworthiness Directive came into force on 20 May 2018 and will play a role in enforcing type approval emissions limits, subtly but powerfully changing its role and previous focus on safety, to the benefit of air quality.
In the new inspection and maintenance test, known for example as the MOT test in the UK, a ‘major’ defect and automatic fail arises from any visible smoke being emitted by any car equipped with a diesel particulate filter (DPF), meaning in practice the majority of vehicles since late 2009 (Euro 5 onwards).
The definition of ‘visible smoke’ has only tightened up for vehicles registered after 1 January 2014, meaning late Euro 5 and all Euro 6. Permitted smoke for these cars has more than halved from 1.5m-1 to 0.7m-1. This measurement is familiar to any MOT tester and denotes opacity, where 0.0 m-1 is totally clear and 10.00 m-1 is totally black. In practice, less than 0.7m-1 is judged to be invisible and more than 0.7m-1 will be visible.
For vehicles from 1 July 2008 to 31 December 2013, the standard is 1.5m-1, while the smoke standard for older cars remains unchanged, at 2.5m-1 (non-turbo) 3.0m-1 (turbo).
Air quality campaigners have been quick to note the perversity of a tougher test that only applies to newer cars. However, it has long been politically unfeasible to apply new standards to old cars, which would see the wholesale removal of vehicles that met their type approval at the time of their manufacture.
The revised smoke test for vehicles since 2014 is likely to catch out cars where the DPF is absent or defective. Particulate emissions rise by orders of magnitude when the DPF is missing or blocked. In the UK, 1800 cars have been caught without a DPF since 2014, but the true figure is believed to be much higher because it is notoriously difficult for testers to identify DPF removal in the small amount of time taken to perform the MOT.
In an exercise Emissions Analytics conducted in 2017 with BBC 5 live Investigates, a car with its DPF removed still passed its MOT at three (out of three) different garages. Mechanics failed to spot the filter had been taken out on each occasion, and the car was not failed for opacity.
To quantify the difference between having a DPF and not having a DPF, Emissions Analytics technicians tested a 9.0 litre commercial diesel engine before and after the installation of a DPF retrofit. The particle number (PN) and particle mass (PM) afterwards were close to zero, so the reduction was over 99%. Therefore, tampering would increase the emissions by orders of magnitude.

As this problem of DPF removal detection has not been eliminated, it is believed that the tougher smoke test will most likely identify missing filters, although we think a greater degree of tester training and adherence to test processes is also required.
A weakness of the new test is that is does virtually nothing to enforce emissions limits for nitrogen dioxide (NOx). Emissions control equipment is only subject to a visual check for its presence, including the oxygen sensor, NOx sensor and exhaust gas recirculation valve.
Should any of these items be ‘missing, obviously modified or obviously defective’, the car fails the test. However, the new (UK) MOT Manual skimps over this area by suggesting in section 8.2.2.1 (Exhaust emission control equipment for diesel engines), telling testers, “You only need to check components that are visible and identifiable, such as diesel oxidation catalysts, diesel particulate filters, exhaust gas recirculation valves and selective catalytic reduction valves.” We suspect that in numerous cases this requirement will be neglected owing to the continued difficulty of determining the presence of some of these items, or because of commercial pressures to complete tests quickly.
Almost all Euro 5 diesel cars had no NOx after-treatment, just exhaust gas recirculation (EGR), while their Euro 6 successors typically received the addition of either a Lean NOx Trap (LNT) or a Selective Catalytic Reduction (SCR) system. Therefore, as a rough equivalence, a Euro 6 car with failed after-treatment may emit at a level more akin to an equivalent Euro 5 vehicle.
Emissions Analytics has tested numerous Euro 5 and 6 cars on its on-road EQUA Index (www.equaindex.com) route. For example, a Euro 5 VW Golf 1.6 litre diesel emitted 0.557 g/km of NOx, while its LNT-equipped Euro 6 successor emitted 0.161 g/km, a reduction of 71%.
Then take the larger Mercedes C-Class 2.1 litre diesel. In Euro 5 guise it emitted 1.226 g/km of NOx; and with SCR fitted to the Euro 6 version the same engine emitted 0.396 g/km, a reduction of 68%.
From these results it is clear that to disable these treatments (with an “emulator” or similar) or where they have malfunctioned, NOx could increase by a factor of over 3.
However, the dilemma in setting an in-service NOx standard is that the performance of vehicles when brand new varies from around 20 mg/km to over 1500 mg/km – the issue uncovered as a result of the dieselgate scandal. A vehicle normally producing 20 mg/km that is malfunctioning might produce 800 mg/km, whereas a different model may produce 800 mg/km when in a fully functioning condition. Therefore, a real-world reference number is required to judge the in-service performance. The EQUA Index rating, which is a standardised test on the vehicle when new, could act as this reference value to increase the accuracy of identifying malfunctioning vehicles.
One unmistakable outcome is that what was once mainly a test for roadworthiness has now become a more complex enforcement of type approval emissions, at the very moment when those limits are tightening up within WLTP/RDE.
The inspection and maintenance system has in this sense risen in importance as a tool for policing emissions, because non-compliant vehicles will display vastly increased emissions, by orders of magnitude. However, the failure to test properly for NOx misses one of the major problems that Europe faces, in the wake of its dieselisation, while the ultrafine particles produced by downsized, direct injection petrol engines are also missed. It feels as though the new test is distinctly lacking in these crucial areas, leaving much more work to be done.
Rethinking Scrappage For Addressing Vehicle Emissions
Scrappage schemes are controversial. In a 2011 academic paper* reviewing 26 studies assessing the outcomes of 18 scrappage schemes implemented around the world in 2008-11, the authors concluded that the emission effects of the schemes were ‘modest and occur within the short term.’ They also concluded that the cost-effectiveness of such schemes ‘is often quite poor.’
Scrappage schemes are controversial. In a 2011 academic paper* reviewing 26 studies assessing the outcomes of 18 scrappage schemes implemented around the world in 2008-11, the authors concluded that the emission effects of the schemes were ‘modest and occur within the short term.’ They also concluded that the cost-effectiveness of such schemes ‘is often quite poor.’
The reality of the 2008-9 scrappage schemes, however, was that governments in Europe, the US and Japan were tackling a liquidity gap by stimulating consumption and bolstering an ailing car industry. The mooted environmental benefits of accelerated fleet renewal were talked up by politicians but were not the main objective. This helps to explain why the efficiency of the schemes in mitigating Greenhouse Gas (GHG) emissions - CO2 dominating discussion at the time - was found to be poor value for the taxpayer and of marginal consequence to overall path reductions towards a low carbon economy.
Since 2008-9, the policy climate has changed significantly, with air quality emerging as a major concern. Several national governments have been sued by environmental groups for illegal levels of NOx in cities, and what was once a transport policy issue has become a matter of public health. With diesel bans looming in city centres, plus the advent of clean air zones, it’s no stunt to reimagine scrappage according to an emission-reduction imperative.
Data availability upon which to base an intelligent scrappage scheme has also improved. Since 2011 Emissions Analytics has compiled the world’s largest database (the EQUA Index) of standardised real-world emissions tests, of over 2000 cars. The EQUA Index test measures not just CO2 emissions but nitrogen dioxide (NO2) and carbon monoxide (CO), as well as fuel efficiency.
Reimagining scrappage in light of air quality first requires accepting that the now discredited New European Driving Cycle (NEDC) test regime has produced counterintuitive outcomes, to the point where some of the newest cars are by no means the cleanest. This means that a poorly designed scrappage scheme could produce a worse outcome, measured in air quality, than doing nothing at all.
The EQUA Index results show that:
Dirtiest Euro 6 diesels are 6-7 times worse than cleanest Euro 5
Dirtiest Euro 6 diesels are up to 3 times worse than cleanest Euro 3/4
Some 20-year-old cars are cleaner than some brand new cars
How one weights GHG emissions against NOx emissions is a matter of policy debate and public acceptance, but a plausible objective would be Pareto optimality, or the idea that addressing air quality should not be at the expense of GHG such as CO2. While research points towards life cycle or ‘well to wheel’ analysis of CO2 emissions, this is difficult to measure and for the sake of a near-term scrappage scheme probably lies in the future.
Beyond the well-observed conflict between efficiency, where diesel scores well compared to gasoline, and the point-of-use emissions, where gasoline is consistently cleaner with respect to certain emissions such as nitrogen dioxide, the point to make is that it is possible to target and scrap dirty cars without increasing CO2.
The EQUA Index test recently revealed that 11 Euro 6 diesel cars from four manufacturers merited an A+ rating, equivalent to 0.06 g/km NOx in the EQUA Index test, which compares with a limit 180% higher (0.168 g/km NOx) for the new RDE requirement that will prevail until January 2021. Such cars can be said to be genuinely clean by today’s standards, but were greatly outnumbered by highly polluting diesel models, 38 of which scored F, G or H, meaning that they exceeded the Euro 6 limit in respect of NOx by 6-15 times. By comparison, 105 gasoline and hybrid Euro 6 cars achieved the A+ rating, and only one gasoline model fell into the D category, the rest being C or higher.

In the graph above, the arrow labelled ‘Bad Trade’ travels from a Euro 4, 1.9-litre diesel Skoda Octavia, model year 2009, that scored E in the EQUA Index test, towards a Euro 6, 1.6 litre diesel Nissan Qashqai, model year 2016, that scored H in the EQUA Index test. The Skoda is cleaner than the Nissan in real-world testing, yet a scrappage scheme designed around vehicle age alone could result in the cleaner Skoda being scrapped for purchase of an equivalent, dirtier Nissan Qashqai. This would result in tailpipe emissions higher by a factor of more than five and therefore worse air quality. It would be a waste of tax payer money.
Conversely the ‘Good Trade’ arrow highlights that dirty older (and conceivably newer) vehicles could be scrapped for genuinely cleaner new vehicles. Currently, 87% of Euro 6 diesel cars are over the Euro 6 limit, as are all Euro 5 cars. If all these cars were replaced by Euro 6 cars actually performing to the Euro 6 diesel standard in real-world conditions, the net tailpipe emissions improvement measured in NOx would be around 88% from the Euro 5/6 fleet. If real-world performance were only brought down to the Euro 5 diesel standard, the reduction in emissions would be 74%. Even if performance were reduced to just Euro 3 levels, there would still be a 38% reduction.
Put another way, as most Euro 5 and 6 diesels emit over the limit, a large number of vehicles need to be “fixed” to address the air quality problem. This inherently makes any scrappage scheme highly costly. Therefore, a more stratified approach may be optimal, as shown in the chart above. Emerging passenger car retrofit technology may deliver a 25% or more reduction in NOx; those vehicles with moderately high emissions could be tackled in that way. A scrappage scheme could then be targeted on the dirtiest diesels (perhaps worse than the Euro 3 level in real-world).
A further potential ‘Bad Trade’ may be switching from a diesel car to a non-hybridised gasoline car. The same vehicles viewed through the lens of CO2 emissions show that on average, gasoline vehicles are, like-for-like, a ratings class worse than diesels for absolute CO2 emissions. They also exhibit a greater disparity between NEDC measurements and actual emissions. For example, the 2017 Audi Q2 diesel, achieves A+ for air quality and C2 for CO2. The same power output gasoline equivalent model from the same year also achieves A+ for air quality, but a lower D4 for CO2. C means 150-175g/km CO2; D means 175-200 g/km, but the numbers 2 and 4 respectively show that the gasoline engine model is at greater variance from the officially claimed figures. This example highlights an element of the trade-off involved if tackling air quality results in a more gasoline-dominant fleet.
In summary, the right scrappage and retrofit schemes could incentivise consumers towards vehicles that are genuinely clean and genuinely efficient, taking into account not just NOx emissions, but also CO2 and particulates. This would contrast with the UK’s 2009 scheme that merely required customers to scrap their old car for any new vehicle. A stratified and discriminating scheme would require a more focussed replacement, resulting in better results both for air quality and climate change.
* Bert Van Wee, Gerard De Jong & Hans Nijland (2011) ‘Accelerating Car Scrappage: A Review of Research into the Environmental Impacts’, Transport Reviews, 31:5, 549-569, DOI: 10.1080/01441647.2011.564331
Cutting pollution and improving public health
Pollution is a major contributor to chronic human sickness, not just environmental damage, according to the 2017 annual report of England’s Chief Medical Officer, Professor Dame Sally Davies, released on 2 March 2018: https://www.gov.uk/government/publications/chief-medical-officer-annual-report-2017-health-impacts-of-all-pollution-what-do-we-know. The report made 22 policy recommendations, many of which related to monitoring and ameliorating pollutant emissions.
Pollution is a major contributor to chronic human sickness, not just environmental damage, according to the 2017 annual report of England’s Chief Medical Officer, Professor Dame Sally Davies, released on 2 March 2018: https://www.gov.uk/government/publications/chief-medical-officer-annual-report-2017-health-impacts-of-all-pollution-what-do-we-know. The report made 22 policy recommendations, many of which related to monitoring and ameliorating pollutant emissions.
Emissions Analytics is pleased to have had its EQUA Index real-world emissions rating system (www.equaindex.com) cited in the report. With the failure of the previous EU vehicles emissions regulatory regime, having led to around 40 million high-NOx-emitting diesels on European roads, the need to base policy on real-world emissions has grown, as illustrated in the chart below. Each point represents a vehicle we have tested, and the horizontal line shows the regulated limits.

It is clear that at each Euro stage the cleanest vehicles have been getting cleaner, while the dirtiest vehicles have not. Therefore, any system of discriminating between vehicles based only on Euro stage will be highly inefficient as it will involve permitting some vehicles with high real-world emissions. The particularly problematic Euro stages are 5 and 6, within which there are significant spreads from the best to the worst. For example, the dirtiest Euro 6 diesels are six to seven times higher emitting than the cleanest Euro 5. More striking still, the dirtiest Euro 6 diesels are around three times worse than the cleanest Euro 3/4 vehicles, last of which were type-approved in 2009.
In summary, using the EQUA Indices would allow governments and cities to target only those vehicles which are high emitting in practice, minimising the private and public cost. Any system based only on official Euro standards would be costlier and less efficient. Estimates of the benefit suggest that 54% of Euro 6 diesels would have to be restricted from urban areas to achieve an 87% reduction in nitrogen oxide emissions.
Many of the Chief Medical Officer’s recommendations revolve around the need for evidence-based action. This has been dramatically lacking in emissions policy, due to the difficult choices it would present.
One recommendation specifically calls on local government and public health professionals to implement concrete solutions. The Mayor of London’s publishing of the EQUA Aq ratings for NOx on its official website (www.london.gov.uk/cleaner-vehicle-checker/) is an example of proven action that could be applied in any city across Europe. Another recommendation talks about providing toolkits to assist local authorities. With the challenges of Clean Air Zones, the priority is to link up the existing empirical evidence with policy action on the ground.
An example of this is when regulating against particulate number emissions: current certification of particle number (PN) emissions is down to 23 nanometres in size. However, ambient pollution laws still focus on PM2.5, or 2500 nanometres in size. The concern about ultrafine particles has been growing, as the penetration of direct injection gasoline engines has increased.
Latest test data from Emissions Analytics also suggests than certain diesels are now lower in CO2, carbon monoxide (CO) and PN emissions that many gasoline cars, and equivalent levels of NOx. This should be carefully borne in mind as policy increasingly slants away from all diesels.
The Chief Medical Officer’s report also recommends a standardised approach to pollution surveillance and road charging to give vehicle drivers a simple and consistent system. While the new Real Driving Emissions (RDE) regulation is robust, it is not simple and consistent, which will limit its effect in rebuilding consumer trust. In particular, previously launched cars will not be systematically retested on RDE and therefore there will be no comparability with new cars.
Finally, the current lack of trust in car manufacturers is not to the benefit of them, consumers, the market or society. A further recommendation calls for transparency on the part of industry as to the polluting effect of their activities. Emissions Analytics believes this is a necessary first step to rebuilding that trust.
Emissions Analytics hopes the simple, independent and free-access nature of the EQUA Index is a good place to start to reassert evidence-based policy and the health of the automotive industry.
Can driving styles prove the smarter route to better fuel economy and emissions?
The relevance of official fuel economy figures is still a perennial topic across the automotive industry, and one of the hardest to answer directly takes into account the human factor. Some claim that the official figures are in fact perfectly valid, if only the average driver wasn’t so lead-footed. But is there any truth in this train of thought?
The relevance of official fuel economy figures is still a perennial topic across the automotive industry, and one of the hardest to answer directly takes into account the human factor. Some claim that the official figures are in fact perfectly valid, if only the average driver wasn’t so lead-footed. But is there any truth in this train of thought?
Thinking laterally, one way to assess this question is to consider a scenario where the UK parc features a high penetration of connected and autonomous vehicles (CAVs). By taking the driver out of the loop an autonomous vehicle could deliver a more “responsible” and consistent driving style. This would in turn consume less fuel and so deliver significant reductions in nitrogen oxide (NOx) and carbon dioxide (CO2) emissions, then perhaps the driving style hypothesis is true.
To look at this very question Emissions Analytics and Imperial College London collaborated on the “Optimised Vehicle Autonomy for Ride and Emissions” feasibility project, supported by the Centre for Connected and Autonomous Vehicles and Innovate UK.
The research methodology started with Emissions Analytics performing on-road PEMS tests of 21 vehicles to its standard EQUA Index protocol across the UK and Germany. This provided second-by-second driving characteristics and the simultaneous emissions, allowing an emissions map for each car to be created.

These were then integrated with VISSIM traffic simulation software to model the effects of traffic flow and driving behaviour on the emissions. The simulation covered three main factors: vehicle driving strategy, communication between vehicles and infrastructure, and the penetration of CAVs. This included scenarios were a CAV followed a normal vehicle, a non-CAV followed a CAV, and CAV following another CAV.
We also factored in the ability for CAVs to communicate with traffic lights allowing them to approach a junction knowing when they were going to change, and so avoid coming to a complete stop.
In essence, the virtual CAVs were configured to mimic a more cautious and gentle driver with better anticipation of the road ahead and smoother style of driving. The benefit of the approach was we could model a world of 100% CAV penetration, but also the transition to that point via a mixed fleet of CAVs and non-CAVs.
The headline results are that, with 100% CAV penetration with congested traffic, NOX and CO2 could be reduced by approximately 20%. The preliminary analysis assumes a simplified scenario with only diesel cars, so the results are not yet reflective of the current UK fleet. It is plausible that petrol vehicles would show a similar CO2 reduction, while NOX emissions are typically low NOX whatever. Overall, the results show that smoother traffic flow could have significant benefits in urban areas.
This suggests that optimised driving styles can deliver lower vehicle emissions. However, according to our EQUA Index (www.equaindex.com), on average diesel NOx emissions are approximately five times the regulated limit on average (399 mg/km), and CO2 emissions are 40% above official values (based on the New European Driving Cycle). This means that even if driven more responsibly the average vehicle will only reduce its NOx exceedances to about a factor of four, and the CO2 exceedances to 30%. While this is an improvement, and underlines the benefits of driver training initiatives, it strongly suggests that the driver is not responsible for the majority of the emissions exceedances observed.
The chart below shows the reduction in NOx, as the penetration of CAVs increases from 0% to 100%. The benefits are seen is a broadly linear way as penetration increases, although the majority of NOx emissions still come from non-CAV vehicles even when CAV penetration passes 60%.

In summary, even if the driver and all associated “bad” driving habits are eliminated, the current fleet of vehicles will still well exceed official CO2 values, and diesel vehicles will exceed the NOX limits. Modifying driver behaviour can offer a valuable mitigation to these exceedances, but real-world emissions are still primarily determined by vehicle selection.

Independent car rating system can solve emissions crisis, says new global alliance ‘AIR’
Independent car rating system can solve emissions crisis, says new global alliance ‘AIR’. Read the press release here.


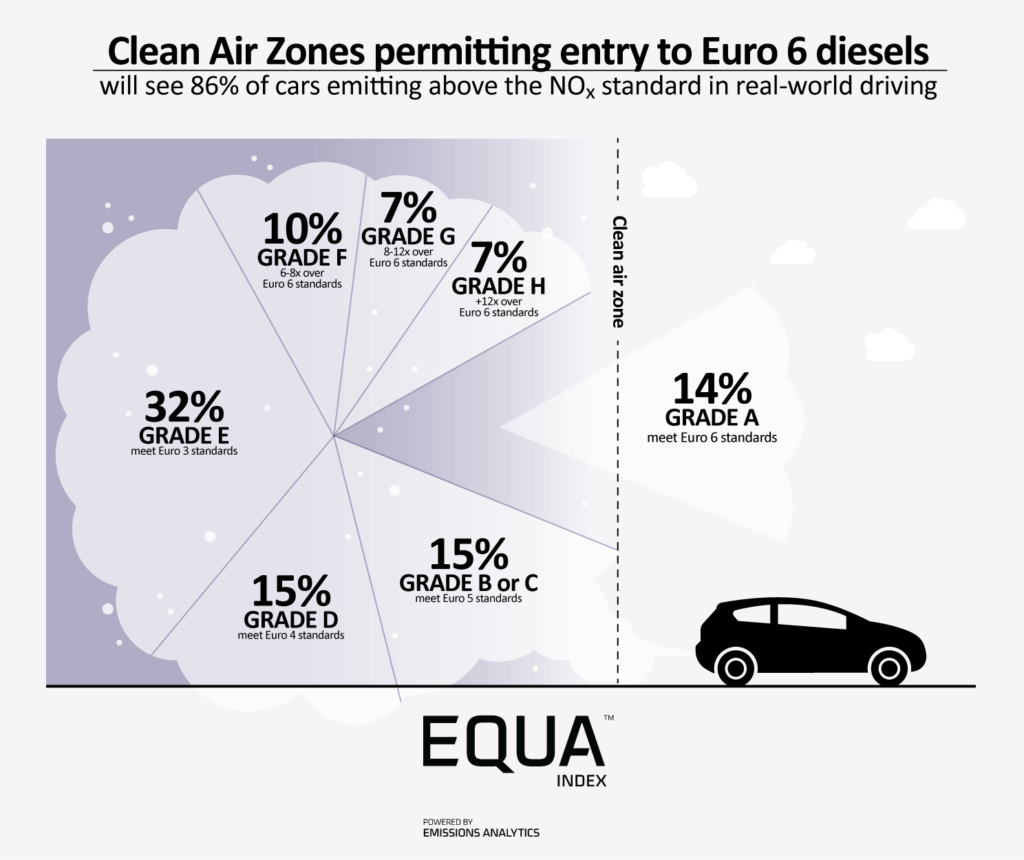

Thermal windows: the next big scandal or an innocent technicality?
Recent months have seen a growing a body of evidence, from different sources, that NOx emissions from cars are higher when the ambient temperature is lower.
Recent months have seen a growing a body of evidence, from different sources, that NOx emissions from cars are higher when the ambient temperature is lower. This month, Emissions Analytics mined its real-world database to assess the evidence.
The accusation is that NOx reduction devices, including exhaust-gas recirculation, are programmed for reduced operation below the 20°C of the official test. The effect would be higher NOx emissions, with the motivation supposedly to deliver better real-world fuel economy.
Some manufacturers argue that this is, in fact, to protect the engine from damage at lower temperatures, and that doing this is perfectly legal. However, with average temperatures in the UK around 9°C across the year, this has a potentially significant impact on air quality and governments’ attempts to achieve air quality targets.
To quantify the issue, we segmented NOx data from our on-road PEMS tests into groups above and below 18°C, and found the following differences in the average Conformity Factor (ratio of real-world NOx to official limit).
Conformity Factors of Euro 5 & 6 vehicles above and below 18°C

While the result for the Euro 5 vehicles was statistically significant, this was not the case for Euro 6 due to a small number of very high emitters. As our sample size increases, we will be better able to assess whether there is a pattern for Euro 6 cars.
Looking in more detail at the Euro 5 vehicles, the data suggests that there are seven manufacturers with clearly higher emissions below 18°C, which is shown in the chart below.
Conformity Factors for Euro 5 vehicles by manufacturer
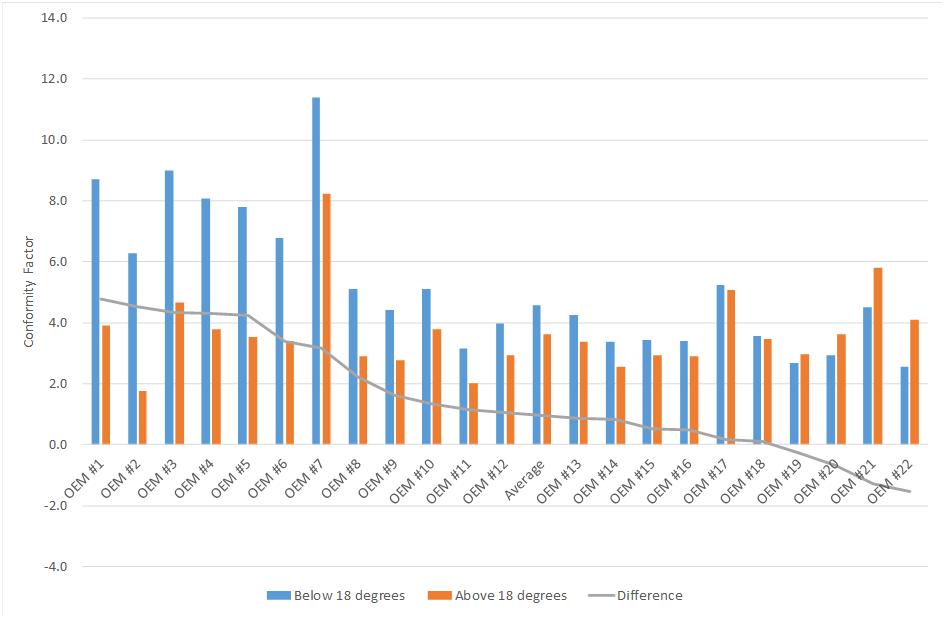
The intention of this newsletter is not to name names, but to indicate that it is not one manufacturer but several that may be utilising the thermal window loophole. If the hypothesis is correct, it could mean that many millions of vehicles on the road today in UK and the colder parts of Europe are putting out higher emissions than expected. Further, as Euro 5s, these vehicles are not that old and therefore will be on the road for many years to come.
Archive
- AIR Alliance 3
- Air Quality 38
- Audio 3
- Climate Change 14
- EQUA Index 21
- Electrified Vehicles 28
- Euro 7 3
- Fuel Consumption/Economy 20
- Fuels 4
- Infographic 18
- Media 4
- NRMM/Off-road 3
- Newsletter 103
- Podcast 7
- Presentation/Webinar 18
- Press Release 19
- Regulation 16
- Reports 4
- Tailpipe Emissions 49
- Tyre Consortium 2
- Tyre Emissions 26
- Vehicle Interior 6