

Podcast: Emissions Analytics featured in CoMotion Postcast
Nick Molden , CEO and Founder had the privilege of being invited onto CoMotions podcast. On the podcast Nick discusses the question on everyone’s mind how can we quickly and cheaply decarbonize mobility?


NEW international Cabin AIR Index launched
Fleet owners, policy makers and drivers now have access to independent, standardised vehicle ventilation ratings
Fleet owners, policy makers and drivers now have access to independent, standardised vehicle ventilation ratings
Easy to understand and comparable ratings provide clarity for drivers and car buyers.
The first independent data set enabling policy makers to protect vehicle occupants.
The independent Cabin AIR Index rates the ability of each filter and ventilation system to protect vehicle occupants from exterior pollution.
The A-E colour-coded rating is endorsed by global air quality and vehicle emissions experts.
Moe information available at www.airindex.com/emissions-ratings/cabin-air-quality-in-cars/
25 July 2023: Today’s launch of the Cabin AIR Index reveals, for the first time using scientific data, the effectiveness of vehicle ventilation systems and the choice of filters in reducing the exposure of vehicle occupants to harmful pollutants.
Developed from more than five years of independent, international research the new Cabin AIR Index ratings reveal accurately how much pollution enters a vehicle compared to the outside air, when it is used in towns and cities.
Exposure to high levels of pollutants in the air can cause a range of serious health issues including respiratory problems, heart disease, strokes and lung cancer¹.
The air quality inside cars and vans (M1 and N1 categories²) is unregulated, leaving drivers and passengers unaware of the levels of exposure to damaging pollutants. In Europe alone, air pollution is estimated to cause more than 300,000 premature deaths each year³.
The Cabin AIR Index has been created to inform and empower drivers, passengers, fleet owners and policy makers with the real facts about the protection offered by the ventilation systems and filters in the cars they use and travel in. A simple A-E colour-coded rating, based on a new real-world standard, shows the difference in effectiveness in filtering harmful pollutants.
In 2021 more than 97% of the urban population was exposed to concentrations of fine particulate matter above the health-based guideline level set by the World Health Organization⁴. Drivers and passengers, and in particular professional drivers who are in vehicles for several hours each day are now able to compare vehicles and the filter systems, enabling choice, for the first time based on scientific data.
Today’s launch of the Cabin AIR Index also reveals the significant variation in protection offered by the same vehicle, depending on the type of interior air filter used. When tested on the same car, the combination of ventilation system and one filter was only able to reduce the level of exposure to outside particles for drivers and passengers by 30% during the course of the test, whilst the best performing combination of system and filter achieved 82%.
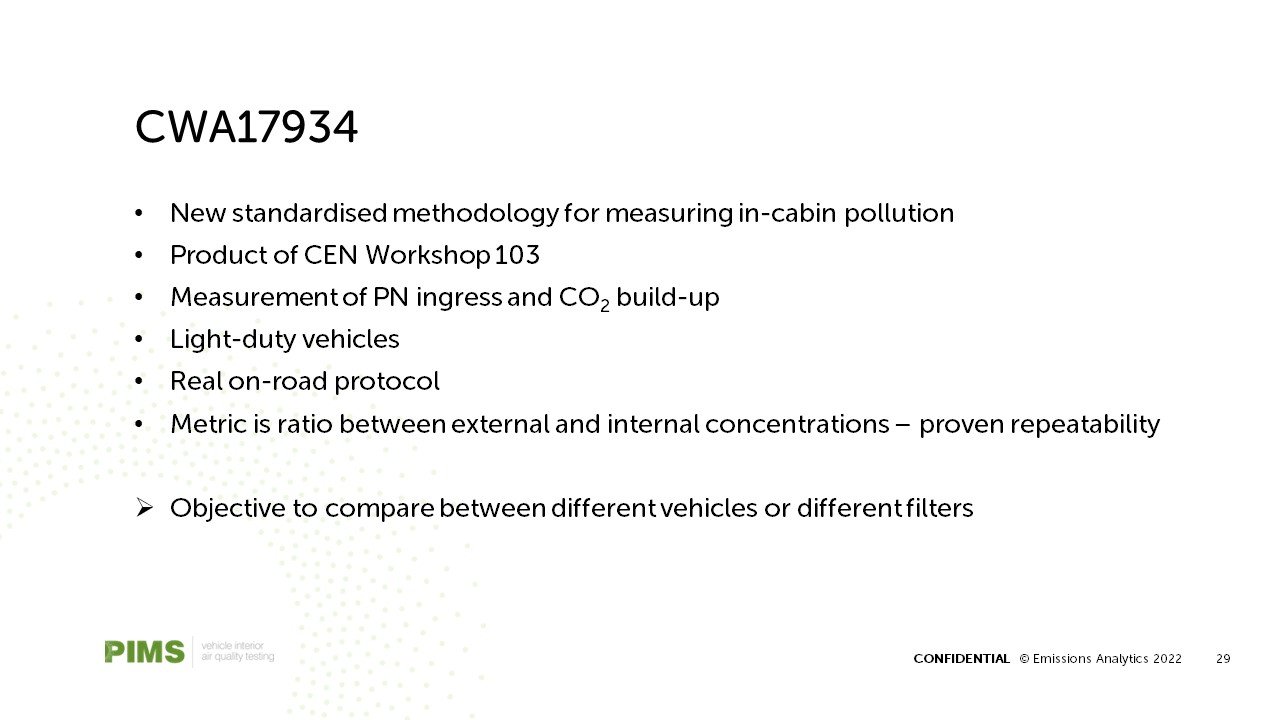
The Cabin AIR Index ratings show ‘at a glance’ how effective the vehicle ventilation system is, allowing comparison with other vehicles, and other filters installed based on scientifically robust, repeatable, on-road vehicle testing according to the new CWA 17934 methodology.
Massimo Fedeli, Co-founder and Operations Director of the AIR Alliance said: “The health effects of breathing fine particulate matter in urban air are now, sadly, well established and estimated to cause more than 300,000 premature deaths in Europe each year. Drivers and passengers in urban areas may assume that closing windows and using the ventilation system prevents exposure to particulate matter, but that is not necessarily the case.
“Following five years of research, today the AIR Alliance is launching the Cabin AIR Index which rates the ability of the ventilation system to filter the number of particles from outside the vehicle and presents the results in a simple A-E colour coded scale.
“The Cabin AIR Index is the first opportunity for drivers and passengers to see the protection offered by vehicle ventilation systems, and also reveals the difference in performance between different filters fitted to the same vehicle, enabling drivers to make a choice when selecting the filter for their car or van.”
Nick Molden, Co-founder of the AIR Alliance said: “The Cabin AIR Index is based on data collected according to the CWA 17934 methodology, the independent, scientifically robust methodology to collect real drive vehicle interior air quality data. In the absence of any regulations for air quality inside cars and vans, drivers and passengers are unaware of the levels of pollution, and in particular the number of particles which enter the cabin.
“Drivers, and especially professional drivers who are in the vehicle for several hours each day, should be aware that the choice of interior air filter can make a significant difference to the quality of air that they breathe. Our tests show that the same ventilation system fitted with different, but compatible filters, reduced the level of exposure to outside particles for drivers and passengers between 30% and 82%.
“We have worked hard over the last three years with our independent, expert academic and industry group to define standardisation of data collection through the CEN Workshop Agreement 17934. We rate data collected by this method on the Cabin AIR Index providing comparative information between vehicles using fair testing criteria, all conducted on-road in real driving conditions. The same standardised test is applied to each different car type.
“For the first time policy makers and fleet owners have the ability to protect vehicle occupants, using the Cabin AIR Index to define the minimum standards expected to protect occupants.”
The results of the seven filters tested for the AIR Alliance on a 2018 Nissan Qashqai and rated in the Cabin AIR Index are:

*Cabin Air Quality Index (CAQI) as defined in the CWA Workshop Agreement 17934
**the age, make and part number of the interior filter which was pre-installed in the test vehicle was unknown.
The AIR Alliance has now commissioned a programme of vehicle and filter testing and more results will be added to the Cabin AIR Index periodically.
About the Cabin AIR Index
Vehicle ventilation systems for cars and vans (M1 and N1 categories2) rated for the Cabin AIR Index are tested according to the CWA 17934 standardised methodology which ensures that the results are independent, repeatable and comparable.
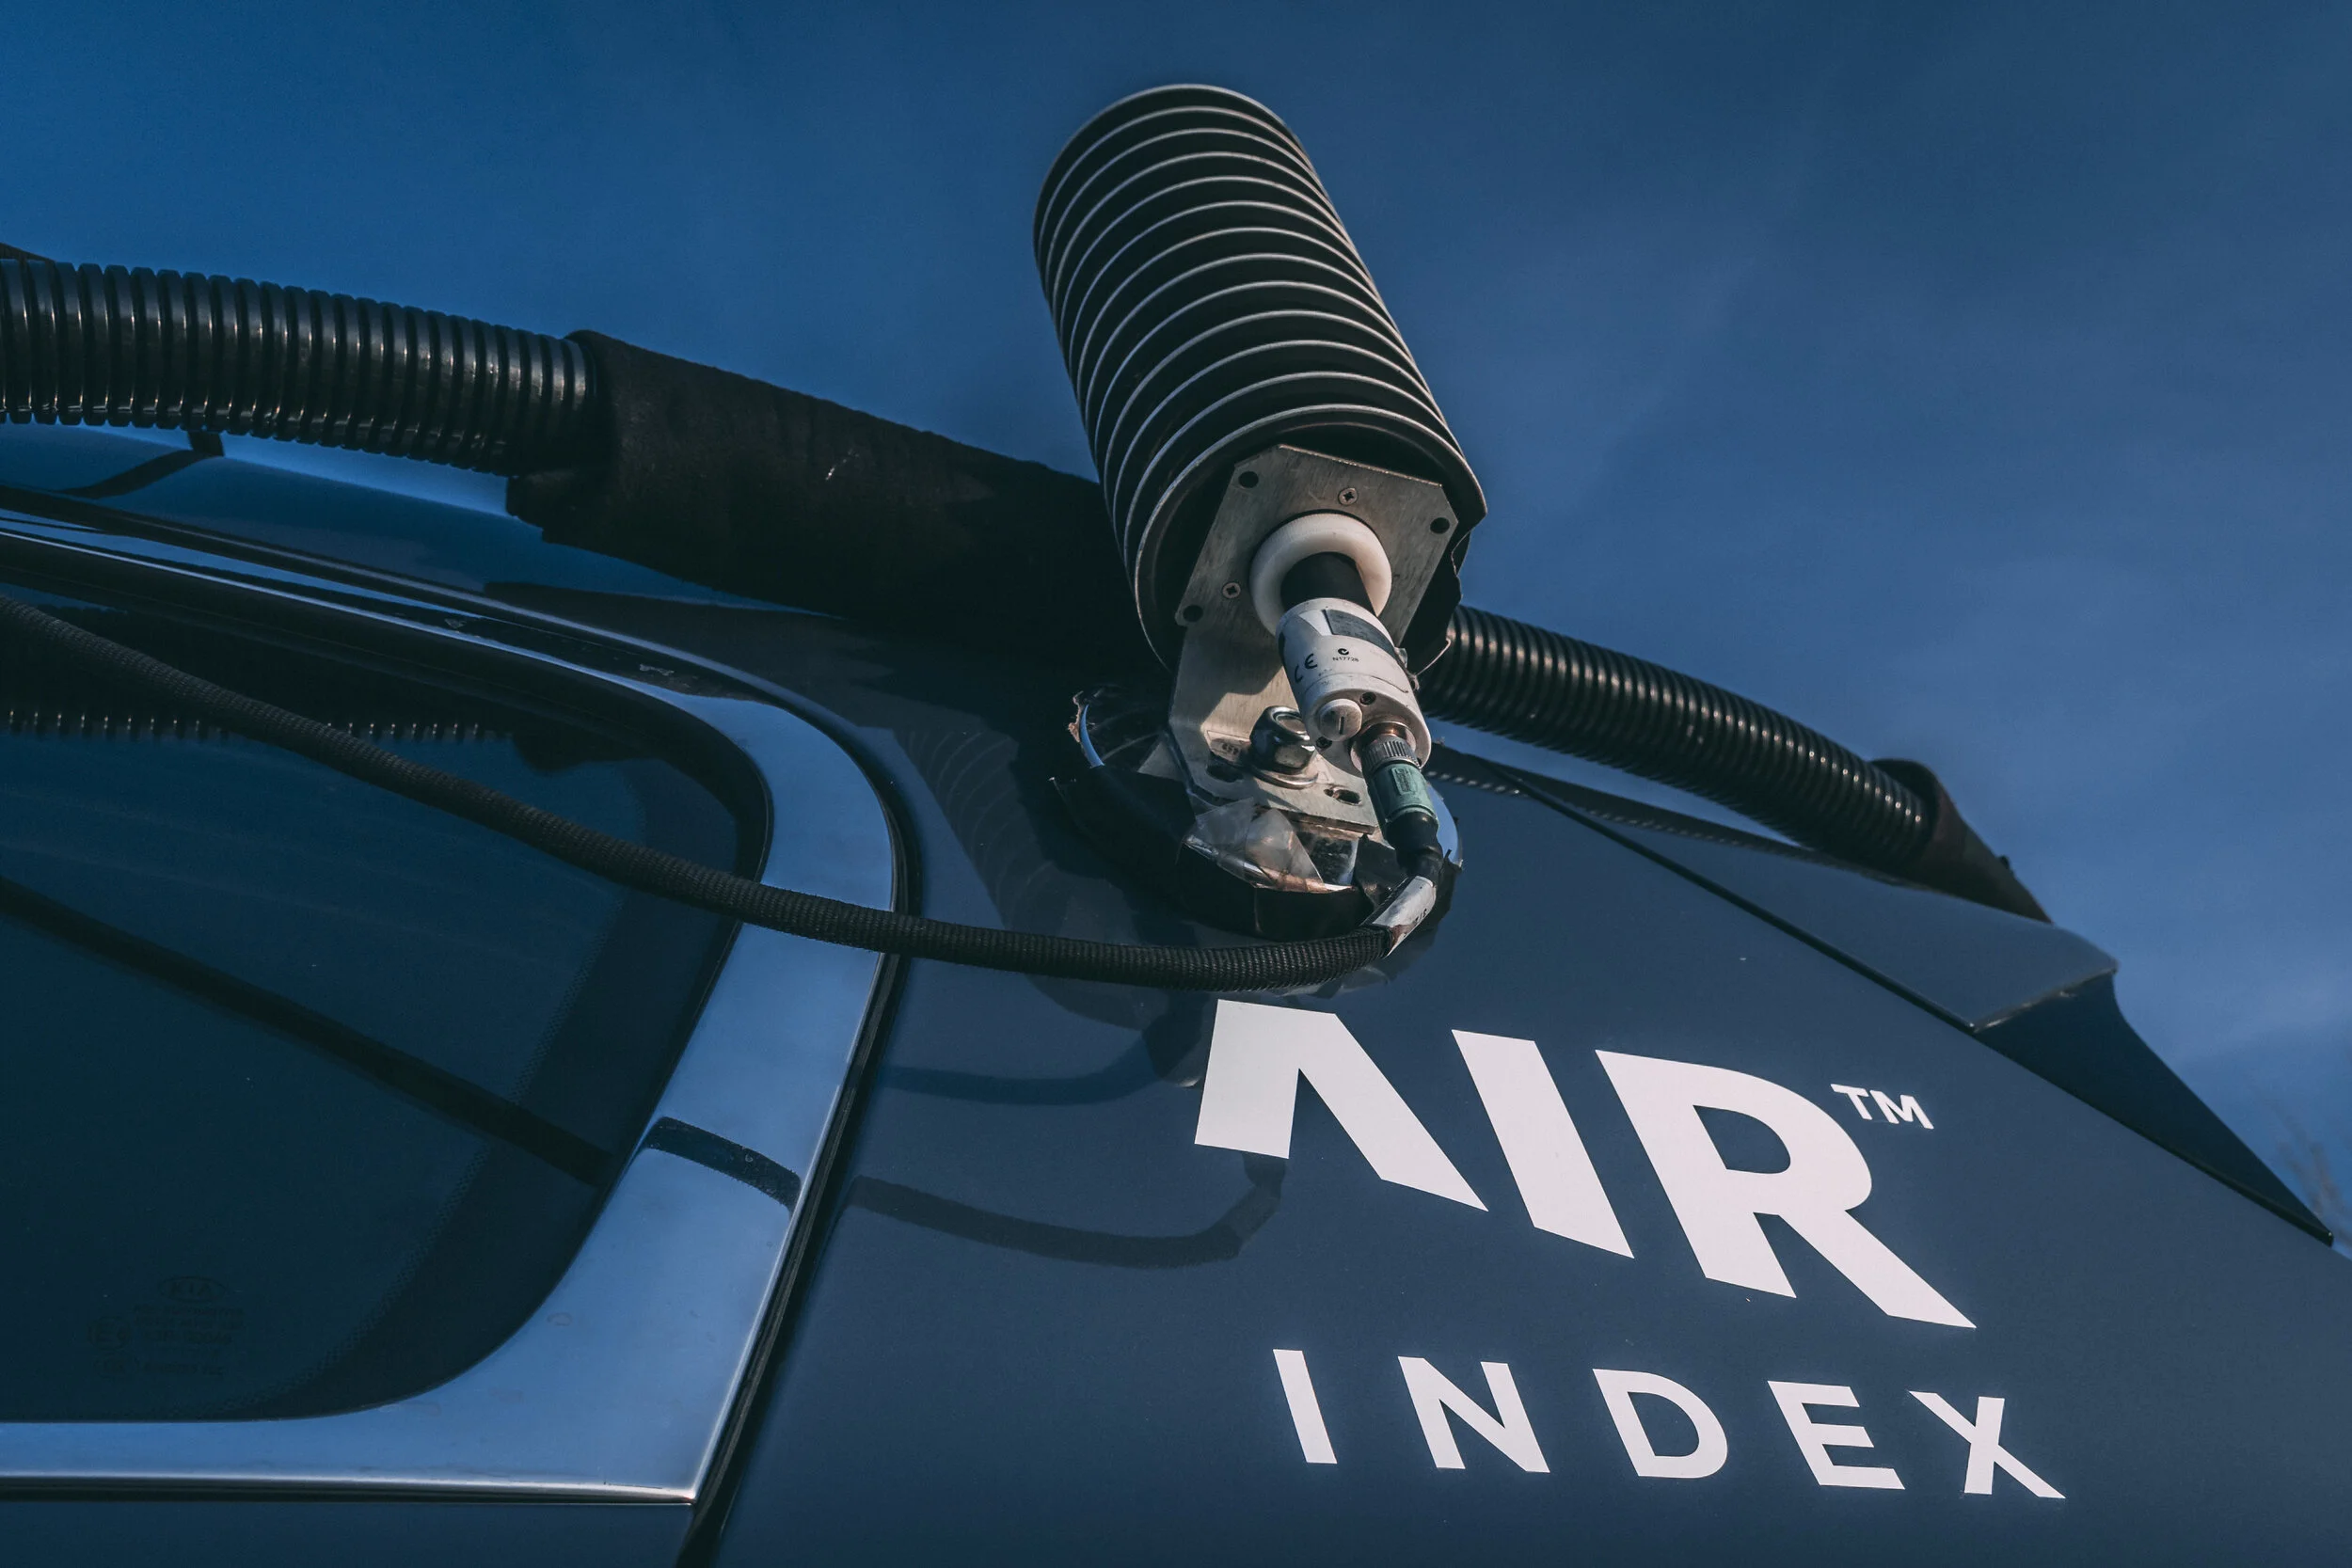
The testing is carried out on a vehicle, sourced independently from vehicle manufacturers, with Pollution In-cabin Emissions Measurement Systems (PIMS) equipment recording the air quality inside and outside the vehicle during on-road driving in towns and cities.
For a result to be considered acceptable for rating in the Cabin AIR Index at least three sperate tests must be conducted on each model, within specific boundary conditions⁵ at an average speed between 30 km/h and 50 km/h, with each test lasting at least 30 minutes.
Testing is conducted with the ventilation system in ‘fresh air’ mode, the air conditioning turned off, and temperature set to 19°C in either automatic mode, or 50% fan speed if manual, and the vents facing forward and level.
The results of the tests provide the basis to rate the vehicle ventilation systems according to the A-E, colour-coded scale.

Cabin AIR Index ratings
The AIR Index website reports the first tests conducted on a single vehicle with different filters showing Cabin AIR Index ratings A-E. Car buyers and fleet operators should consider carefully the implication for the health of vehicle occupants when selecting the vehicle and choice of filter to minimise the ingress of harmful particles.
Background to the Cabin AIR Index testing process
Emissions Analytics, founded by Nick Molden (Co-founder of the AIR Alliance), was a pioneer in methodologies to test on-road tailpipe emissions using Portable Emissions Measurement Systems (PEMS) equipment. Since 2018 Emissions Analytics has also independently tested the air quality inside vehicles using Pollution In-cabin Emissions Measurement Systems (PIMS) equipment, and the insight gained from more than 100 tests conducted by Emissions Analytics informed the development of the CEN Workshop agreement which led to the CWA 17934 methodology from which the Cabin AIR Index has been created.
For more information see https://www.emissionsanalytics.com/vehicle-interior-air-quality.
¹ World Health Organization https://www.who.int/news-room/fact-sheets/detail/ambient-(outdoor)-air-quality-and-health
² Vehicle Approval categories https://www.gov.uk/vehicle-approval/individual-vehicle-approval-manuals
³ Air quality impacts in Europe European Environment Agency https://www.eea.europa.eu/publications/air-quality-in-europe-2021
⁴ Europe’s air quality status 2023 https://www.eea.europa.eu/publications/europes-air-quality-status-2023
⁵ More details about CWA 17934 and the boundary conditions are available at the CEN website https://standards.cencenelec.eu/dyn/www/f?p=CEN:110:0::::FSP_PROJECT,FSP_ORG_ID:76650,2654151&cs=1A37B6A2248CB063033111B9F708BAB58
AIR welcomes the publication of a standardised method to collect vehicle interior air quality data
The AIR Alliance (Allow Independent Road-testing), the independent alliance set up to improve air quality by promoting independent, on-road vehicle emissions testing, welcomes the publication of the CEN workshop agreement CWA 17934, the real drive test method for collecting vehicle interior air quality data.
Emissions Analytics was pleased to support the AIR Alliance with testing to validate this new standardised method for measuring vehicle interior air quality, so it can help reduce the exposures to pollution for drivers and passengers.
Webinar: Exposures to particles and volatile organic compounds across multiple transportation modes
Our CEO & Founder, Nick Molden presented a webinar on Exposures to particles and volatile organic compounds across multiple transportation modes on 14th December 2022. To watch the webinar and download the presentation please see below.
Our CEO & Founder, Nick Molden presented a webinar on Exposures to particles and volatile organic compounds across multiple transportation modes on 14th December 2022. To watch the webinar and download the presentation please see below.
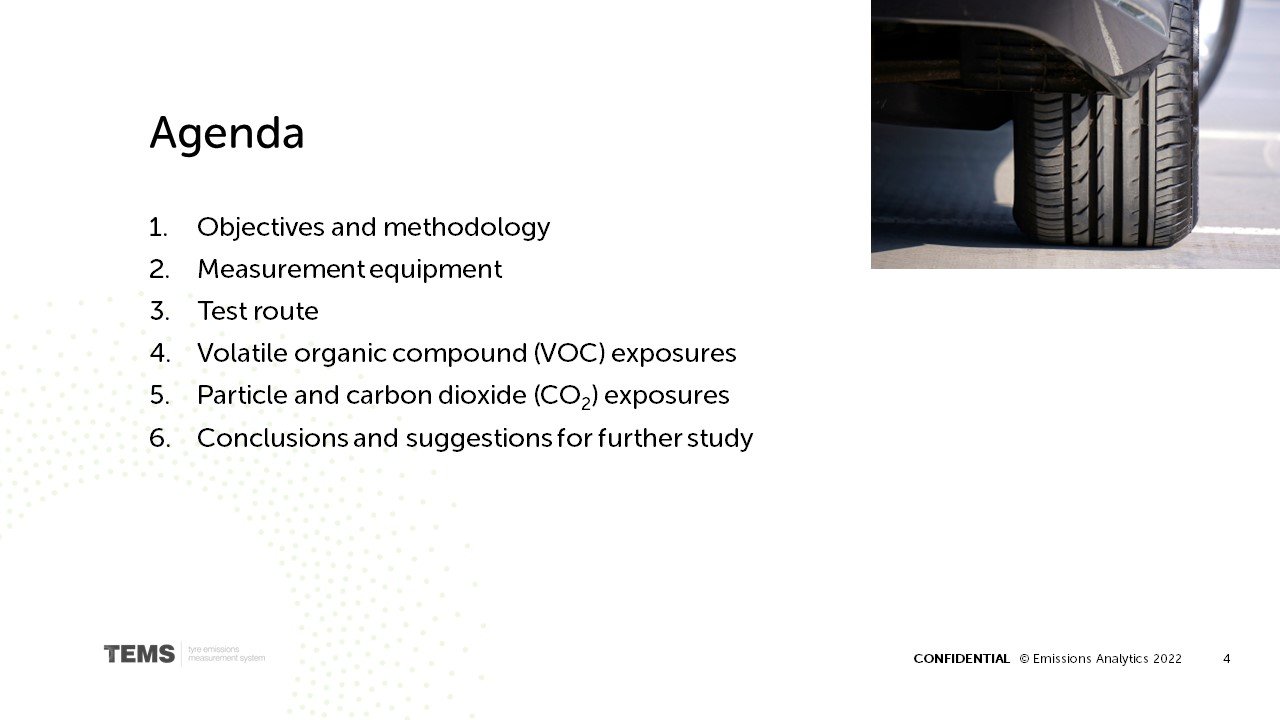
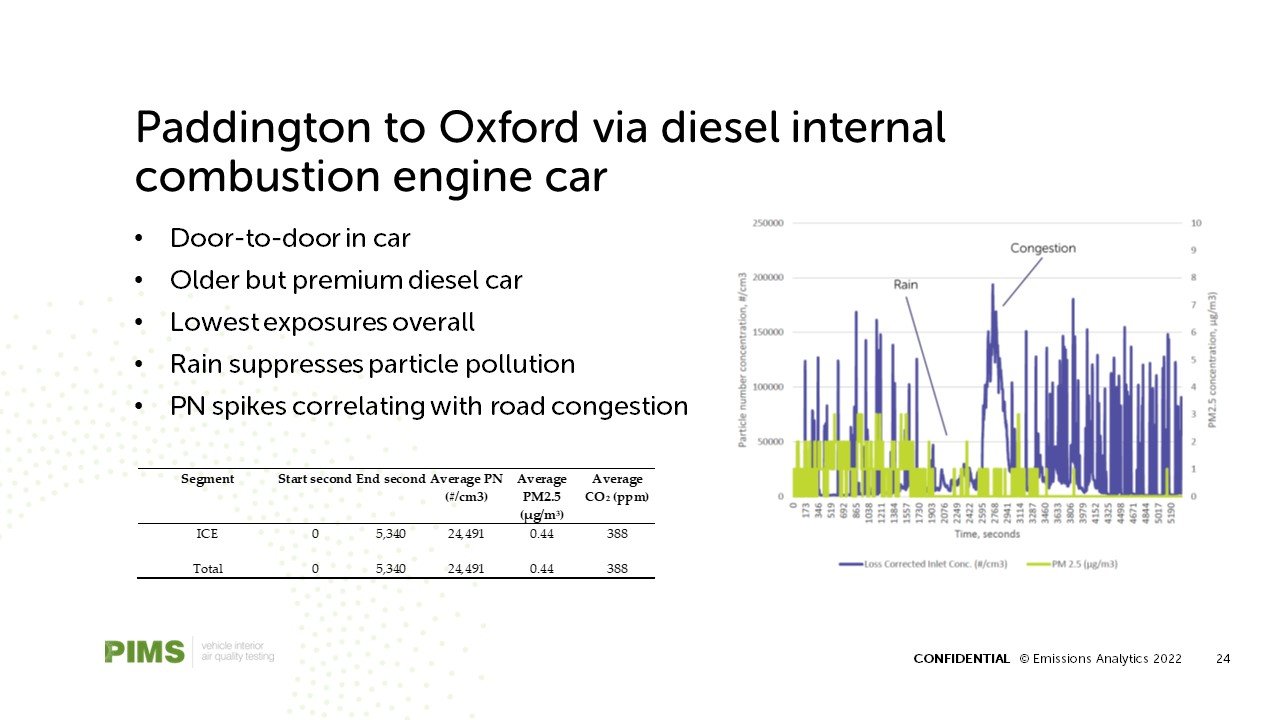
The webinar covered what’s is cleanest way to get from London Paddington to the centre of Oxford? Not in terms of tailpipe emissions, but rather in terms of the traveller’s own exposure to the air quality inside the mode of transport. Emissions Analytics studied this in a project for the TRANSITION Network in the UK, and this webinar will present the findings.
Personal exposures were tested in real-world conditions across nine different transport modes on journeys, covering active travel, public transport and private cars. Such exposures are relevant to questions of traveller comfort, safety in the context of airborne diseases such as Covid-19 and a growing awareness of health, safety and productivity effects of interior air quality. Pollutants measured were particle number, particle mass, carbon dioxide and speciated volatile organic compounds, using devices carried on or with the traveller.
The results will reveal the most and least polluted methods of transport, and the likely sources of the pollution. Further, the dynamic nature of pollution will also be shown, to quantify when total exposures are mostly driven by short, larger spikes rather than persistent lower levels. The findings are intended to feed into the growing body of work around vehicle interior air quality, including the new CEN standardised methodology, CWA17934.


Smellovision - Engineering odours in cars
Passenger cars are intricately designed products. Their impact on the environment is similarly intricate and complex. We are now moving decisively beyond the age when the dominant impact was exhausting burnt fossil fuel directly to the air.
Passenger cars are intricately designed products. Their impact on the environment is similarly intricate and complex. We are now moving decisively beyond the age when the dominant impact was exhausting burnt fossil fuel directly to the air. For modern internal combustion engine (ICE) vehicles, tailpipe emissions have been dramatically reduced even where fossil fuels are still combusted. Further reductions are potentially within reach with synthetic fuels and increased hybridisation.
In contrast, other emissions are increasing – not just relatively, but absolutely. Vehicles are becoming bigger and heavier, leading to greater manufacturing emissions, in-use tyre wear emissions and end-of-life disposal or recycling costs. Possibly the least understood trend among car buyers is how environmental concerns are impacting the air quality in the vehicle cabin as new and innovative materials, treatments, glues and fragrances are deployed. While tailpipe pollution entering the cabin has been studied by Emissions Analytics and others, the interaction of the volatile organic compounds (VOCs) from these new interior materials is complex. However, doing so is important, as these VOC can hang around in the confined space of the vehicle cabin to be inhaled, and can have impacts on aspects from comfort to human health.

The most obvious manifestation of this problem is bad smells in cars. While Western car buyers tend to like the ‘new car smell’, Asian buyers are less keen. Removing this new car smell has, therefore, been the focus of regulations in Japan, Korea and other countries. The reason for this is that due to different physical sensitivities to certain VOCs commonly found in car materials. But it is not just about the new car smell, as hundreds of VOCs are present in the cabin and they interact in unpredictable ways, which can generate unexpected ‘off odours’. As traditional materials are swapped for new ‘eco’ or other alternatives, or seat covers are treated with less toxic chemicals, or the vehicle is constructed with more glues rather than rivets, the challenge and risks of bad smells grows. Further, deliberate science is put by manufacturers into creating desirable, on-brand, odours.
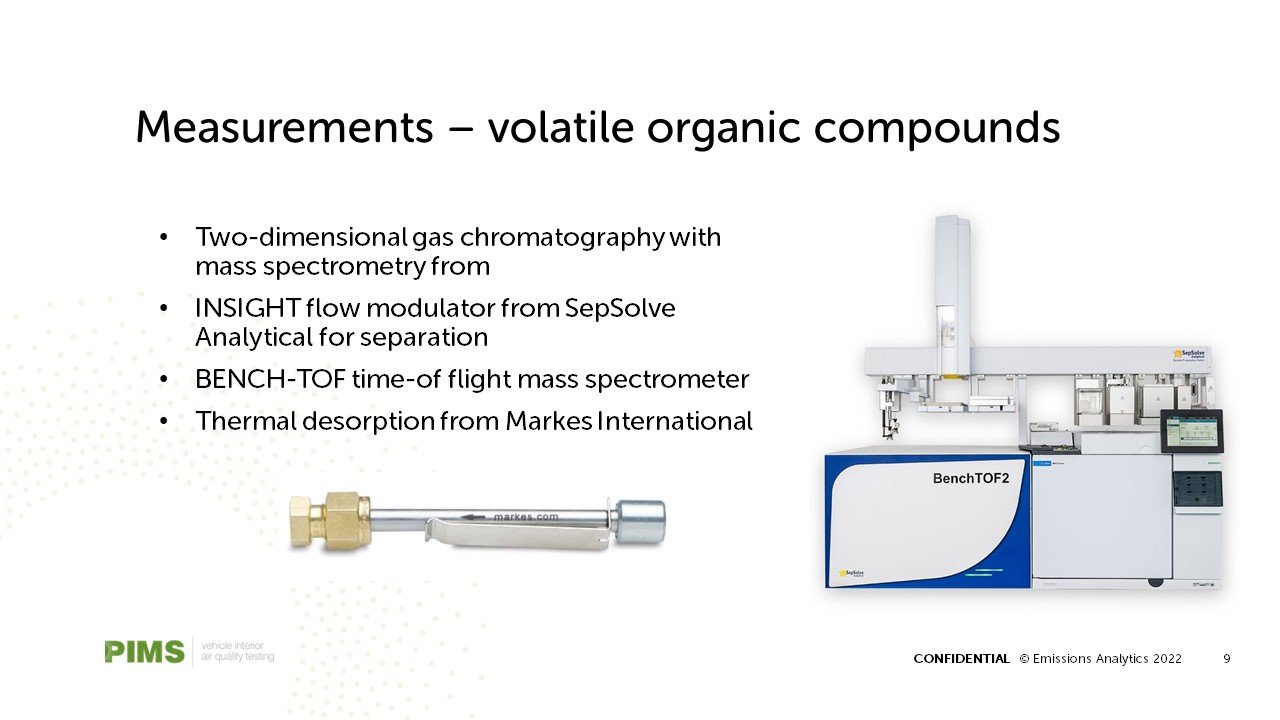
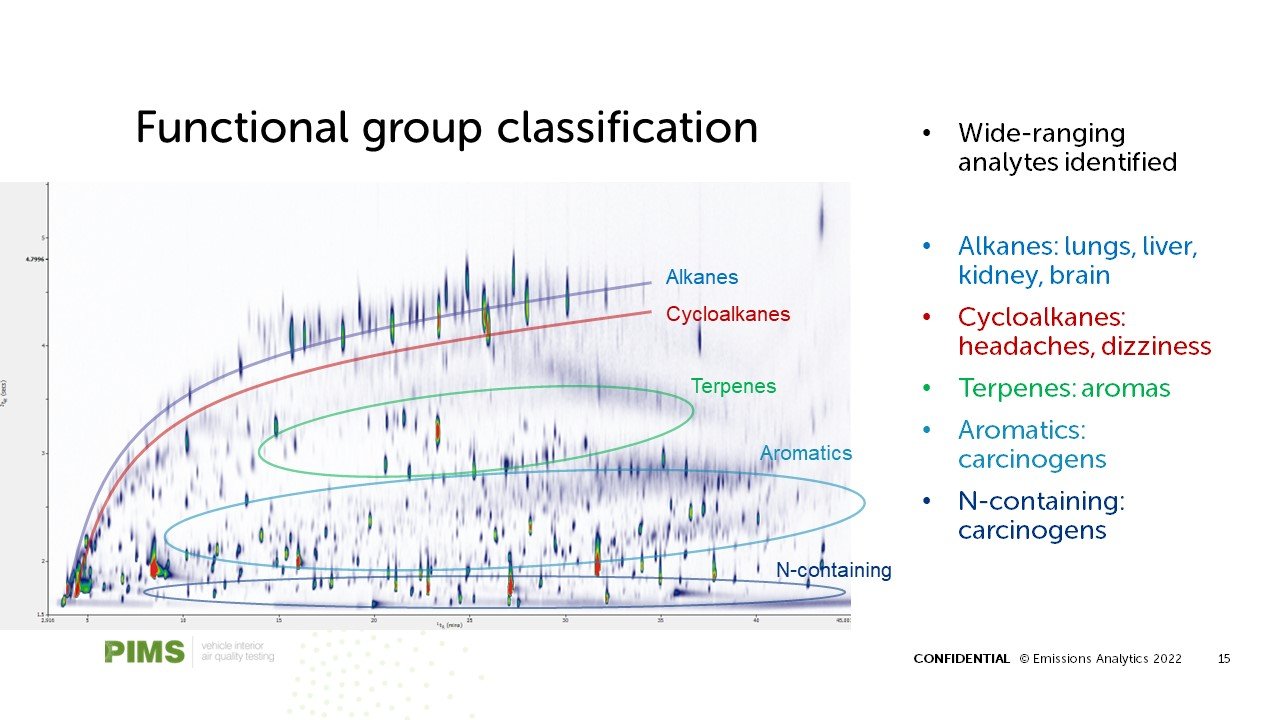
Emissions Analytics is actively developing new methods to design, describe and manage the olfactory contours of vehicles on sale today, and to understand the interaction with the ventilation system to create maximum consumer comfort and minimise any health impacts. To achieve this, we have taken controlled samples of the air inside a wide range of vehicle cabins and then subjecting the samples to two-dimensional gas chromatography and time-of-flight mass spectrometry analysis to profile the VOCs present in depth. Our laboratory has been provided by Markes International and SepSolve Analytical. This method is significant as it allows almost complete separation of the VOCs present, unlike more basic methods that cannot separate the higher molecular weight compounds, which are often the most potentially deleterious. Even with good separation, identification of the compounds is a challenge as many are not present in the standard spectral libraries. To resolve this, Emissions Analytics has compiled its own specialist library.

Historically, this sort of odour analysis has been performed by highly trained human ‘noses’. This has the advantage of directly gaining the human experience, with all that complexity and subjectivity. This remains important as just knowing all the chemicals present does not necessarily mean the human experience can be predicted. However, where a bad smell is detected, the analytical method provides a way of diagnosing and resolving the problem in a way that a human cannot necessarily do.
It should also be recognised that off odours do not necessarily correlate with a negative health impact on the human occupants of a vehicle, nor does the absence of any bad smell guarantee there is no impact. Even where a known toxic chemical is found in a vehicle, it may not be at a concentration that causes an actual negative effect. Concentration and exposure time are important added dimensions. The levels of VOC exposures were studied in 2019 of taxi drivers in Barcelona – a group of vehicle users for whom prolonged exposures are an issue. Given these considerations, Emissions Analytics has been actively contributing to the CEN Workshop 103 that aims to standardise a method for measuring vehicle interior air quality, which will be published soon. Being able to measure the freshness of air in the cabin will make possible the estimation of VOC exposures.
Looking at the initial testing from a range of interiors, it becomes clear that the VOC soup differs significantly between different manufacturers and of vehicles of different ages. The table below summarises the findings, including a ‘toxicity potential’ rating. This is calculated by combining the concentrations measured by Emissions Analytics and information from the European Chemicals Agency database of compounds and their hazard statements. The rating is a unit-less measure designed for comparative assessment of vehicles. As can be seen, Vehicle #1 has the highest rating, almost four times the average of the five vehicles, and around 28 times greater than the lowest potential toxicity vehicle, Vehicle #4

With an average of over 800 compounds identified, this demonstrates how rich a mix the air in a car can be, and the complexity of the task to separate, identify and quantify them. The total concentration of organic compounds is split into four functional groups, from alcohol (generally the least problematic) to polycyclic aromatic hydrocarbons (PAHs) and nitro-aromatics (with the highest incidence of carcinogenic effects). The alkane and aromatics groups are generally the most prevalent and are often associated with solvents, glues and plastics used in vehicle construction. Vehicle #1 stands out in these respects, whereas Vehicle #3 – low in other respects – is relatively high in PAHs and nitro-aromatics.
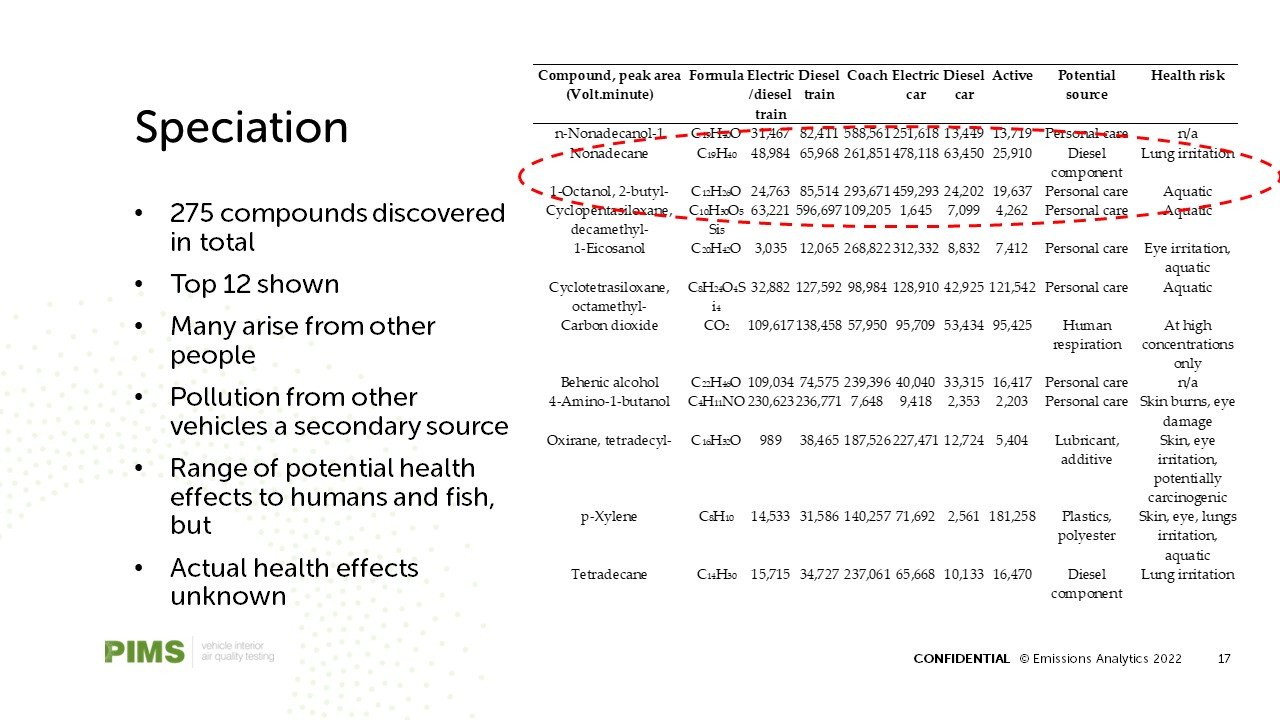
Among these compounds, many are common between vehicles. Across these five cars, the most prevalent ten compounds, with their concentrations and a descriptions, are shown in the table below. These pumped samples were taken after the vehicle had been soaked overnight in controlled temperature conditions. The third compound, octanoic acid‚ 2-propenyl ester, is associated with a pineapple aroma in the vehicle.

Beyond these, the individual characteristics of a vehicle tend to be made of some specific, high-concentration compounds and then a long tail of low-concentrations ones. Taking the toxicity potential score, beyond the top ten common compounds above, the highest rated compound in each vehicle is shown below.

This confirms that Vehicle #1 has a greater potential issue than the other vehicles, but the approach demonstrates that the compounds causing this can be identified and their contribution quantified. In this way, the manufacturer can diagnose the problem and consider how to alter the construction of the vehicle to mitigate. This may require substituting materials or methods, but, in doing so, new interactions of chemical compounds need to be assessed as well.

In summary, with ICE vehicles achieving much lower tailpipe emissions and the increased uptake of hybrid and electric vehicles, the impact of non-exhaust emissions is of growing concern for human health and the environment. This means it is now important to obtain a comprehensive view of all possible sources of VOCs from vehicles, including emissions from materials, such as foam, carpeting and seat covers, as well as those generated through tyre wear.
The recent global push towards a circular economy has also meant that automotive manufacturers are being urged to improve the sustainability of their operations by increasing the use of recycled or renewable materials, such as innovative plant-derived plastics. Robust quality control is essential to ensure these novel products will not produce volatile emissions that could be considered harmful or malodourous. Therefore, is not just about vehicle design to create a particular aesthetic, but also for hazard reduction and risk management.
However, the sample complexity, as well as an ever-expanding list of compounds of concern, makes it a challenge for those responsible for performing sampling and analysis. This has led to a need for innovative new methods to be created for complete emissions characterisation. Emissions Analytics is leading through its new laboratory and contribution to standardising measurement methods, with the aim of reducing the overall environmental emissions of future vehicles.
The septillion particle problem (literally)
That’s 1,000,000,000,000,000,000,000,000 exhaust emissions particles that are due to be emitted in the United States that don’t need to be. How? A large majority of European and Chinese cars are now sold with tailpipe particle filters, known as gasoline particulate filters (GPFs) or diesel particulate filters (DPFs) in the industry, but this is not the case in the US.
That’s 1,000,000,000,000,000,000,000,000 exhaust emissions particles that are due to be emitted in the United States that don’t need to be. How? A large majority of European and Chinese cars are now sold with tailpipe particle filters, known as gasoline particulate filters (GPFs) or diesel particulate filters (DPFs) in the industry, but this is not the case in the US. Focus on small, ‘ultrafine’ particles in the European regulations has driven gasoline exhaust filter adoption in a way that has not happened in the US, where particulate mass measurement has primacy, and effectively ignores these ultrafines.
A gasoline vehicle with a filter emits around 0.9 x 10¹¹ particles per mile (90 billion), but without a filter it is about 6.3 x 10¹¹ (630 billion), according to testing conducted by Emissions Analytics. With about 300 million internal combustion engine (ICE) vehicles likely to be on the road on average over the next ten years, each driving an average of 10,000 miles per year, that put the total number of ‘unnecessary’ particles emitted to US air to be 1.6 x 1024, or 1.6 septillion particles. If each particle were a dollar bill, the whole of the US could be carpeted over half a mile deep in money.

It is important, however, not to think of these particles as creating visible plumes of black smoke from the tailpipe. That is the clichéd image of exhaust particles, but that applies to older diesel vehicles without a particle filter. For gasoline vehicles, and those with a filter, the concern is for very small particles, down to 10 nm in size, which are invisible, numerous and highly mobile.
These ultrafine particles are of concern for human health, as their small size means that when inhaled they can be drawn deep into the lungs and cross the blood-brain barrier, with potential effects on cognitive development. The direct link to negative health outcomes is not generally considered as proven yet, but Europe has nevertheless regulated due to the weight of evidence and as a precaution. European particle-number-based standards have led to the widespread adoption of GPFs, which are effective at trapping these small particles. This was quickly adopted by China and India.
Even if only particle mass is concerned, on average a gasoline vehicle without a filter emits around 0.070 mg/mile, compared to a vehicle with a filter at 0.027 mg/mile. The unnecessary particle mass to be emitted in the US is therefore forecast to be over 100 tonnes over ten years. Not only does this have the understood impacts on air quality in urban areas, but observations suggest that it eventually migrates to the North and South Poles, settles on the ice, and helps accelerate climate change because of the high ‘black carbon’ content in soot, which is darker and a known global warming agent.
Some would say that this is minor or irrelevant as the light-duty fleet moves to full electrification. However, even on the most aggressive scenarios, new ICE vehicles will be sold in the US for over ten years. Those vehicles are likely to have a lifespan of around twelve years, so these vehicles could be on the road easily for 25 years from today. This does not reflect a lack of ambition in decarbonisation, but a practical reality. In the transition, there is a strong argument that we should do what we can to make ICE vehicles as clean as possible. Emissions Analytics has written extensively before that hybridisation is a better route to quick decarbonations – see a previous newsletter – and, if this position comes to pass, it could mean that hybrid vehicles are sold long after pure ICE vehicles are phased out, and these hybrids emit ultrafine particles in a similar way.
The emissions values described above are the result of programme run by Emissions Analytics in 2021 that tested apparently similar pairs of vehicles between the US (without GPFs) and Europe (with GPFs). The US vehicles were tested in Michigan, and the European vehicles in the UK. Four pairs of gasoline vehicles were tested. First, the three-litre BMW X5 was a 2019 model year in the US and 2020 in Europe. Second, there were two 2020 Jeep Wranglers with a 2.0 litre engine. Third, the full hybrid Toyota RAV4s were 2019 model year with the 2.5 litre engine. Finally, the 2020 1.5 litre Ford engine was tested in the Escape in the US and its equivalent Kuga model in Europe. These vehicles were drawn from different manufacturers and where the models were near-identical in technical specification and model year between the two regions. That said, in each case, the Europe vehicle was equipped with a GPF, while the US vehicle was not.
Each vehicle was then tested on similar on-road routes in the two countries to allow the comparison of their particle mass and number emissions. The gas emissions and particle number were measured using a regulatory-approved portable emissions measurement system (PEMS) from Sensors, Inc, together with a diffusion charger for particle mass measurement. Similar on-road routes were designed in both locations, which, despite the inevitably different traffic and ambient conditions, were shown to have similar dynamics overall. The average emissions across the four pairs of vehicles are shown in the charts below.


The results were highly consistent between the four vehicles. They were also consistent between different types of driving, from urban cold start to highway warm start. The table shows that the average reduction in particle number was 86% across the different vehicles and driving. The variation was from 76% to 96% – in all cases, the reduction was impressive. As the vehicle specifications were near-identical in other respects, it is very likely that the improvement is due to the GPF. While there were some differences in the chemical composition of the standard pump fuel used in both locations, this would not account for a significant proportion of this reduction.
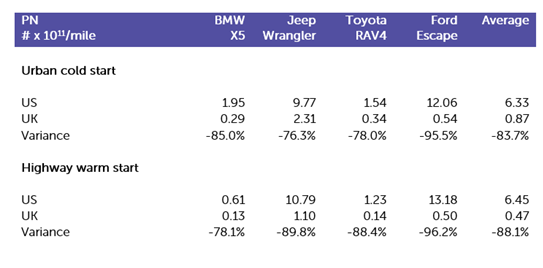
The equivalent overall particle mass reduction was lower but still impressive at 55%, with 81% reduction on the highway. Despite this positive performance, the question remains as to whether the benefit in improved air quality is worth the extra cost. A GPF system typically costs less than $200, which is about the same cost as the optional carpet mats on the BMW X5. Therefore, the cost for removing every billion particles emitted into the air is just 0.0004 cents. In addition to this, there is the further potential benefit of removing particles from the air that have come from other sources. As Emissions Analytics has shown in another newsletter, diesel particulate filters (DPFs) can ‘clean’ the air as the vehicle drives. GPFs are now achieving filtration efficiency rates – typically 80%, with the next generation of GPFs for Euro 7 regulations likely to exceed 95% – that are getting close to those of DPFs, and so the same net-cleaning effect can be expected. Moreover, the filtration efficiency tends to improve with the age of the filter, so the positive effect, if anything, grows.
The septillion particles mentioned above may even underestimate the potential for emissions reduction. The numbers are based on a rapid transition to full battery electric vehicles (BEVs), with no tailpipe emissions. However, this transition may not be as fast as anticipated, which would mean more ICEs for longer. Widespread installation of GPFs would, therefore, generate greater benefits over a longer period. But even as BEVs take off, there is growing evidence that they emit more tire wear emissions that ICE vehicles due to their increased weight. Emissions Analytics’ tests showed a 21% increase in tire particle mass emissions for 500 kg extra vehicle mass – roughly equivalent to the mass of a large battery pack – although this may be partially offset by the effect of regeneration breaking. More generally, there is an on-going trend towards heavier vehicles of all types, which increases tire emissions. Even though only 10-20% of tire wear emissions hang in the air, GPFs could have the added benefit of removing these particles from the air. In other words, ‘legacy’ ICE vehicles could help clean up emissions from BEVs.
Put another way, GPFs bring direct value, but also have an important ‘insurance’ effect that ensures there is benefit however the vehicle car parc evolves.

With filters on gasoline cars in Europe and China, and even coming soon to India, it is surprising that most new car sales in the world's second largest car market are not equipped with the best available technology for emissions reduction. There are signs that this might change, however. Even if US regulators do not embrace particle number as a measure that should be regulated, the potential reduction of the particle mass limit to 1 mg/mile at normal and cold temperatures (20°F or -7°C) might enable cleaner air in the US with widespread deployment of GPFs.
Few things in emissions control are a no-brainer. Mostly, awkward trade-offs between cost, vehicle utility and emissions reduction have to be resolved. In this case, the benefits appear high, costs relatively low, and risk minimal.
Credits: BMW VX images from BMW and www.thecarconnection.com.
The great public transport squeeze
Public transport, almost by definition, works when it is packed. As demonstrated at the current time, with usage at around three-quarters of pre-pandemic levels, the economics of many parts of public transport are in crisis, not least at Transport for London.
Public transport, almost by definition, works when it is packed. As demonstrated at the current time, with usage at around three-quarters of pre-pandemic levels, the economics of many parts of public transport are in crisis, not least at Transport for London. A similar pattern is seen with environmental impact: per passenger, a full bus has lower carbon dioxide (CO2), nitrogen oxide (NOx) and particulate emissions than a car; but a near-empty bus is worse. But there is another, less well understood, aspect of public transport regarding the users’ exposure to pollution while travelling, which presents a further challenge to rebuilding these modes. Looking forward, not just do emissions and economics need to be considered, but also the comfort and health of passengers.
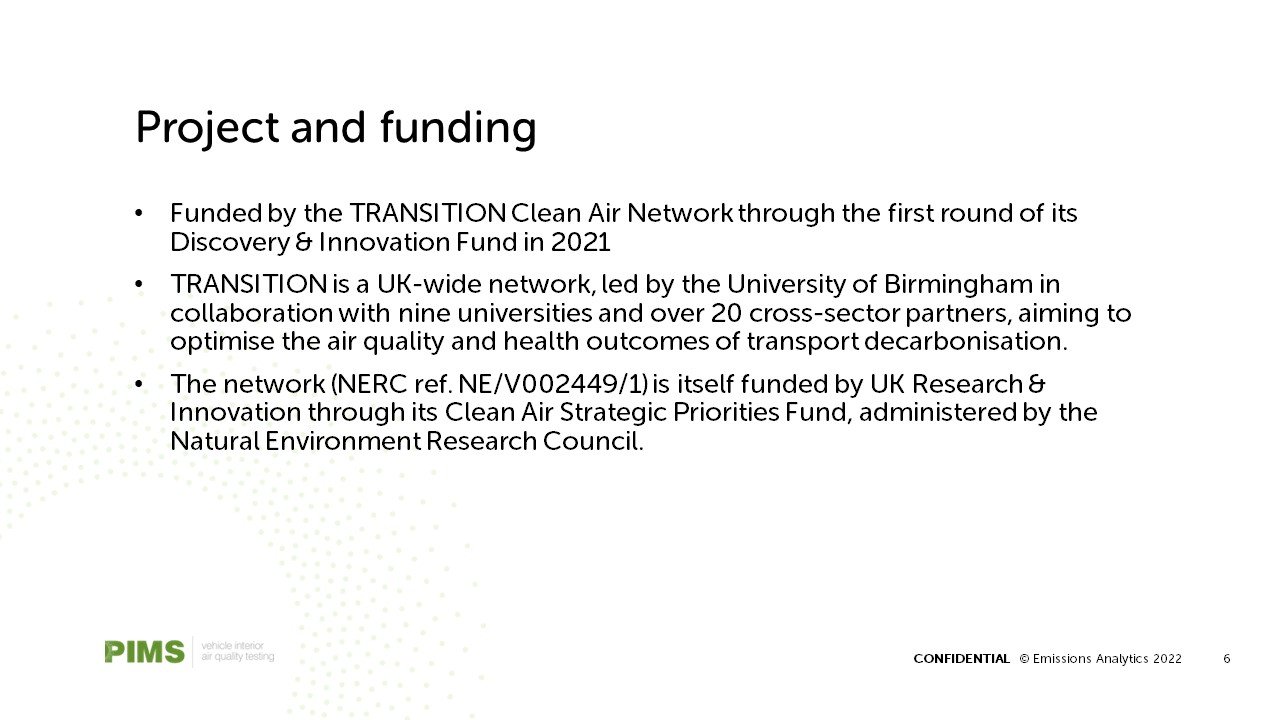
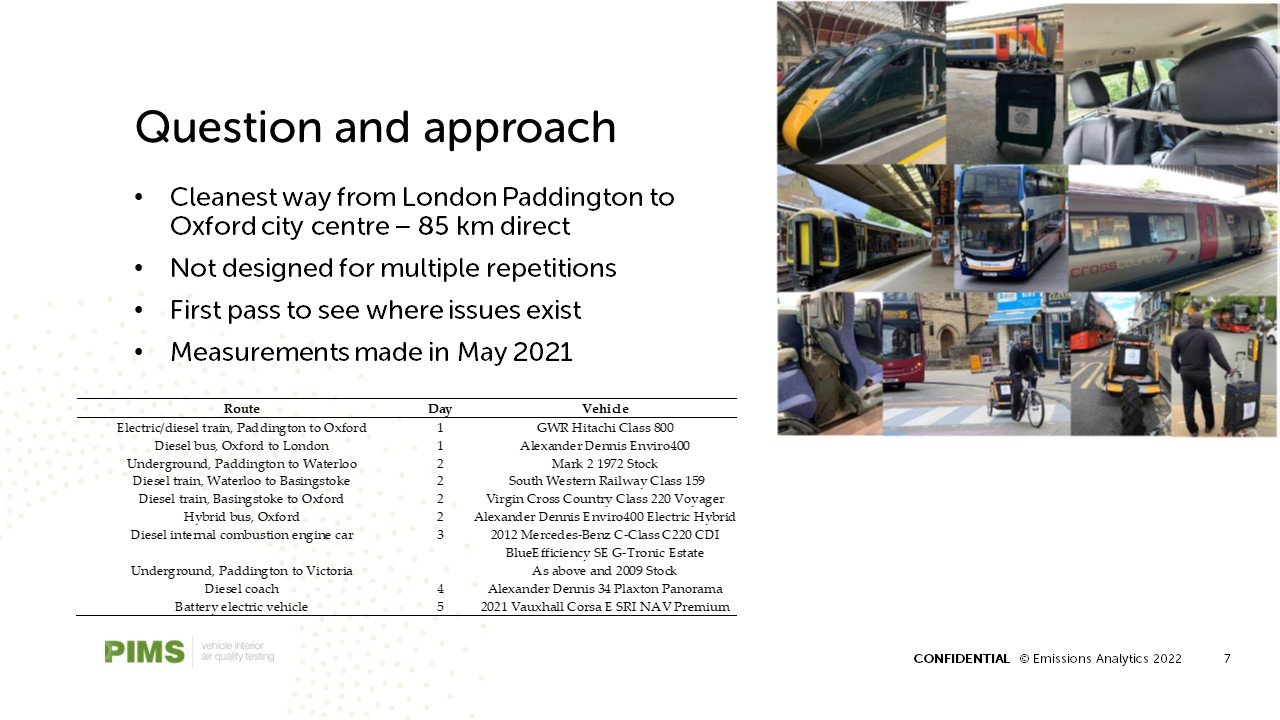
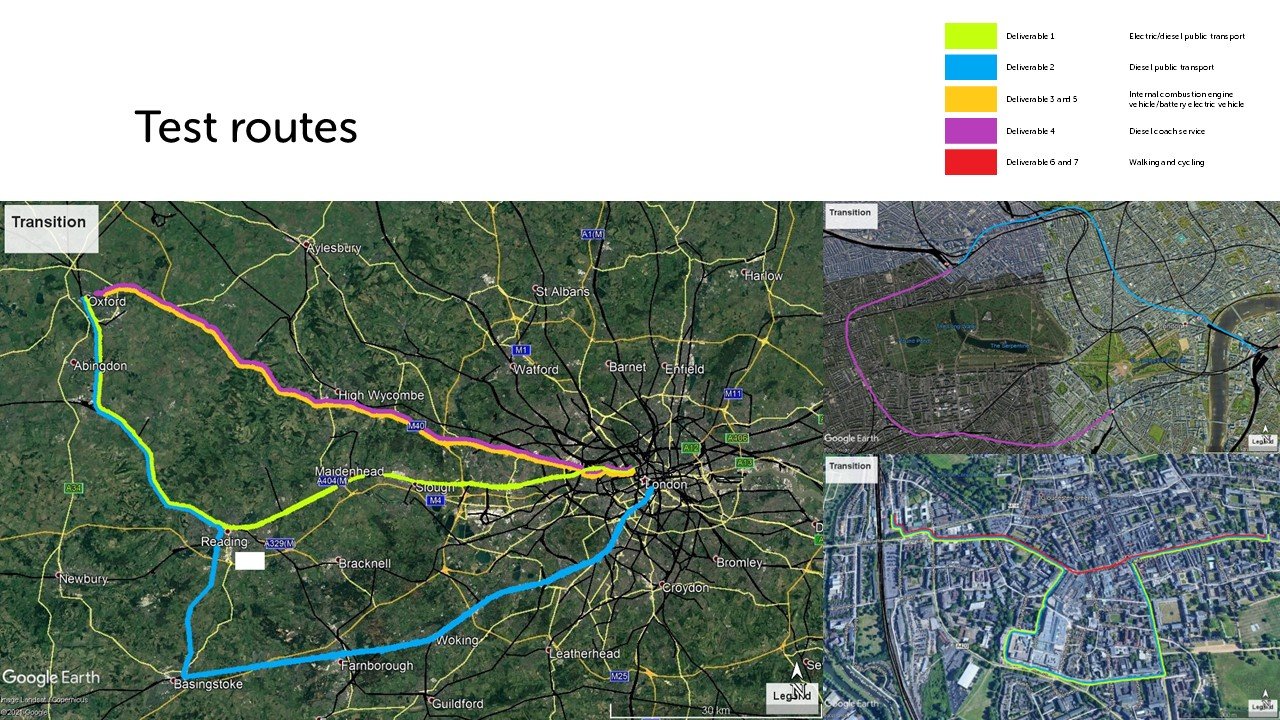
To study this, we tested a range of transport modes between central London and Oxford city centre, a distance of approximately 50 miles (80 km) as the crow flies. This project was funded by the TRANSITION Clean Air Network through the first round of its Discovery & Innovation Fund in 2021¹.

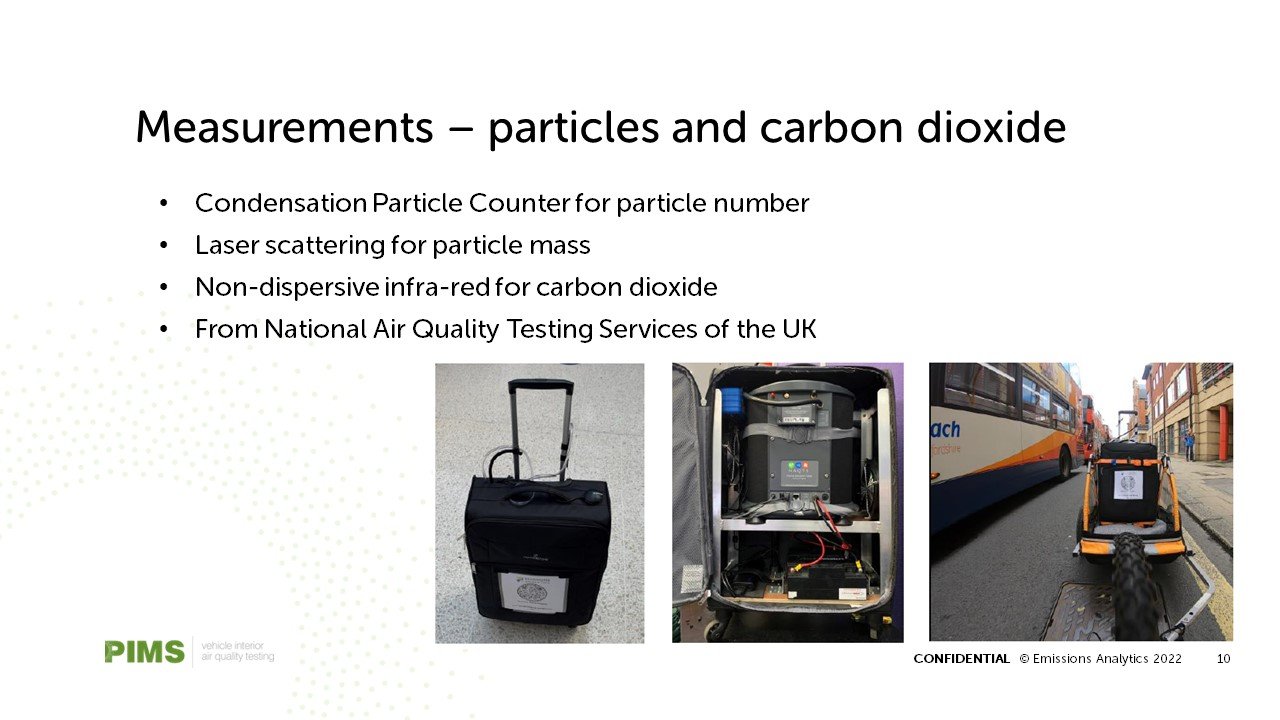
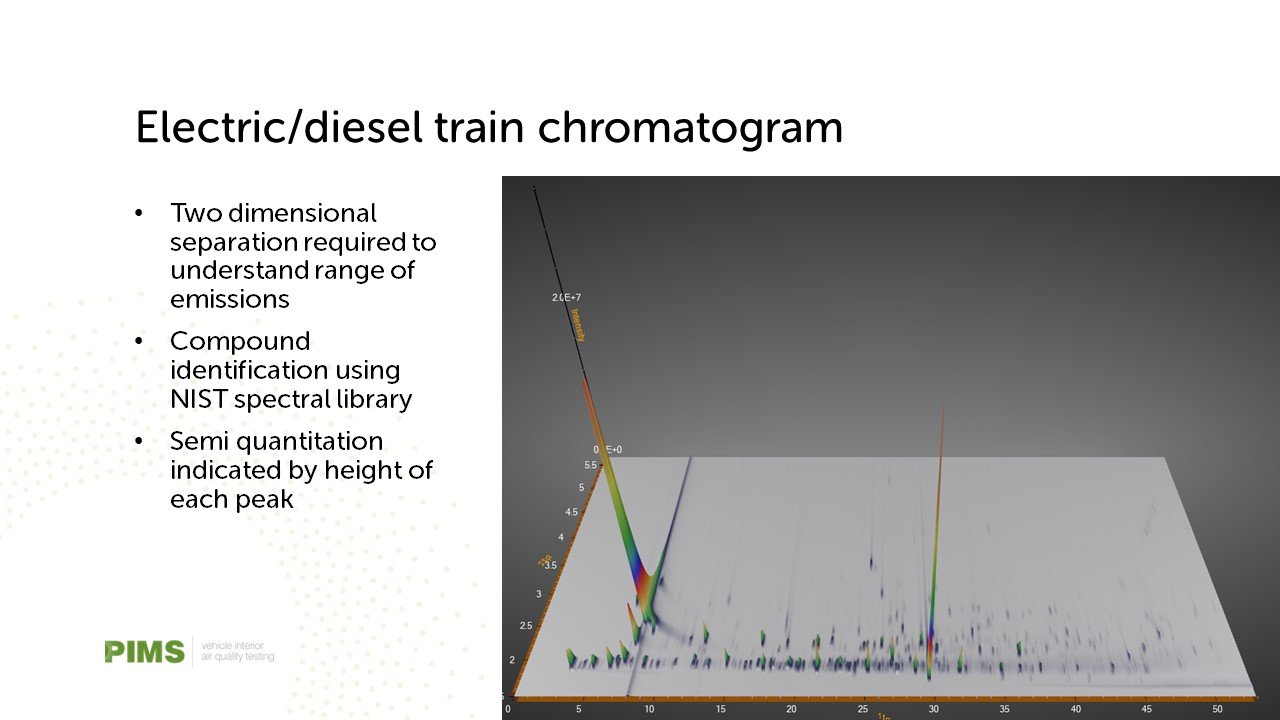
The main pollutants of interest for this study were particles – both mass and number – and volatile organic compounds (VOCs). These are likely to be the most problematic pollutants in confined spaces, and this selection mirrors the work on passenger car interior air quality work at the UNECE and CEN Workshop 103². To measure these, we used the V2000 from National Air Quality Testing Services for particles³. For VOCs, samples were collected in thermal desorption tubes – using both passive and active sampling – and then analysed in a two-dimensional gas chromatography system: GCxGC-TOF-MS from SepSolve Analytical and Markes International. Due to limitations in the study, most journeys were undertaken only once and, therefore, more data would be required to understand variability between exposures on different days.
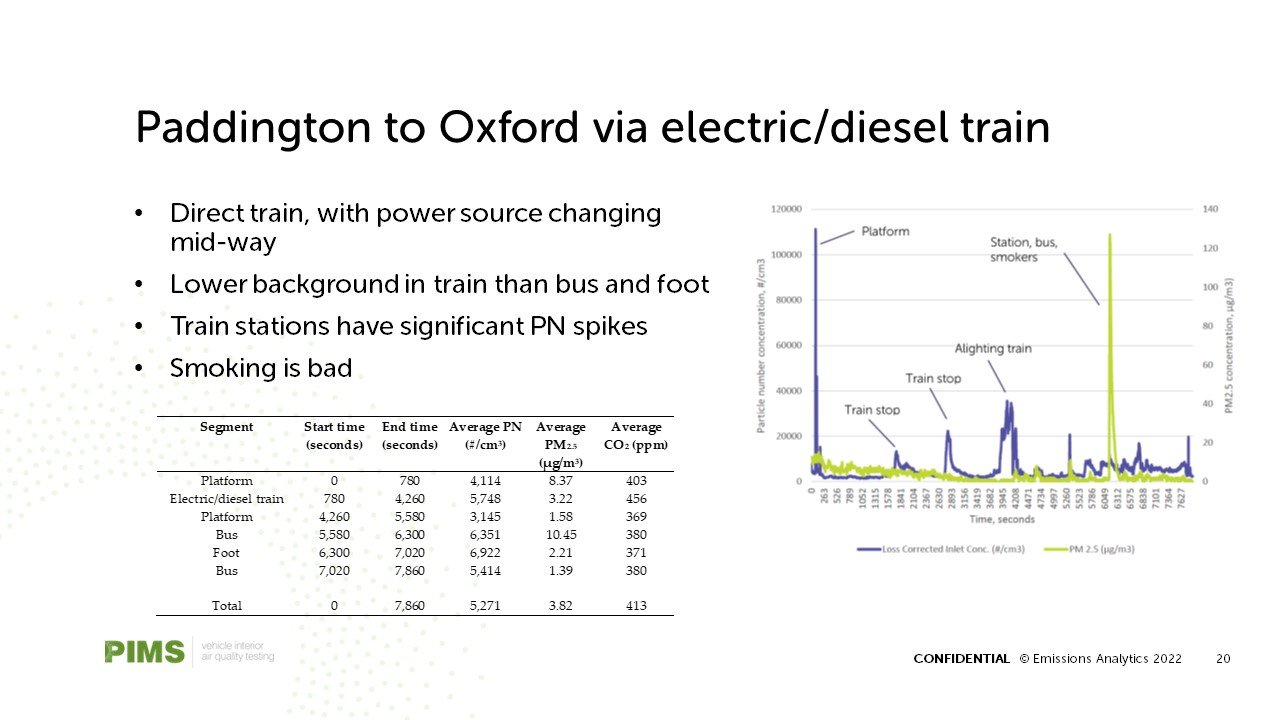
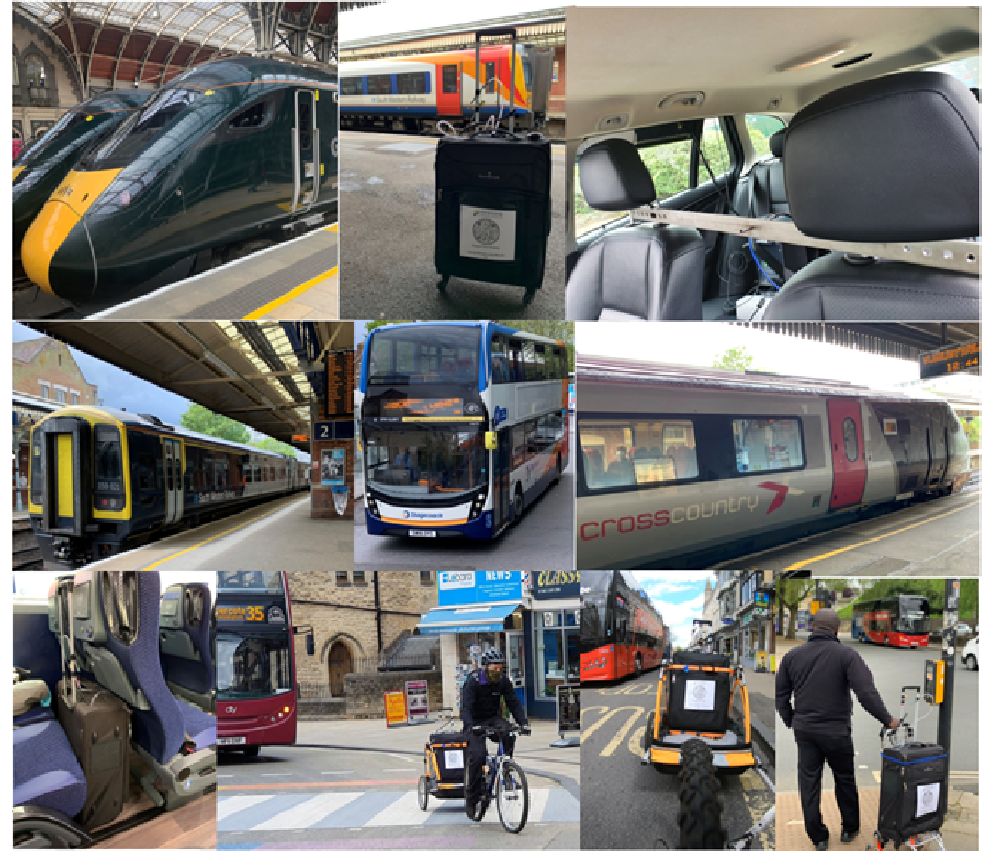
The transport modes tested were the electric train, diesel train, diesel coach, diesel and hybrid bus, battery electric vehicle (BEV), diesel internal combustion engine (ICE) vehicle, bicycle and on foot. Most of these vehicles were relatively modern, as shown in the images above. The car journeys were point-to-point from London Paddington station to Oxford High Street, whereas the others – except bicycle and on foot – were multi-stage journeys, trying to achieve the most direct route. For example, the diesel train was direct between the cities with an added bus journey to Oxford city centre. The least direct route involved the London Underground, an electric train, then a diesel train and a bus.
Before getting into analysis of the vehicles, it is important to say that, generally speaking, active travel by bicycle or on foot led to among the lowest pollutant exposures, even in the city of Oxford, although there was significant variability between journeys. Although the traveller was exposed to spikes in pollutants, especially from other vehicles, the level of dilution with fresh air was high. However, cycling or walking is not a viable substitute mode for the whole journey from London to Oxford.
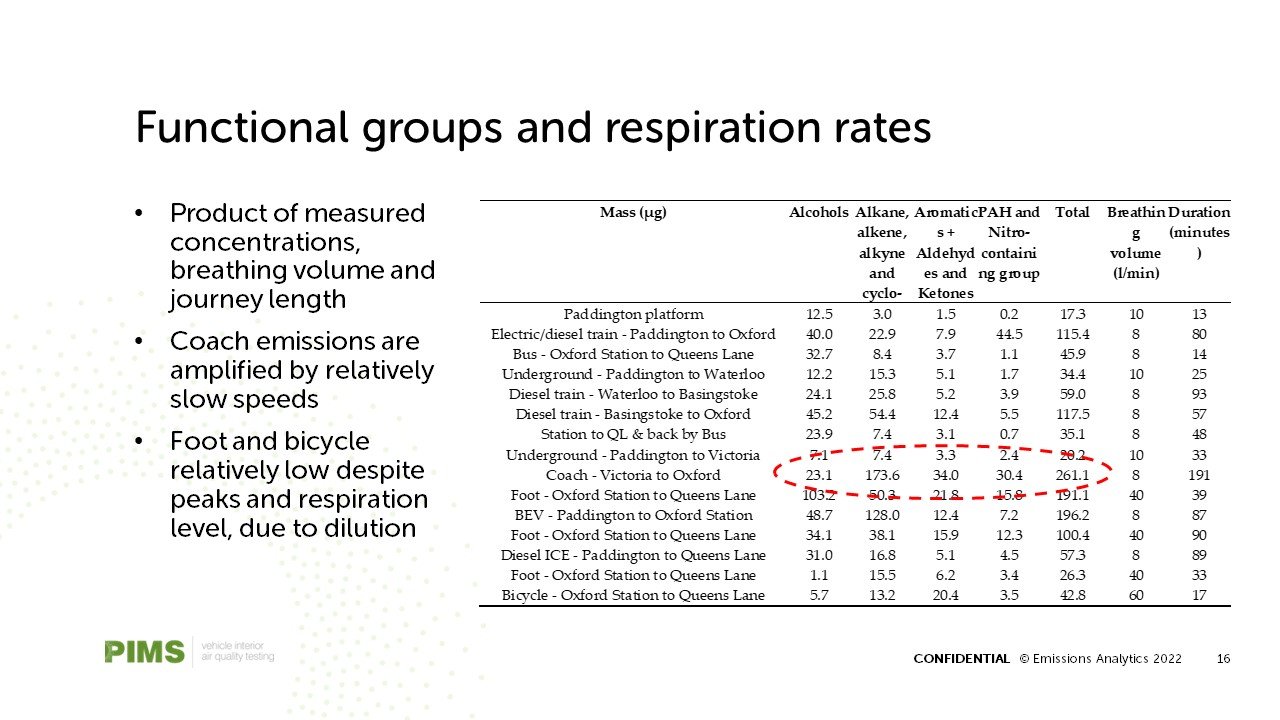
The table below shows the estimated total mass exposure to VOCs, per passenger, split into functional groups, for the different journeys, factoring in the trip duration and volume of air inhaled due to the activity level involved. Simplistically, the VOC functional groups have been presented in increasing order of potential toxicity, from alcohols at the lowest level to polycyclic aromatic hydrocarbons (PAHs) and nitrogen-containing compounds, which are often carcinogenic.
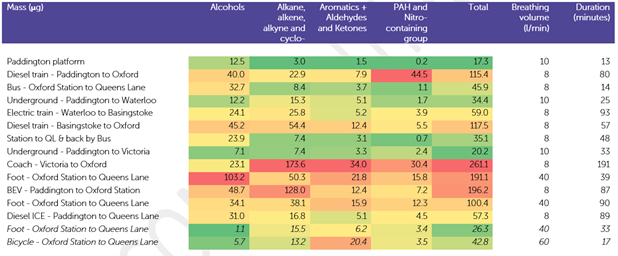
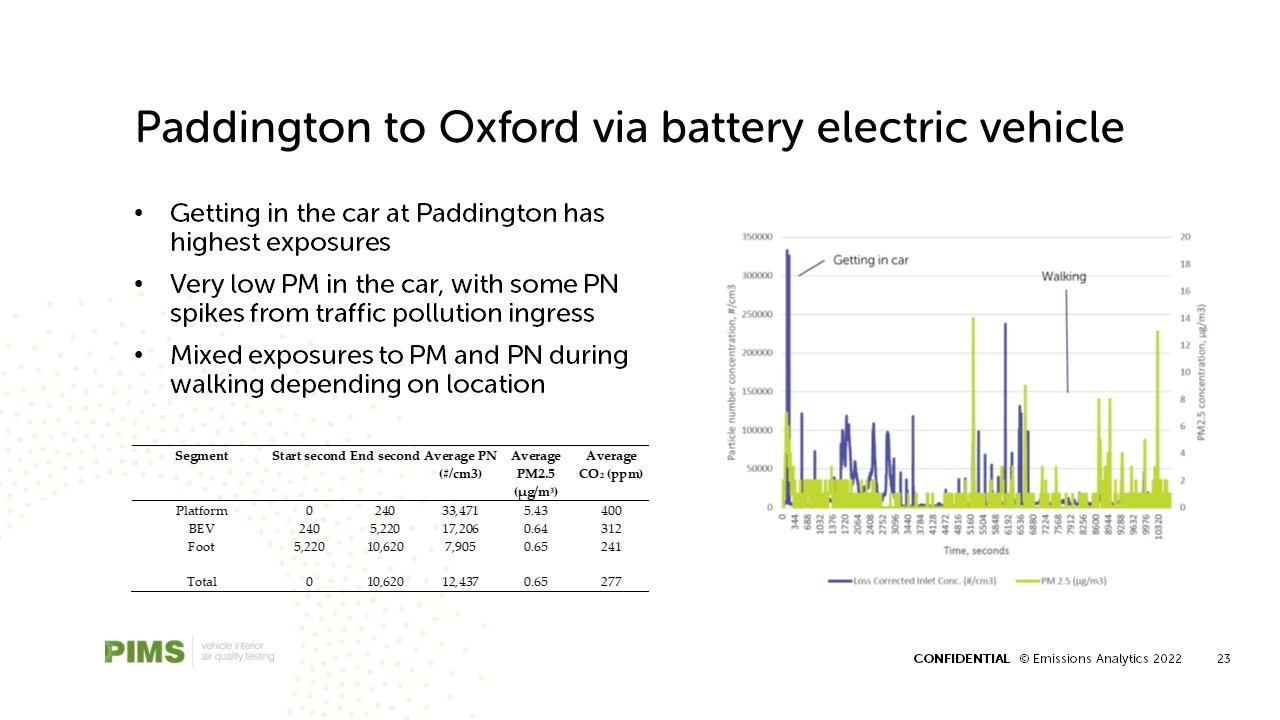
Overall, the coach generated the greatest VOC exposures, particularly in the alkane and aromatic groups. The highest PAH exposures were on the direct diesel train to Oxford. Electrified public transport typically saw low exposures, indeed lower than the BEV passenger car. In fact, the exposures in this brand-new BEV were almost four times higher than the nine-year-old diesel car. This may be due to the BEV being a smaller city car, whereas the diesel was a premium vehicle, which may have had a superior ventilation and filtration system. Furthermore, it is seen more widely that BEVs can have worse in-cabin pollution as energy is not applied sufficiently to the ventilation system in order to maximise range.
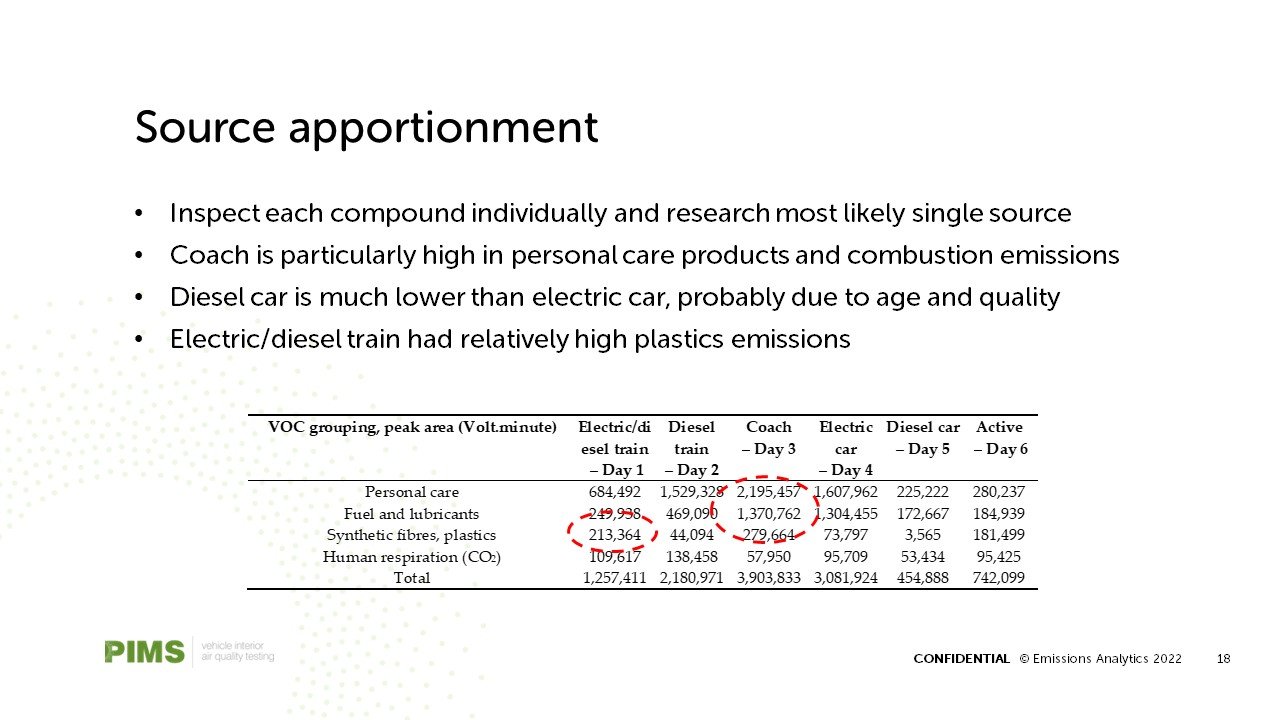
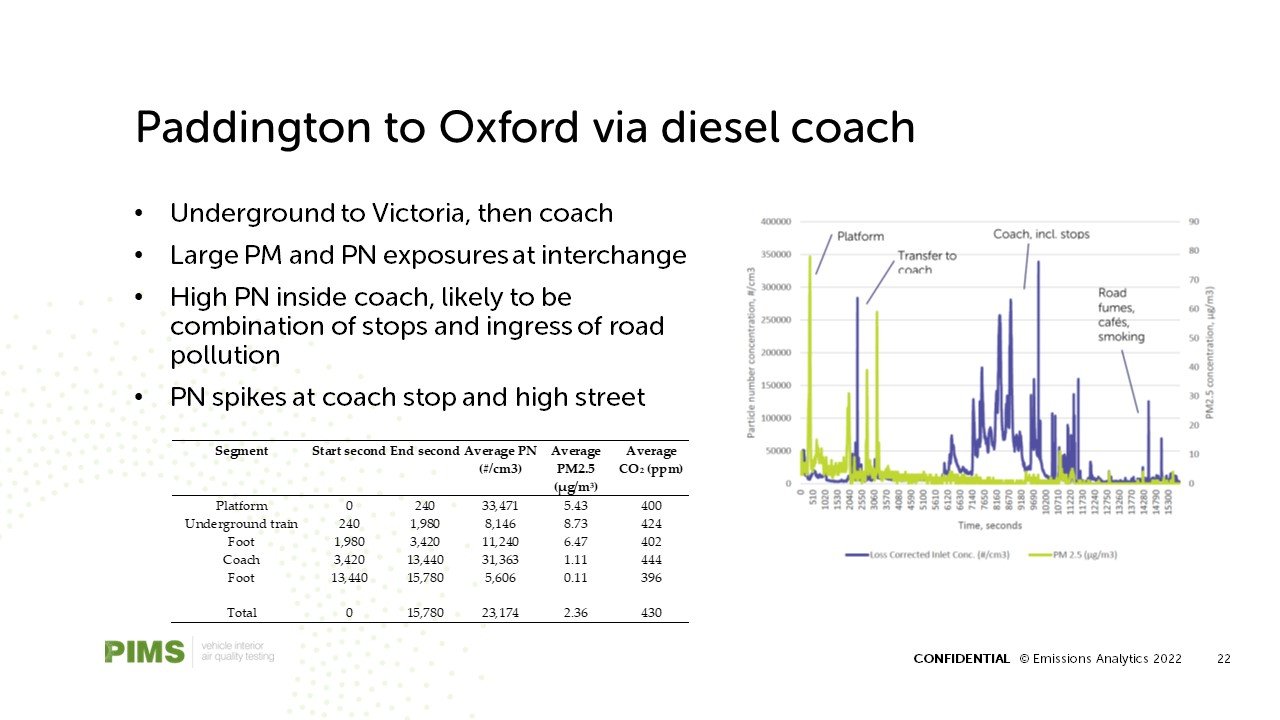
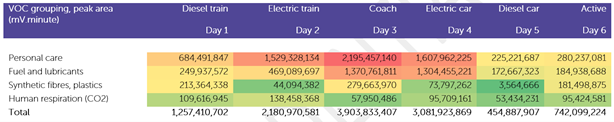
The coach saw the greatest overall exposures, not least because of the journey's long duration, with a significant proportion of the VOCs appearing to originate from personal care products – deodorants, shampoos, perfumes and so on – from other passengers, as shown in the table below. To perform this analysis, each VOC is allocated to a category based on its most likely source, and the unit of measurement reflects the total area under the peaks on the chromatogram. Although these personal care products are likely to be less toxic to humans at the concentrations measured, the coach also had the highest level of fumes from fuels and lubricants, which are likely to have come from other vehicles on the road, but allowed to enter and persist in the coach cabin.
By far the cleanest vehicle, therefore, is the diesel car (a Mercedes-Benz), but the electric car is poor – the prevalence of VOCs from both personal care products and engine fumes in the BEV is consistent with the idea that the ventilation is poor in this budget car (a Vauxhall), and how important a good ventilation system is to balance filtration and air exchange rates in protecting the driver.
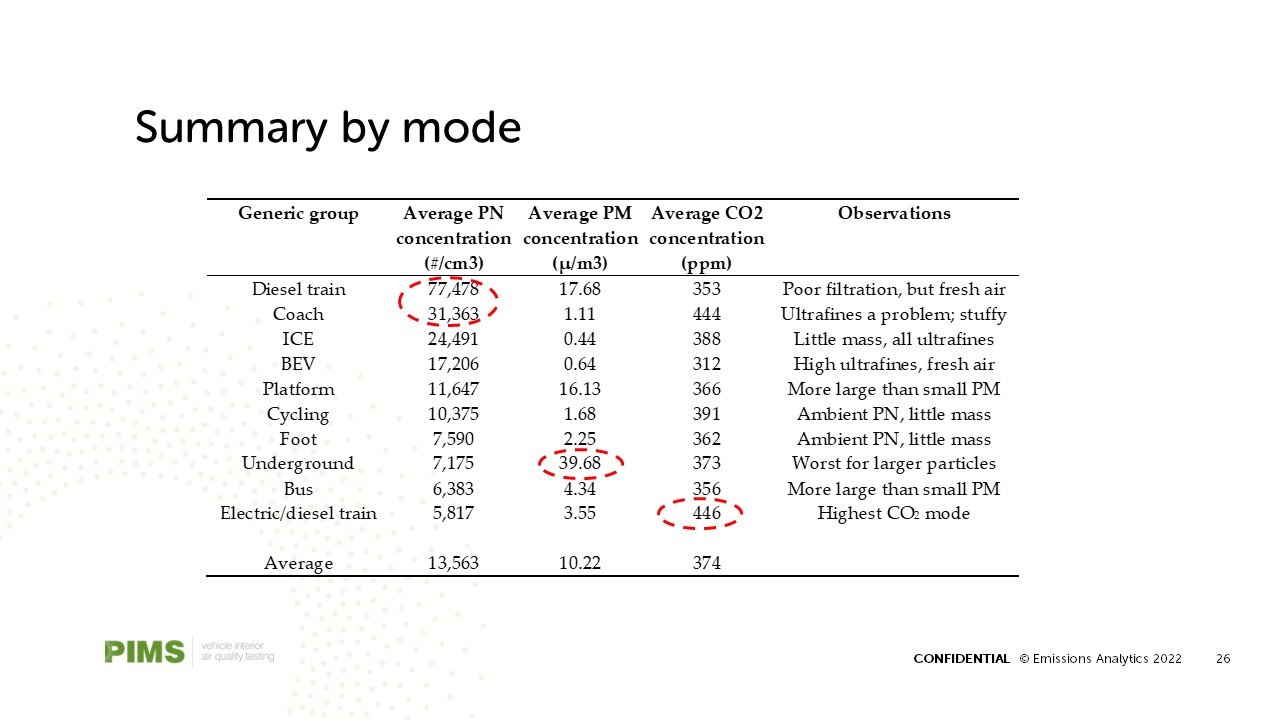
Is there evidence to support this when looking at the particle and CO2 results? The table below shows the average results for particulate number (PN), particulate mass (PM) and CO2. Broadly, the former two are measures of pollutant exposure, whereas CO2 is a proxy for air freshness and rate of air exchange. This immediately reveals the public transport dilemma – packing more people in tends to lead to stuffier air, just as passenger density is the key to greenhouse gas emissions reduction per passenger-mile.
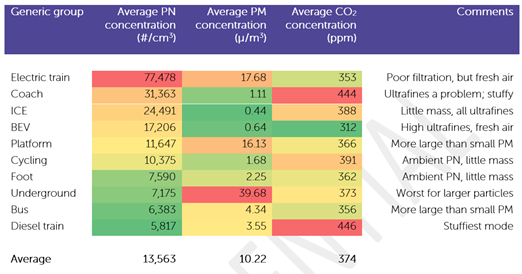
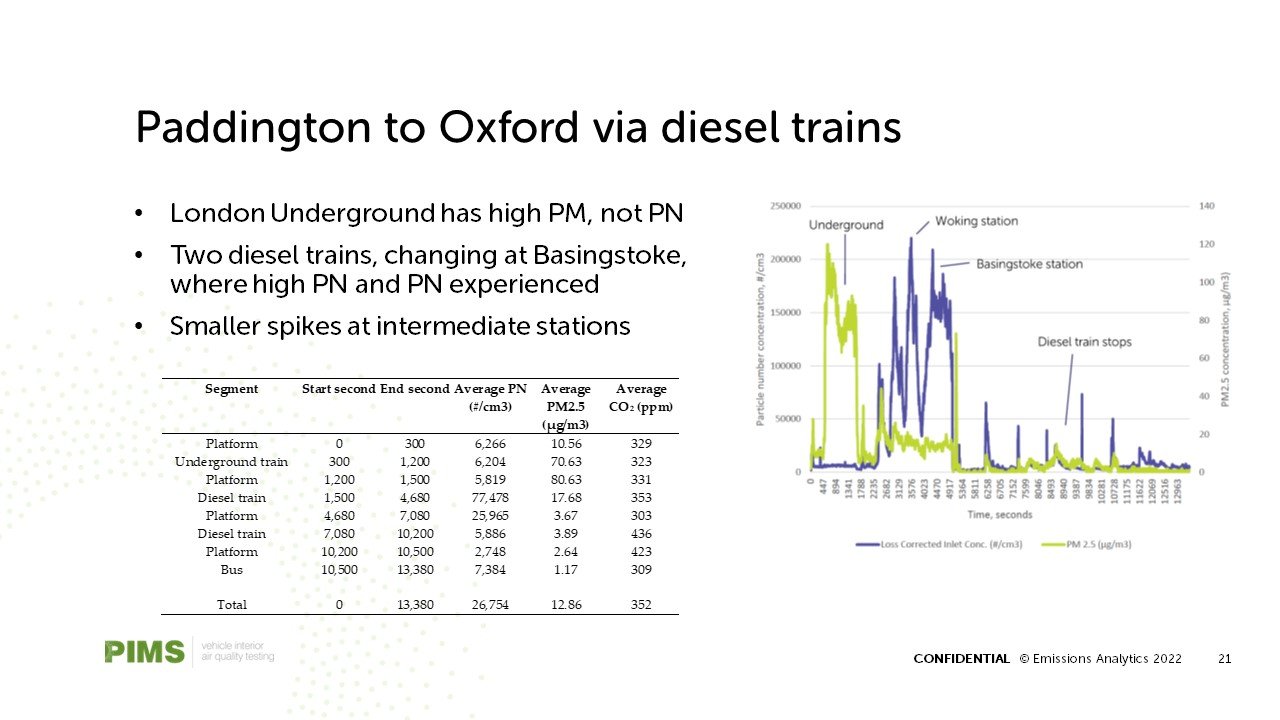
The London Underground journey – an electric train – has by far the highest PM exposures, which is likely to be fluff, metal from the tracks and human detrita. Ultrafine particles, as measured by PN, are relatively low there, in contrast to the electric train from London Waterloo to Basingstoke, which saw high particle levels. For particles, the results were similar between the two types of car, which suggests the issue is more that VOCs are off-gassing from the interior materials on the new BEV, and its ventilation system is not exchanging the air often enough to keep the concentrations down. The least fresh air was found on the coach and diesel train, which werebad not just for VOC exposures, but general comfort.
Thus far in this newsletter, we have described emissions in a vehicle-centric way. However, when the real-time data is considered in more detail, it is clear that a significant proportion of exposures on public transport are not when the vehicle is moving. Rather, the process of waiting for, boarding and alighting the vehicle, together with it letting on other passengers at stops, creates exposure spikes. The time series chart below takes the example of the journey via the Underground, electric train and then diesel train to Oxford.
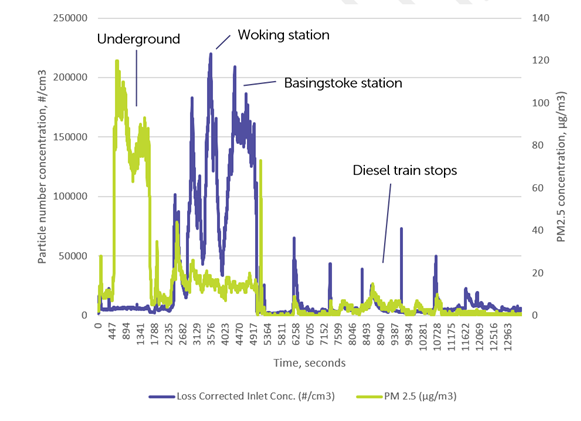
After the fluffiness of the Underground, getting onto the electric train at Waterloo showed a spike in both PM and PN, followed by PN spikes at various stations. The change, with a wait on the platform, onto the diesel train at Basingstoke had a large, persistent elevated level of PN and brief spike of PM. Much of this is due to a cocktail of diesel fumes and cooking smells from food concessions inside the station. The diesel train, once boarded, was cleaner, but with spikes at each station.
In short, public transport is getting squeezed between active travel and the car, both in economics and for health. It is not sufficient just to upgrade public transport vehicles to reduce VOC and particle exposures, but also the whole experience including interchanges, stopping patterns and waiting times. Public transport also needs to resolve the tension between wanting to squeeze as many people in for good economics and environmentals, and maintaining a good level of air freshness and comfort.
References
TRANSITION is a UK-wide network, led by the University of Birmingham in collaboration with nine universities and over 20 cross-sector partners, aiming to optimise the air quality and health outcomes of transport decarbonisation. The network (NERC ref. NE/V002449/1) is itself funded by UK Research & Innovation through its Clean Air Strategic Priorities Fund, administered by the Natural Environment Research Council. Raw data from the testing can be found in Centre for Environmental Data Analysis (CEDA) at https://catalogue.ceda.ac.uk/uuid/96c912c7c0094da2a8627d446cb06708.
Are cars sinful?
This is no polemic for or against the car. Nor about petrolheads. Nor environmentalists. This is about the chemicals that are to be found inside cars, and the importance of good ventilation, to avoid occupants gently steeping in a cocktail not of their own making.
This is no polemic for or against the car. Nor about petrolheads. Nor environmentalists. This is about the chemicals that are to be found inside cars, and the importance of good ventilation, to avoid occupants gently steeping in a cocktail not of their own making. The SIN is the ‘Substitute It Now!’¹ list developed by the International Chemical Secretariat, a largely government funded organisation in Sweden² – a list of over one thousand chemicals with harmful health or environmental effects, which they suggest should be removed from consumer products. But do we find any of these in modern cars?

This is not a new problem, but one the significance of which we are only beginning to understand. As discussed in previous newsletters, the emissions from vehicle exhausts have improved significantly over the last ten years. Initially it was mainly seen as particulate reduction, as the widespread cheating on nitrogen oxide (NOx) emissions – of which Dieselgate was emblematic – was only resolved from around 2018 when official laboratory results were validated with an on-road test called Real Driving Emissions. The remaining pollutants of most concern in the exhaust are carbon dioxide (CO2) and a range of volatile and semi-volatile organic compounds (VOCs and SVOCs).
At the same time, the construction of vehicles has become more sophisticated. While generally to the benefit of consumers in terms of utility and design, the potential impact on the health and comfort of vehicle occupants has not been fully considered. The increased use of glues in vehicle manufacture and superior construction methods creating an almost perfectly sealed cabin come with downsides. Significant hurdles in understanding the consequences have been difficulties in measuring the compounds of interest, and the lack of standards to measure vehicle interior air quality (VIAQ). This is beginning to change, led by South Korea and Japan, which collectively regulate nine different VOCs in the cabin.
Emissions Analytics has been working on this from both angles. It has been an active participant in a standardisation workshop under the Comité Européen de Normalisation (CEN)³, aiming at measuring the air quality inside light-duty vehicles in terms of particle ingress from outside and CO2 build-up. In parallel, it has been developing methods for measuring the presence of VOCs and SVOCs in cabin air, and how they might be emitted from the interior materials. The two areas are linked because the worse the ventilation and filtration system, the greater the likelihood of the accumulation of noxious organic compounds. Multiply that by the length of time typically spent in vehicles and the human exposures could be greater than to ambient air pollution.
To get a measure of the problem, if we chemically analyse the interiors of cars, do we find any of the compounds on the SIN List? We took a small sample of recent model year vehicles in Europe and analysed a range of interior materials, including dashboard plastic, seat material and carpets. Each sample was analysed using two-dimensional gas chromatography coupled with time-of-flight mass spectrometry, with sample introduction via microchamber – a system provided by Markes International and SepSolve Analytical.
One vehicle in particular gave interesting results: a top-selling, European-made small car from 2020. We tested the carpet in the boot and footwell, dashboard plastic and the seat covering material. Across these sample locations, 16 of the SIN List compounds were identified, as shown in the table below. The metric is the percentage of the peak area – in other words, the area under the compound’s peak on the chromatogram expressed as a proportion of the total peak area of all organic compounds identified. It is a reasonable approximation of the relative abundance of the SIN List compounds in each sample.

While just 1.23% of the organic compounds found in the dashboard plastic were on the SIN List, this exceeded 11% for the footwell carpet. Furthermore, its most prominent compound was diethyl phthalate. Generally, phthalates are a synthetic substance commonly used to make plastics more flexible. A growing body of research suggests that many of the compounds in this group have undesirable health effects, including reducing fertility. As a result, regulations are beginning to restrict their use, for example, under REACH in the EU, the concentration of four target phthalates cannot together exceed 0.1% by weight in consumer goods. Diethyl phthalate is not one of these four, and the research on its health effects is currently limited, but its high concentration in the footwell carpet should warrant additional focus.
Beyond phthalates, a way to assess the health dangers of the other compounds on the SIN List is to look at the ‘hazard statements’ produced under the Globally Harmonized System of Classification and Labelling of Chemicals (GHS), an international consensus system developed by the United Nations for classifying and labelling hazardous chemicals. Hazard statements provide standardised wording as to the nature and degree of the threats. For example, ‘H350’ indicates a chemical that may cause cancer. An individual compound can have multiple hazard designations.
If each of the compounds identified in the vehicle are scored according to the number of hazard designations, and these are then grouped generically, we obtain the totals shown in the table below. Included in this assessment are those assessed as ‘persistent bioaccumulative toxic’ compounds, which is a separate hazard category. These compounds do not break down easily in the environment or living creatures and so progressively build up.

At a high level, it can be seen the most prevalent health effects are irritation or damage to the skin, eyes, throat and lungs. The boot carpet has the largest number of designations, and contains a relatively high level of octamethylcyclotetrasiloxane, which is suspected of damaging fertility. The harms are not just to humans, for example naphthalene is also highly toxic to fish and other aquatic life.
The number and extent of these compounds present in common materials in vehicle interiors points to action needed by manufacturers to address the potential toxicity to occupants. Beyond the SIN List, we have also identified a ‘PFAS’ in the same vehicle’s seat material.
Per- and polyfluoroalkyl substances (PFASs) are manmade organofluorine compounds, first created in the mid twentieth century and which became popular for their water repellent, stain resistant and non-stick features. The problem is that they do not break down readily in the environment, hence being described as “forever chemicals”, or persistent organic pollutants. This bioaccumulation means that it is believed that they are gradually building up inside most living creates as well as the wider environment.
The health effects of PFASs were brought to wide public attention for the first time in the 2019 film Dark Waters, where compounds based on perfluorooctanoic acid (PFOA), a subset of PFASs, were released from an industrial source in West Virginia, USA. The evidence as to the environmental effects has continued to accumulate. An article in December 2021 in Environmental Science & Technology shows that these persistent compounds do not simply get washed into the sea and diluted into insignificance. Rather, waves crashing on the shore recirculate the chemicals into the air and onto land⁴. This increases the human exposure and associated health effects, which include cancer, thyroid conditions and colitis.
The compound identified was 1H‚1H‚2H‚2H-perfluorooctan-1-ol – chemical formula C8H5F13O – a chain of eight carbon atoms with 13 fluorine atoms attached. The chromatogram from the seat sample below shows this compound. Of the total peak area of organic compounds, it accounted for 0.61%. The hazard classification says that it may cause damage to organs through prolonged or repeated exposure.
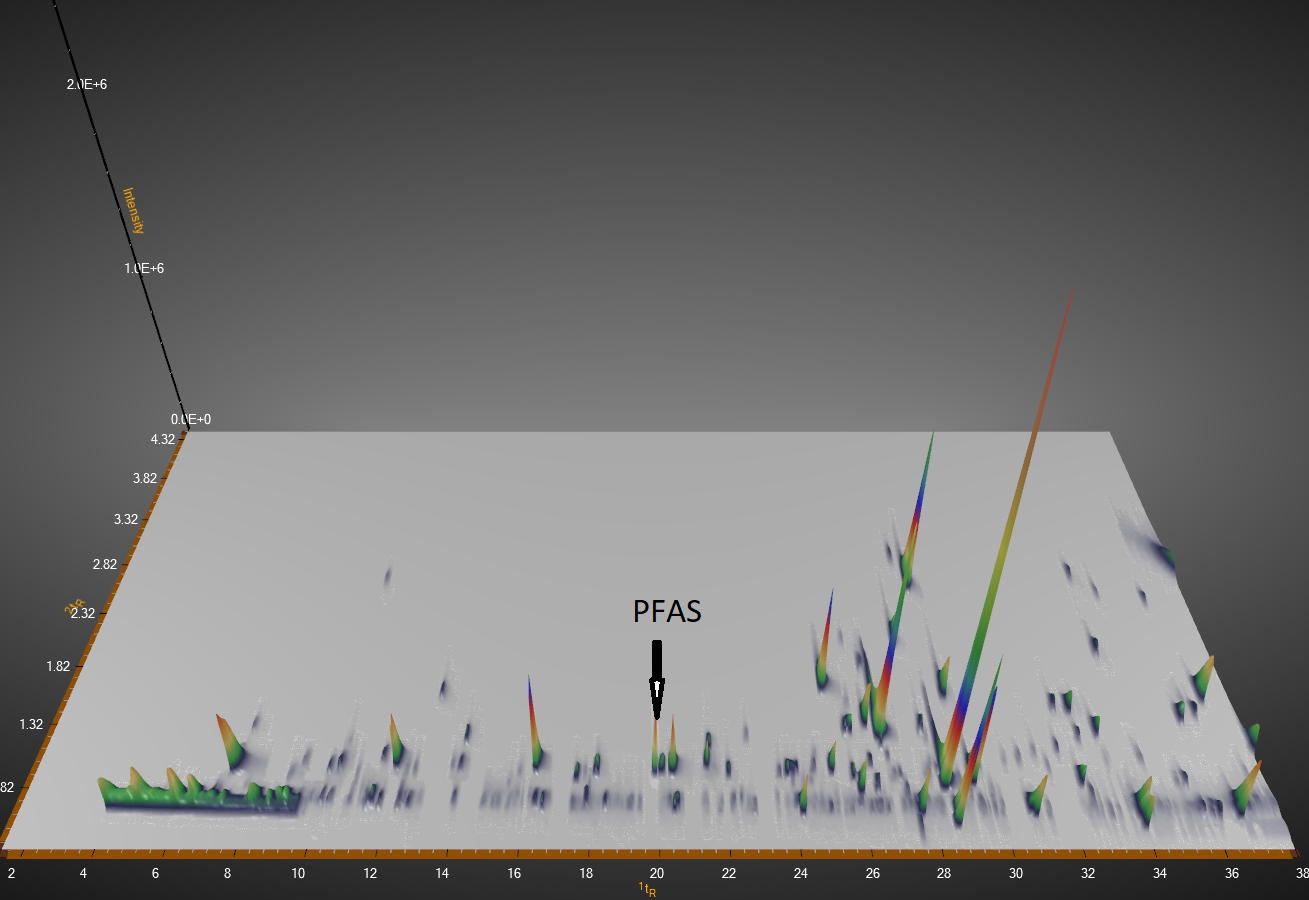
It should be added that it is not being claimed that exposure to this seat covering will have direct health effects. Nevertheless, by the persistent nature of these compounds, they are very likely eventually to end up in the environment, be recirculated and potentially inhaled or ingested by humans or animals. PFASs from a car seat add to this gradual and irreversible accumulation.
In the longer-term, the objective should be to engineer these compounds out of vehicles, where there are viable alternative components. Growing regulations around materials, from REACH in Europe and from the Environmental Protection Agency in the US, together with emerging regulation of vehicle interior air quality led by Korea, Japan, Russia and China, will force the pace. But how should vehicle owners mitigate the effects in the shorter run?

The concentration of VOCs in cabin air generally increases as the vehicle heats up. A car parked in the sun will see more chemicals released from the interior materials into the air, recondensing once the vehicle cools back down. To this chemical soup is added particles and NOx that enter the car through the ventilation system as the vehicle moves, plus the CO2 exhaled by the occupants.
Although not the most glamorous part of a car, a good heating, ventilation and air conditioning system is the best way to limit exposure. The benefits of maintaining fresh air in confined spaces has been brought to prominence through the Covid pandemic. The ideal is to keep the ventilation on fresh air mode – rather than recirculation – but this relies upon excellent filtration to minimise the particle and NOx ingress. In balancing this trade-off, the best vehicles are many times better than the worst, as described in previous newsletters. Therefore, rating vehicles in a fair and comparable way is urgently needed.
Fortunately, both the car and filtration industries have been actively involved in standardisation of test methods, including through CEN Workshop 103, initiated by the AIR Alliance⁵, which is due to publish its work soon. Together with the work on vehicle interior air quality through UNECE, it is quite possible to see how these new tools in measurement and evaluation can bring about healthier, and perhaps SIN-free, cars for both the occupants and the wider world.
Video: Euro 7 and beyond
Our CEO & Founder, Nick Molden conducted a webinar on Euro 7 and beyond. Watch the replay here.
Our CEO & Founder, Nick Molden conducted a webinar on Euro 7 and beyond.
In this presentation, Nick discusses:
Trends in air quality
Policy context of Euro 7 and US regulation
Principles of the EQUA Index test method
New pollutants being measured: N2O, formaldehyde and speciated VOCs and SVOCs
How real-world data collection is conducted
Initial test results
How EQUA Index database can be used for performance benchmarking.
From performance to experience
Could vehicle interior air quality become the differentiator of the future?
Cars used to be about speed, power, performance and freedom. Different models often used to offer dramatically different performance and looks.
Could vehicle interior air quality become the differentiator of the future?
Cars used to be about speed, power, performance and freedom. Different models often used to offer dramatically different performance and looks. But, not so any more. We are currently in an era of the generic sports utility vehicle (SUV) and identikit low emission vehicles. Electric vehicles “all look alike”, as suggested by the head of BMW recently¹.
But can this last? Will consumers want to buy such seemingly bland offerings, and can manufacturers profit from the undifferentiated? Perhaps we are already beginning to see early signs of a shift. Electrification may turn out to be less about emissions reduction, but rather emblematic of the change in the fundamental proposition of the car away from performance and towards experience. Performance is increasingly constrained through traffic and emissions policy, so consumers may want to make the increasingly dull experience of driving at least more comfortable.
Historically, operating a car delivered ample private benefit and enjoyment, at the expense of an alarming array of environment and health impacts: climate effects through carbon dioxide (CO²) emissions; air quality from tailpipe nitrogen oxides (NOx), particulates and carbon monoxide (CO); air and marine pollution from tyre and brake wear; ozone formation from evaporation of volatile organic compounds (VOCs) from fuel in the tank and construction materials; and noise and many others.
Battery electric vehicles (BEVs) are perceived to be the antidote to this: quiet and pollution free. This is of course not quite true: BEVs create CO² emissions in their manufacture, some noise and perhaps higher tyre wear emissions. Nevertheless, we could get to the point where the environment affects the BEV driver more than the BEV affects the environment.
How could this be true? Road transport collectively is only a minority contributor to air quality problems in 2019 – perhaps only 12% of particles² and 33% for NOx³. The majority of pollution comes from domestic heating, industrial sources and agriculture. This polluted air can enter the vehicle cabin through its ventilation system, exposing the driver to the resulting health risks and discomfort. Therefore, it may well become increasingly the case that the car driver is more a victim of pollution than the cause.

Even without BEVs, there are already some aspects of the internal combustion engine (ICE) which foreshadow this trend. First, due to the efficacy of exhaust after-treatment systems, the levels of CO and NOx are so low in real-world operation that the impact on the environment is negligible. For example, under the latest European Real Driving Emissions (RDE) regulation, the average real-world emissions are 157mg/km from gasoline vehicles and 36mg/km from diesels for CO; and 9mg/km from gasolines and 45mg/km from diesels for NOx. Second, as demonstrated previously by Emissions Analytics, diesel particulate filters (DPFs) are so efficient that there are often fewer particles coming out of the tailpipe than there are in the air of a polluted city such as London⁴.
With this background, consider the scenario where the powertrain element ceases to be a major differentiator between mainstream BEVs. Power may be limited to maximise range, torque could be capped to reduce tyre wear emissions, and tyres may become skinnier to reduce rolling resistance but at the cost of handling. As and when connected and autonomous vehicles hit the road, this pattern may become even more pronounced. Furthermore, the cost of electricity – as low as three cents per kilometre – could mean the operating costs become almost irrelevant. Mainstream cars cease to have a performance dimension. Add to this the relatively few standardised manufacturing platforms and you have vehicles of increasingly similar performance. In this world, how will manufacturers differentiate their products and make decent profits?
Design undoubtedly will remain a key element, both for aesthetics, build quality and cost. Beyond that, with the background of historical air pollution problems and now Covid-19, it may well become the vehicle interior air quality that becomes a major differentiator. What once were major sources of pollution, could now become protective automotive bubbles.
Tesla’s launch of its ‘Bioweapon Defense Mode’ in 2016 was perhaps early evidence of this trend. The data presented by the company for its efficacy involved exposing a vehicle to high levels of particle pollution in an emissions chamber and showed that concentrations of particles by mass⁵ in the vehicle cabin fell from 1,000ug/m3 to undetectably low levels within two minutes, from which they concluded it could protect the vehicle occupant from biological attack⁶.
Grand claims need verifying, especially as to whether laboratory test results carry over into real-world conditions, so Emissions Analytics tested this model on a 2019 Tesla X in the UK. The test followed the protocol set out in an SAE paper published in 2019⁷.
The Tesla X is now equipped with a High-Efficiency Particulate Air (HEPA) filter as standard. In simple terms, the ventilation system has the typical ‘fresh air’ and ‘recirculation’ modes, but also the bioweapon mode too. This HEPA filter is enormous, as shown in the picture below – the installation requiring most of the width of the ‘frunk’. It is approximately 100cm long, 30cm tall and 3cm deep – a volume of over 9,000cm³. This compares to filter volumes on typical mass market cars of 1,000-2,000cm³.

The filter may be large, but it certainly works. In our test, interior concentrations were 94% lower than externally on fresh air mode, and 92% lower on the bioweapon mode during an on-road test – statistically indistinguishable from one another. This is the best performing vehicle we have tested so far. The principal difference between Tesla’s test and ours was that we measured ultrafine particles down to 15nm rather than particle mass. Together, the data suggests excellent protection from both bigger and smaller particles.
To put these results in context, Emissions Analytics tested 97 recent model year light-duty vehicles in the US in partnership with Edmunds⁸. Of all these, the best performing was a 2019 Honda Civic, which reduced particle concentration by 73%. Emphasising the significant differences, the worst performing vehicle was a 2019 Lexus ES, for which particles inside the vehicle were 254% higher than outside. Of the 97 vehicles, 44 had higher concentrations inside than out. This is an unregulated area at the moment, so there is no compliance issue, but there certainly is a potential health issue from chronic particle exposure.
A common driver strategy for protection from exterior pollution – often initiated when the driver senses a malodour – is to engage the recirculation mode on the ventilation system, which wholly or largely circulates, with varying degrees of filtration, existing interior air. This is effective in protecting from pollution ingress from outside, but has the side-effect of allowing CO² to build up in the cabin from the respiration of occupants. Although research is scarce in driving situations, the effects of elevated CO² on cognition have been shown, which leads to the reasonable belief that above 1,000ppm – compared to a background of just over 400ppm – there may be effects on driver safety as well as comfort⁹.
Returning to the Tesla, on fresh air mode, CO² increased by just 8%, while on recirculation the increase was 97%. Impressively, the bioweapon mode saw just a 17% increase. The average increase across the 97-vehicle test on recirculation mode was 15% on fresh air and 79% on recirculation.
From this, it is clear that there is a trade-off between protecting the vehicle occupant from particle ingress into the vehicle on fresh air mode and CO² build-up if recirculation is engaged. While this holds true at the level of the individual vehicle, it is not true at the market level. In other words, there are some models that are good at both, and some bad at both. The chart below plots each of the 97 models tested, plus the Tesla X, for particle infiltration on fresh air mode against CO² build-up on recirculation.

For particle number, the values are the ratio between concentrations in the interior and exterior air, so a value of one means they are the same on average. For CO², a value of zero means there is no increase in interior concentrations compared to the baseline. On this latter measure the Subaru Impreza showed the worst performance, in contrast with the best from the Chevrolet Suburban – as indicated on the chart.
In short, there is a wide diversity of results and no obvious pattern, whether it be by manufacturer, vehicle size or powertrain. The most conspicuous activity currently is from premium manufacturers, whose buyers perhaps have the greatest awareness or appreciation of clear cabin air. Beyond that, there appears to be little understanding of the issue in the absence of any useful consumer information.
To help address this, Emissions Analytics is actively involved in a group aiming to standardise the measurement methodology for in-cabin pollution¹⁰. The group was initiated by the AIR Alliance, which already publishes ratings for tailpipe pollution¹¹. Along with Emissions Analytics, the group includes a number of vehicle manufacturers, academics, and filter and ventilation suppliers. Once completed, recognised and repeatable testing should enable ratings to be published that will both inform car buyers and, indirectly, incentivise manufacturers to improve interior air quality.

The Covid-19 pandemic brings these issues to the fore, as the virus is a particle of approximately 100nm in size. While ingress of live virus particles from outside into the vehicle is unlikely, reducing the chance of one infected occupant transmitting the virus to another is more relevant. Therefore, the rate at which air is recirculated and re-filtered matters. In this context many initiatives have appeared from vehicle manufacturers, suppliers and after-market companies. One example has been trailed by Jaguar Land Rover, using hydroxyl radicals to ‘purify’ cabin air¹². While this may be true in terms of neutralising a coronavirus, surplus hydroxyl radicals can also react to form toxic secondary oxygenated gases and aerosols¹³, and so it is vital to perform a broader, perhaps untargeted, assessment of the effects of such systems. Systems should be compared to the efficiency of filter-based systems such as on the Tesla X, to judge what value the hydroxyl radicals are adding – a judgement that will be allowed once there is a standardised method through CEN Workshop 103.
Thus, perhaps the future market for vehicles will be one of the quality of the experience rather than the magnitude of the performance. BEV range anxiety may be quelled and the charge-up infrastructure made omnipresent. Cheap, renewable energy will make efficiency almost irrelevant. The gradual strangulation of the road space for cars, combined with connectively between vehicles and automation thereof, may leave occupants stripped of the joy of the driving experience, but consequently more demanding in terms of the quality and healthiness of the experience. And this differentiation in experience, comfort, quality and design may be the route to profitability for manufacturers.
Footnotes:
https://www.emissionsanalytics.com/news/2020/1/28/tyres-not-tailpipe
PM2.5, i.e. all particles up to a diameter of 2.5μm
https://www.tesla.com/en_GB/blog/putting-tesla-hepa-filter-and-bioweapon-defense-mode-to-the-test
DPham, L., Molden, N., Boyle, S., Johnson, K. et al., “Development of a Standard Testing Method for Vehicle Cabin Air Quality Index,” SAE Int. J. Commer. Veh. 12(2):2019, doi:10.4271/02-12-02-0012

Video: The Situation with Air Quality in Europe
Following our successful We have forty million reasons for failure, but not a single excuse newsletter, our Founder & CEO, Nick Molden delves deeper into the situation with air quality in Europe.
Following our successful We have forty million reasons for failure, but not a single excuse newsletter, our Founder & CEO, Nick Molden delves deeper into the situation with air quality in Europe.

We have forty million reasons for failure, but not a single excuse
Rudyard Kipling’s description of Great Britain’s painful experience in the Boer War could easily have been written for Europe’s troubled recent experience in vehicle emissions control, air quality and associated public health.
Rudyard Kipling’s description of Great Britain’s painful experience in the Boer War could easily have been written for Europe’s troubled recent experience in vehicle emissions control, air quality and associated public health.
The forty million reasons are the forty million diesels still circulating on the roads of the UK and Europe, emitting more than treble the regulatory limit for nitrogen oxides (NOx) in real-world operation1. Of these, an estimated eight million are Euro 6 diesels. None of these are restricted from a single city in Europe, or taxed in a penal way. In Germany, rather than legislating to clean them up, the government has legislated to prevent them being targeted2. The original source of the problem – the European Union regulatory framework – has been directed not at cleaning up this lasting problem, but only at new cars. NOx emissions from this latest generation of vehicles – certified under the Real Driving Emissions (RDE) regulation – account for just 1% of the total, which leaves the 99% coming from previously sold vehicles. The centrally directed, improved, regulation has hardly touched the problem.

Unless these older vehicles are cleaned up, poor air quality will persist. With the average lifespan of a vehicle in Europe being 14 years, and high-emitting vehicles having been sold through to at least 2018, the problem is not about to disappear automatically through fleet turnover. A particularly egregious example is the Mercedes Citan 1.5-litre diesel van from 2019, which emitted 902mg/km of NOx in real-world driving – 8.6 times the regulatory limit – and which may remain on the road long after the UK’s 2030 ban on new internal combustion engines.
Nevertheless, it is not every single pre-RDE vehicle that is problematic. Contrast the Citan with the 2.0-litre Volkswagen Crafter from the same year, which emitted 53mg/km or 58% below the limit, to see that not all vehicles need restricting to address air quality today. Just over a third – 36% – of all vehicles on the UK roads, for example, create an estimated 87% of all NOx emissions, according to our modelling. A third of all emissions are accounted for by the 12% of dirtiest vehicles. In principle, the most efficient, fairest and least distorting way to bring air quality into compliance is to target those vehicles first.
Rather than focusing on making cleaner vehicles even cleaner, Emissions Analytics has been involved in a project for the last three years to test and rate all vehicles currently on the road, to get to the truly dirty vehicles. The project has been led by the AIR Alliance, and has brought together many parties in the spirit of co-operation. Emphasising the important, urgent and persistent nature of the problem was the landmark legal ruling in the UK in 2020 that the death of Ella Kissi-Debrah can be partially attributed to road pollution4.
Contrary to reports, the arrival of battery electric vehicles has not cured urban air quality problems. Perhaps they will, but market penetration of these vehicles will probably not be high enough until the next decade to make a measurable difference. In the meantime, legal contraventions of air quality standards will continue and can only realistically be addressed by cleaning up the existing fleet of internal combustion engines. Add to this the Covid-19 effect, which has seen a robustness in the used car market5 and early evidence of a switch away from public transport. As a result, older, high-emitting diesel vehicles could become more valuable and be kept on the road longer than expected.
Emissions Analytics is one partner of many in the AIR Alliance. Its first act was to bring together top experts and academics, including Dr Norbert Ligterink from TNO in the Netherlands, Professor Helen ApSimon from Imperial College London, Dan Carder from West Virginia University Institute of Technology in the US – who was responsible for uncovering Dieselgate – and Dr Xavier Querol from IDAEA-CSIC in Spain. The group is chaired by Dr Marc Stettler from Imperial College London.
In contrast to many one-off or time-limited initiatives researching this area, Emissions Analytics and AIR Alliance decided to create an on-going programme of testing and rating vehicles. Furthermore, they wanted to create a legal basis for independently rating urban NOx emissions. This was achieved through the publication of a standardised method – CWA17379 – as the result of almost eighteen months work through the Comité Européen de Normalisation (CEN) together with the automotive industry, cities, academics and lobby groups. From this, the AIR Index (www.airindex.com) was born.

How is all this different from the regulations? It is a voluntary movement bringing together a wide range of parties from different points of view interested in genuinely solving the urban air quality problem. Where the rules of multinational organisations have failed, on-the-ground co-operation has created a real-world ratings system with a legal basis.
With the standardised method coined, data was gathered from multiple sources. All data was subjected to strict quality criteria and tested against dynamic boundary conditions – including the speed and acceleration of driving – to test for validity under the method. Data flowed not just from Emissions Analytics, but from authorities and even manufacturers themselves. Results fully compliant with this method are live and free to access on the AIR Index website. In total, well over a thousand models have been tested and four thousand hours of data collected, to the value of over $16 million.
Despite all this data, the challenge with any system that is not by government fiat is achieving coverage of the whole vehicle parc. It is easy to test a representative sample of vehicles, but not to cover the long tail of models. The AIR Index has not achieved that yet, but is now close. In fact, ratings are already being published for 34,575 model variants.
With such a large repository of data, it has been possible to model and predict the emissions of vehicles similar to those already tested. Using machine learning techniques it is possible to predict with an impressive degree of accuracy the missing results. The model is trained on all the PEMS data drawn from the multiple sources. The validation set is then the fully compliant CWA17379 results, which are of course excluded from the training set. Using this approach, the average error between compliant and modelled values for distance-specific NOx is just 2.6%3. As a result, a large majority of predicted ratings can be validated through blind testing to deliver the correct AIR Index rating on its ‘A’ to ‘E’ scale. For clarity, fully compliant tests and modelled results are always clearly labelled and disclosed as such. If manufacturers, or others, disagree with their predicted ratings, conducting a full test to CWA17379 would lead to the result over-riding the predicted value.
By combining the fully compliant and predicted ratings, it has been possible to create coverage of at least 90% of Euro 5 and Euro 6 models, as shown broken down by powertrain in the table below. These figures include all manufacturers except very low volume niche producers.

Further testing planned may move total coverage to 95% soon.
The result of this work is that there is now a parallel system to the official, centrally directed, certification system that can be adopted by cities across Europe. As a result, cities now have a live, practical tool that can be put immediately to the task of managing the existing fleet to bring NO2 concentrations into compliance.
Analysing the results, we can identify the greatest sources of NOx emissions on UK roads, segmented by Euro stage and AIR Index, as shown in the table below.

Therefore, there is a group of Euro 5 vehicles, with an ‘E’ rating on the AIR Index, that accounts for a third of total emissions, while only representing 12% of vehicles on the road. London’s Ultra Low Emission Zone (ULEZ) has been relatively successful because it has applied an access charge for Euro 5 diesels and earlier, but this is not the most efficient solution as some clean cars are restricted. Were the ULEZ to be based on restricting only vehicles with ‘D’ and ‘E’ ratings on the AIR Index, NOx could be reduced by a further 6% points, while charging 2% fewer cars.
The group of pre-RDE Euro 6 diesels with ‘D’ or ‘E’ AIR Index ratings is smaller than the Euro 5 group, but still important at 9% of total emissions. What is even more significant about these vehicles is that they form the ‘swing group’ that can make the difference between air quality non-compliance and compliance.

In a research report from January 2020 from Imperial College London6, the AIR Index emissions values were combined with standard dispersion models to show the impact of different ULEZ strategies on ambient NO2 concentrations and the number of legal excedances. If the current strategy were applied to the enlarged ULEZ it was shown to bring most but not all locations into compliance with the 40μg/m3 limit, compared to a majority being non-compliant prior to the ULEZ. Switching to ULEZ restrictions based on ‘D’ and ‘E’ on the AIR Index scale, irrespective of Euro stage, was shown to be sufficient to bring all areas into compliance. In other words, the pre-RDE Euro 6 diesels make the difference.
Emissions Analytics is pleased to be involved in this practical, decentralised, collaborative, ground-up attempt to resolve one important element of air quality. On-going testing will move the project closer to complete coverage, and it is set up to welcome an increasing number of data partners. As the supply of data increases, so the accuracy of the database improves.
The only element missing is an honest reckoning by the authorities as to the systemic weaknesses that led to these problems. Without that, the weaknesses may resurface. For the sake of Ella, heed perhaps should be taken of Kipling:
Let us admit it fairly, as a business people should,
We have had no end of a lesson: it will do us no end of good.
Footnotes:
Transport & Environment, Cars with engines: can they ever be clean?, September 2018
Efficient control of NOx from diesel cars and ULEZ reduction of NO2 concentration, ApSimon, H., Oxley, T., Mehlig, D., Woodward, H., Stettler, M., Molden, N.

Side effects may include...
Beware the secondary effects of decarbonisation
Beware the secondary effects of decarbonisation
No vehicle yet designed generates zero emissions. Despite much variation geographically, and much argument, battery electric vehicles probably, on average, halve lifecycle carbon dioxide (CO2) emissions when considering first-round effects such as manufacturing and operation. But are the advantages as clear if secondary effects – the side effects – of electrification are considered?

In a previous newsletter, we set out our Eight Principles of Decarbonisation required to meet a real net-zero target, as shown below. By "real net-zero" we mean actually net-zero in a similar way to the "absolute zero" set down in UK FIRES by Allwood et al in 2019.
Vehicle manufacturers are performing increasingly sophisticated lifecycle analyses of their products. However, most do not consider the secondary, or knock-on, consequences of these electrified vehicles. This is our Sixth Principle of Decarbonisation.

These side effects may include the knock-on consequences on energy infrastructure, vehicle design, driver behaviour and traffic patterns. Most immediately, electric vehicles are likely to increase demand on the electricity grid. To meet net-zero, this additional demand will need to be fulfilled with zero-carbon electricity. Cleaning existing electricity will not be sufficient. For any net-zero scenario it is a pre-requisite that the whole future grid is clean, but we will not look at this further here as it is outside the scope of this newsletter despite being foundational to any meaningful solution.
The most frequent concern with battery electric vehicles (BEVs) is that the additional weight compared to equivalent internal combustion engines (ICEs) leads to higher non-exhaust emissions, which may equal or exceed the eliminated exhaust emissions. These non-exhaust emissions from the vehicle come from its brakes and tyres. Road abrasion and resuspension are often included in non-exhaust emissions, but will be set aside here as they do not originate directly from the vehicle.
Emissions Analytics conducted a long-term study on the wear from Continental Contisport 6 tyres on a 2012 Mercedes C-Class driven on the public highway in consistent, normal conditions. For the first 1,200km, with no added payload, the average wear rate was 161mg/km, but over 31,000km the average wear rate fell to 76mg/km. Even this lower value is 15 times higher than the maximum permission exhaust particle mass emissions under current European regulations. Running the same 1,200km test but with 570kg of payload in addition to the driver, the wear rate increased to 194mg/km, an uplift of 21%. In other words, the average uplift was almost 6mg/km for every additional 100kg of payload. For example, on this basis the Jaguar I-Pace would emit 16% more tyre particle wear than the nearest equivalent Jaguar F-Pace, due to the 443kg additional overall weight.
As a reference, the maximum exhaust particle mass emissions permitted in the EU since 2009 is 5mg/km1. Often, real-world emissions on vehicles with a particle filter are well below 1mg/km. Therefore, for every 100kg of extra payload, the added tyre wear emissions may be as much as the maximum allowed out of the tailpipe in total, and more like five times more than the tailpipe emissions in practice.
However, this analysis may overstate the increase. The extensive regenerative braking of the BEV may well reduce brake emissions and the calibration of the electric motors may smooth driving dynamics to reduce tyre wear. On the other hand, ICEs are increasingly incorporating regenerative braking using 48V systems, and the higher torque of the BEVs (27% in the case of the Jaguars) may encourage more aggressive driving. While data is too limited to draw firm conclusions on these mitigating factors, the underlying upwards pressure on tyre wear remains.
Vehicle weight is clearly a crucial factor in vehicle performance and profitability. The Chinese-built Tesla 3 contains a lithium-iron phosphate (LFP) battery, whereas the US-built versions have the nickel-manganese-cobalt (NMC) version. For similar range, the LFP battery is 200kg heavier, but cheaper in construction. That additional 200kg leads to approximately 8% extra energy to propel the vehicle due to increased inertia and rolling resistance of a typical on-road driving cycle. This leads to greater CO2 emissions in the electricity generation, distribution and usage. At the same time, that extra weight may cause 12mg/km of tyre wear, other things being equal. These downsides could be offset by material light-weighting, power and torque limitations and advanced tyre materials – but all come at either added cost or reduced driver utility.

Switching to inside the vehicle, the preoccupation with maximising the range of electrified vehicles – to be competitive with ICEs – may lead to worse vehicle interior air quality. Incoming air to the vehicle’s ventilation system is usually filtered to remove first-and-foremost particles, but this process consumes energy due to the back pressure created by the filter. While this may be insignificant proportionately on an energy-consumptive ICE, it can be material on more efficient vehicles.
Emissions Analytics conducted a test programme across 97 recent model year cars in the US market and found that many hybrids had relatively poor filtration. Tests were conducted on a standardised urban route around Los Angeles. Real-time particle number concentrations, with a lower size cut-off of 15nm, were measured simultaneously inside and outside of the vehicle and the integrated values ratioed over the test. Condensing Particle Counters from National Air Quality Testing Services (NAQTS)2 were used. The testing followed the methodology set down in a Society of Automotive Engineers (SAE) paper authored by Emissions Analytics and the University of California Riverside3.
Not all electrified vehicles performed poorly, but the majority did. The average cabin air quality index from hybrids was 55% worse than the other vehicles in the group, and the particle ingress on the worst was 3.6 times higher than the average of standard vehicles. In contrast, the Jaguar I-Pace BEV was one of the best performers. Although not part of this testing, Tesla’s ‘biohazard’ high efficient particulate air (HEPA) filter, which is now standard on the Models S and X, has excellent reported particle ingress performance, although it will still come at the cost of increased energy consumption.
To quantify this energy consumption, we can look at the mechanics of the ventilation system. A typical vehicle heating, ventilation and air conditioning system consumes from around 140W to 1.4kW depending on the setting4. The lower value is an approximation of the power requirement of the fan and the energy required to overcome the back pressure from the filter. At an average speed of 40km/h, the energy consumption would be between 0.28kWh and 2.8kWh per 100km driven. A typical BEV would consume 25kWh per 100km, so the ventilation system may add between 1.1% and 11% to overall energy consumption. For this reason, there is an incentive to reduce the amount of air filtered, the filtration efficiency or air conditioning activity on electrified vehicles, which would lead to higher particle exposures – and the resulting adverse health effects – of the occupants.
Thinking more widely at the transportation system level, a problem that may start to emerge is added congestion, caused by extra vehicle miles from electric vehicles, which then may adversely affect total emissions from the fleet. This would apply during the transition, while BEV penetration remains relatively low.
A BEV costs approximately 5 pence (5.5 Euro cents) per kilometre in energy costs, compared to 12 pence (13.2 cents) for a reasonably frugal ICE5. Other things being equal, this is likely to lead to more and longer journeys, and a switch to cars from other forms of transport: the income and substitution effects. Setting aside the effects on the economics of public transport, the additional traffic volume will lead to greater congestion, other things being equal. As the fleet will remain predominantly powered by ICEs for decades – due to the legacy light-duty fleet and diesel remaining prevalent for heavy-duty vehicles – this added congestion caused by BEVs is likely to cause increased emissions from these legacy ICEs.
Analysing Emissions Analytics’ database of over 2,000 light-duty vehicles, we can quantify the effect of this added congestion. To travel the same distance at the same speed (65km/h), a driving profile with stopping and starting between 30km/h and 90km/h can create higher emissions than steady-state driving. On average, CO2 emissions are 24% higher, NOx emissions 89% higher and particle number emissions 75% higher. For a period, a relatively small number of BEVs may adversely affect the emissions of the majority ICEs, increasing emissions and worsening air quality. This does not mean the push to BEVs is wrong, but the secondary effect in the short- to medium-term must be considered. One mitigation would be to push faster for BEV penetration.
As congestion leads to longer journey times, the rational response would be for some distance-based or road-access pricing. At least, this would need to compensate for the naturally lower marginal costs of operation of BEVs. More widely, there is a strong argument that motoring generally is under-priced. The pollution produced by an ICE is a negative externality not internalised, which leads to over-consumption.

In summary, these are just three of the potential side effects of electrification. This does not mean that electrification is bad, but that these secondary effects must be understood and controlled. With the large amounts of taxpayers’ money being requested to build the electric infrastructure, there should at least be a responsibility that this is well spent and not just the catalyst for swapping one problem for another.
Footnotes:
- Or 4.5mg/km under the PMP protocol
- NAQTS
- Researchgate Publication 333500744 Development of a Standard Testing Method for Vehicle Cabin Air Quality Index
- Impact of the Air-Conditioning System on the Power Consumption of an Electric Vehicle Powered by Lithium-Ion Battery, Modelling and Simulation in Engineering, 2013
- Assuming 2.5 miles per kWh and 12.5 pence per kWh for the BEV; 45mpg (6.3l/100km) and £1.20 per litre (€1.33) for the ICE

Emissions Analytics Wins Environmental Excellence in Transportation Award
Emissions Analytics has been awarded SAE International's Environmental Excellence in Transportation Award for developing a Cabin Air Quality Index method.

We’re delighted to announce that Emissions Analytics has won an Environmental Excellence in Transportation Award.
In honour of Earth Day, SAE International announced the winners of its Environmental Excellence in Transportation Award. This award showcases the work of individuals and teams who through their ingenuity and dedication have made significant innovations in reducing the environmental impact caused by the transportation industry.
Emissions Analytics was successful in the New Methods and Tools category for the Development of Fractional Cabin Air Recirculation System, Standard Testing Method for Vehicle Cabin Air Quality, and Cabin Air Quality Index.
You can read more about the awards here.
You can find our more about our Pollution In-Cabin Measurement System (PIMS) capabilities here.

Emissions Analytics Addresses Oxford Air Quality Meeting
Our Chief Executive, Nick Molden, is speaking at Keble College Oxford this Friday, 10th January 2020, at the Oxford Air Quality Meeting.

Our Chief Executive, Nick Molden, is speaking at Keble College Oxford this Friday, 10th January 2020, at the Oxford Air Quality Meeting.
The event has been established to draw together experts in vehicle emissions, air quality measurement, public health, and policy and features a key note speech from UK clean air champion, Professor Martin Williams of King’s College London.
Speaking at 11.30 am, Nick Molden will look at solving poor air quality quickly and fairly and how the consequences of ‘Dieselgate’ continue to cause market confusion at government, industry and customer levels.
The aim of the event is to facilitate interactions and discussions across a wide range of stake holders in the air quality field. Recent advances in real driving emissions measurement mean that greater understanding of roadside vehicle emissions is being developed. In addition, low cost air quality sensing and an increasing insight into how various pollutants effect humans mean that the evidence base is growing rapidly.
The Oxford Air Quality Meeting will bring together all of these groups, alongside policy makers to enable future improvements in air quality.
Those wishing to attend can register here

The Self-Poisoning Car
What is the capacity of a car interior to emit volatile organic compounds (VOCs) over the life of the vehicle?

Real-time emissions of volatile organic compounds in the cabin
Unlike tailpipe emissions, Vehicle Interior Air Quality (VIAQ) is lightly regulated. In the broad area there are existing ISO and SAE standards, and an active United Nations Economic Commission for Europe (UNECE) working group. Some countries have national standards, in particular Japan, Korea, China and Russia. There are 97 VOCs listed as hazardous air pollutants in Title III of the Clean Air Act Amendments of 1990. Overall, the arc of regulation is at an early stage, covers a limited number of pollutants, and has much lower priority and profile compared to the exhaust pipe post-Dieselgate. Nevertheless, the total health exposure of drivers is significant and under-measured.
VIAQ breaks down into three broad areas. The first concerns ingress of pollution into the cabin, especially particles. The second looks at the build-up of pollutants from human occupants, including carbon dioxide from respiration. The CEN standardisation workshop #103 in Europe1, initiated by the AIR Alliance and building on initial test work by Emissions Analytics, is considering these first two elements. The third area, and the subject of this newsletter is the car interior itself and its capacity to emit volatile organic compounds (VOCs) over the life of the vehicle.

What might be colloquially and informally referred to as ‘new car smell’ has typically been ignored, partly because it has been difficult to measure. Recent advances in instrumentation now allow the measurement of not only total, time-weighted average VOCs, but it can now distinguish between different species of VOCs in real time.
Emissions Analytics and Cambridge, UK-based Anatune have worked together to test this ‘new car smell’. The subject has a particular resonance in Asia. 11.2 per cent of buyers in China complained about the odours they found in their new cars, according to the 2019 JD Power China Initial Quality Study.
Car interiors, comprising dozens of separate materials ranging from natural textiles to synthetic polymers and adhesives, emit a wide range of VOCs, among them acetaldehyde. Symptoms that customers have cited range from sore eyes to nausea and headaches, and aggravated respiratory conditions.
Acetaldehyde is especially problematic, owing to the fact that many Asians possess a less functional acetaldehyde dehydrogenase enzyme, responsible for breaking it down. This regional genetic characteristic is one reason why the strictest regulation of VOCs exists in the key Asian markets China, Japan and Korea, and why manufacturers typically observe these regulations for cars that will be sold globally.
However, acetaldehyde is merely one of dozens of VOCs that a car produces. The sources are typically:
Residual compounds from the manufacturing process and material treatment of different interior components and textiles
Adhesives and carrier solvents that will de-gas – as much as 2kg of adhesive can be found in a modern car, much higher than in the past where mechanical riveting and bolting was more common
Degradation of cabin materials over the longer term as a result of oxidation, ultra-violet light and heat.
The following table sets out the regulated limits in key Asian countries, in micrograms per metre cubed, and the potential human symptoms from exposure.
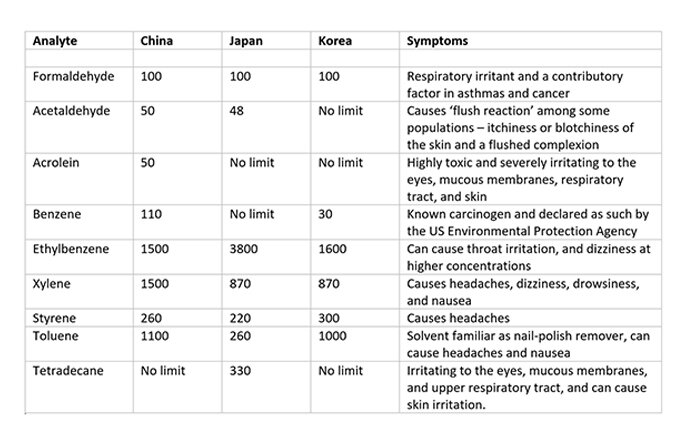
In this testing, not only did we manage to isolate different VOCs, but we quantified their mass using SIFT-MS, a type of direct mass spectrometry that uses precisely controlled soft ionisation to enable real-time, quantitative analysis of VOCs in air, typically at detection limits of parts-per-trillion level by volume (pptv).
Anatune provides chromatography and mass spectrometry-related analytical solutions, in particular the deployment of SIFT-MS, which stands for Selected Ion Flow Tube Mass Spectrometry and is built by the Christ Church, New Zealand-based company Syft Technologies. One of the main advantages over existing instrumentation is that SIFT-MS measures multiple analytes in real time, akin to a rolling video compared to the ‘snap shot’ of traditional chromatography.
As with any technology, there is a trade-off with the more traditional technique of thermal desorption/gas chromatography (TD/GC) analysis, where VOCs are collected on sorbent tubes on an integrated basis. The SIFT-MS approach cannot distinguish every analyte, and the most effective way to operate the instrument requires ‘telling it’ what you are looking for in advance.
In an initial test of a one-year-old gasoline Hyundai i10, Anatune deployed the Syft Technologies’ Voice 200ultra.
The car was tested every 15 minutes for 60 seconds over five hours on an early summer’s day, where temperatures rose to 20 degrees Celsius (68 degrees Fahrenheit). The measured concentrations were expressed as the mean across the 60-second duration of the sample. For the final 15-minute vent cycle, the car windows were opened, the car started and the air conditioning run at full power. The SIFT-MS then sampled continuously using the above conditions for the full 15 minutes.
The two principle outcomes of the test concern the steady accumulations of ten VOCs as temperatures rose; and the unexpected dynamic of emissions during the final fifteen minutes.
Most noticeably, the common solvents methanol and acetone rose from very low base points (18 and 12 micrograms per cubic metre) to 935 and 576 μg/m3 respectively. The 52-fold rise in methanol is noteworthy. While it is a very common solvent and not directly regulated, it is toxic and could be an irritant at these levels.

The only exception to these across-the-board rises was benzene, which fell from 17 to 15 μg/m3. However, this is where the final fifteen minutes revealed unexpected results.
Despite windows being open and the air conditioning turned on, some VOCs such as acetaldehyde rose steeply during the fourth to sixth minutes. During this phase acetaldehyde concentrations rose from an initial base of approximately 50 to 550 μg/m3, more than ten times the regulated limit in China and Japan.

Anatune Senior Application Chemist and SIFT-MS Specialist Dr Mark Perkins hypothesises that the car’s Heating and Ventilation system (HVAC) may form a type of ‘sink’ for some VOCs. When the venting or AC are activated, the sink is flushed out into the cabin causing a pronounced spike. Three other analytes that rose in the same time frame included styrene, toluene and benzene.
From a vehicle testing perspective, the ability to detect and speciate different analytes in real time opens up the possibility for more extensive research of exposure and the potential for regulation to reduce detrimental health exposures. It could also assist driver education in respect of ‘VOC build-up’ when a vehicle is parked in hot weather.
Overall what this shows is that a four-hour, time-weighted average of total VOCs – the basis of existing regulatory testing – could be improved. Future regulations will need to cover individual materials in isolation as well as ‘whole car testing’, by which we mean the actual, real-world way in which the many materials comprising a car interior act dynamically with each other and within the HVAC system.
With so many new entrants into the global car manufacturing sector, and at a time of drivetrain and material changes often connected with light-weighting, there has never been a more critical juncture at which to take seriously chemical emissions that can harm vehicle occupants and are already the source of a high volume of complaints.
Regulations should reflect where there is market failure, in particular where a consumer does not realise or cannot do anything about the health exposure. ‘New car smell’ may be unpleasant to certain consumers, but there is little understanding of the health detriment. Acetaldehyde is one of the better understood VOCs in the cabin so far, which was prominent on the vehicle tested, and which should be considered for early intervention.
1 CEN Workshop 103 held its first meeting on 4 November 2019, chaired by not-for-profit organisation the AIR Alliance, whose co-founder is Emissions Analytics' founder and CEO Nick Molden.
Burning Issue: Tyres And Air Quality
Are tyres replacing tailpipe as the policy priority?
Are tyres replacing tailpipe as the policy priority?
Tyres are rapidly emerging as a new source of environmental concern and this will affect the car industry.
In a recently aired BBC radio documentary, it was claimed that the world will discard 3 billion tyres in 2019, enough to fill a large football stadium 130 times1. Beyond this broad issue of resource use and material waste, tyres also sit uniquely at the intersection of air quality and microplastics.
This newsletter sketches the problem in its current form and considers certain automotive developments in its light.
As a car drives by, you cannot see its tyres wearing and therefore ‘tyre wear’ in this sense remains imperceptible except in deliberately extreme use such as branches of motor sport such as drag racing and drifting.
Yet over a lifetime of between 20-50,000kms, a tyre will shed approximately 10-30% of its tread rubber into the environment, at least 1-2kgs2. The wear factor (defined as the total amount of material lost per kilometre) varies enormously depending on tyre characteristics such as size – radius/width/depth – tread depth, construction, pressure and temperature. In one recent Emissions Analytics’ test, conducted under real-world rather than lab conditions, the four tyres on a standard hatchback lost 1.8kg over just 200 miles of fast road speeds, far in excess of what had been anticipated by the testers.
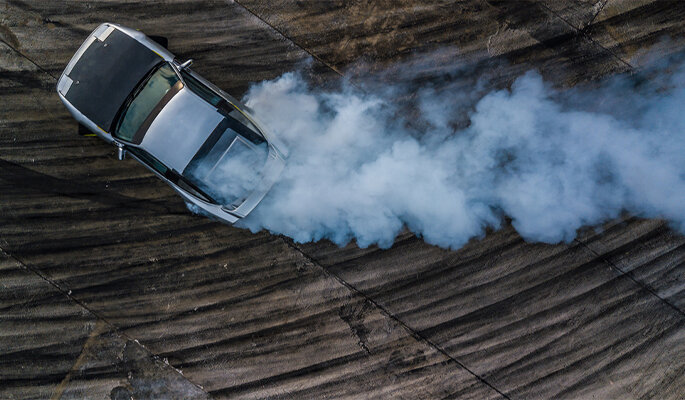
A tyre abraids owing to the friction between its contact patch and the road surface. It ‘emits’ particles across a broad size spectrum, from coarse to fine to ultrafine to nanoscale. It may also emit other forms of aromatics such as benzopyrene and benzofluorene, the result of the incomplete combustion of organic matter resulting in evaporation of the volatile content of the tyres, which the EU has regulated to a degree3.
Coarse particles typically fall rapidly to the ground. At the fine level and smaller, they are airborne for a certain duration, either being blown away from the carriageway before settling on the ground, or falling to the carriageway where re-suspension may take place as other vehicles pass.
Particle dispersion and deposition eventually occurs, but that is not the end of the story. The particles typically pass into the watershed through street drainage and are estimated to be a primary source of as much as 28% of microplastics found in the marine environment4.
The recent re-characterisation of tyre wear emissions as ‘microplastic pollution’ corrects the broadly misleading public idea, out of date a hundred years and counting, that tyres are composed principally of natural rubber. Instead, tyres are a close derivative of crude oil and their wholesale pricing typically tracks it.
A typical car tyre comprises 45% oil-derived synthetic rubber (polymer), 40% oil-derived carbon-black (filler, 40%), and 15% various additives to aid production processes, some of which typically contain heavy metals and some of which are also oil-derived.
Some tyres contain natural rubber, but to all intents and purposes we live in the age of the plastic tyre.

For not unrelated reasons, we also live in the age of the disposable tyre. From being an expensive product derived in large part from natural rubber, tyres have fallen in cost as globalisation has catapulted numerous new entrant tyre-makers into what is today a $240bn a year industry.
If we now turn to the automotive world, tyres are more important than ever to vehicle attractiveness and performance, but for many different reasons:
An emphasis on vehicle and tyre performance is often at the price of tyre longevity, particularly where higher diameter wheel rim sizes are combined with wide tyres, whether to convey power or sportiness
Tyres have become more disposable as their price has fallen in real terms, replacing an older tradition of re-treading carcasses for extended life
New entrant tyre-makers in Asia, South Asia and Eastern Europe have led to the advent of the ‘budget tyre’
Electric vehicles offer instant torque and higher kerb weights, implying higher tyre wear rates, even while regenerative braking is expected to reduce brake wear emissions
Electrification leads to a completely new appraisal of the tyre in respect of durability and noise
In-cabin tyre noise becomes a high-concern consumer issue as drivetrain noise is reduced or eliminated.
From a regulatory viewpoint, tyres in Europe are labelled according to three criteria, (the so-called ‘performance triangle’): rolling resistance, wet grip and noise – but that may change as tyre environmental impact rises up the political agenda.
From our perspective, Emissions Analytics has been conducting in-depth real-world tests on tyres. Two immediate insights can be shared:
Budget tyres wear rapidly and have high emissions
New instrumentation capable of measuring emissions down to the nanoscale shows that at the ultrafine level and smaller, the particle mass becomes far less instructive than the particle number, which is much more significant, and yet current regulations only measure mass
The size distribution has potential implications for the epidemiology (health) concern around very fine particulate matter and how it may affect human health.
In one recent test, Emissions Analytics used a Dekati ELPI+ (Dekati® ELPI®+ Unit standard with 14 size fractions from 6nm up to 10um for PN/PM concentration at 1Hz/10Hz sampling rate) to measure both particle mass and number. The first chart below shows the resulting mass distribution.
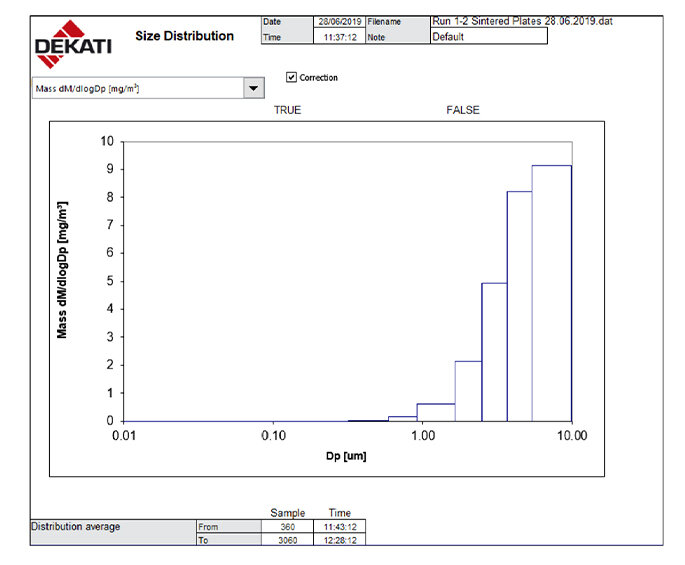
We regard this as a valuable piece of data even though it only corroborates what is broadly known, that a comparatively small number of coarser particles (up to and including the 10 micrometre size shown in the far right column, familiar as PM10) account for most of the recorded mass.
Then consider however the contrast when particle number is accounted for rather than mass: you get a mirror of the first graph, with a tiny amount of mass expressed as a very high number of nanoscale particles right down to the 10-nanometre level expressed in the first column (0.01 micro-metre).
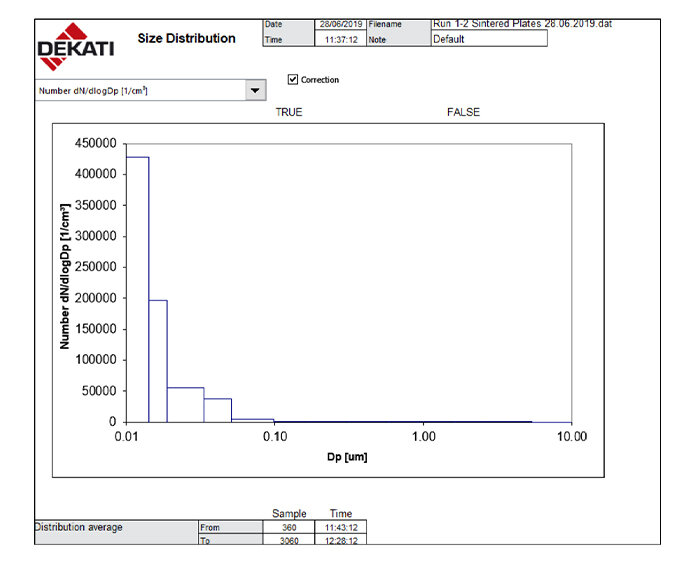
This is a potentially valuable insight because until now this high particle number count has typically either not been measurable or not been measured, owing to a regulatory preoccupation with mass and a lack of suitably sensitive real-time measurement instrumentation.
The ability to count particles down to 10 nanometres relies on the quality of the impactor chosen for this test, which is considered to be the best currently available on a commercial basis.
Regarding public health, there is a tentative emerging consensus among epidemiologists and other medical researchers that ultra-fine particles are potentially more injurious to human health than coarse particles, owing to their ability to translocate to the bloodstream through the lungs5.
Particles will need to continue to be measured both for their mass and their number. In respect of mass they are emitted in a large size range by tyres. In respect of number they emitted in high volumes.
We highlight the UK government’s recent report Non-Exhaust Emissions from Road Traffic, authored by the UK Government’s Air Quality Expert Group (AQEG). It recommends “as an immediate priority that non-exhaust emissions (NEEs) are recognised as a source of ambient concentrations of airborne PM, even for vehicles with zero exhaust emissions of particles.”
Quite apart from the broader point here that so-called ‘zero emission vehicles’ are in fact significant sources of non-exhaust emissions, the quantity of such emissions is set to rise.
The same UK government report notes that non-exhaust emissions are believed to constitute today the majority source of primary particulate matter from road transport, 60% of PM2.5 and 73% of PM10. While regenerative braking is expected to reduce brake wear emissions, the increased weight and torque characteristics of alternative drivetrains such as EVs will likely be associated with increased tyre wear.
In the same report it is suggested that a 10kg increase in vehicle mass accounts for a 0.8-1.8% increase in nanoparticle emissions from tyres. This is particularly relevant as a whole generation of new EVs is hitting the roads with considerably larger and heavier battery packs than in the past.
For small to medium cars, where modest range is acceptable for city use or where the glider (bare chassis) has been deliberately lightweighted to offset batteries (as per the BMW i3), the weight gain may be marginal. Indeed, a switch to narrow tyres may neutralise or even reduce tyre wear.
But a Tesla Model S or Model X, Mercedes EQC, Audi e-tron or Jaguar i-Pace, EVs with larger ranges and battery packs in the range of 60-100 kWh, weigh 2.3-2.6 tonnes. The 600kg battery pack in the Mercedes EQC would on the AQEG/DEFRA model potentially increase nanoparticle emissions from tyres by 48-108%, compared to a conventional vehicle weighing 600kg less.
The same argument can be extended to internal combustion engine vehicles. A heavier vehicle increases tyre wear, whereas lightweighting mitigates it. This has implications for the broader market trend towards SUVs, where often particularly large rim tyre sizes are adopted.
On this basis we think tyres are set to be scrutinised and regulated more, and perhaps also reinvented for electric cars to perform well in durability and noise. There will be opportunities and threats that arise from these changes.
We anticipate the need to place a value on low emission tyres, so that they are desired and consumers are willing to pay for them, in other words using a tax policy that internalises the externality to the benefit both of society and the environment.

1 Costing the Earth: Tread Lightly. BBC Radio 4, March 13th, 2019.
2 Grigoratos & Martini, 2014.
3 Since 2010 the EU has required the discontinuation of the use of extender oils which contain more than 1 mg kg−1 Benzo(a)pyrene, or more than 10 mg kg−1 of the sum of all listed polycyclic aromatic hydrocarbons in the manufacture procedure due to increased health concerns related to PAHs (European Commission, 2005).
4 Microplastics are considered to be all plastic particles in the range of 0.1–5,000 µm. A secondary source is when a larger plastic object breaks down once already in a marine environment. The figure of 28.3% was originally cited in Julien Boucher, Damien Friot, Primary Microplastics in the Oceans: a Global Evaluation of Sources, International Union for Conservation of Nature and Natural Resources, 2017, p21.
5 Newby, David: ‘Air Pollution and Cardiovascular Disease - A Mills and Boon Classic’ (2019).

Mayor delivers online checker to help car buyers choose less polluting new vehicles
Mayor delivers online checker to help car buyers choose less polluting new vehicles. Read the press release here.


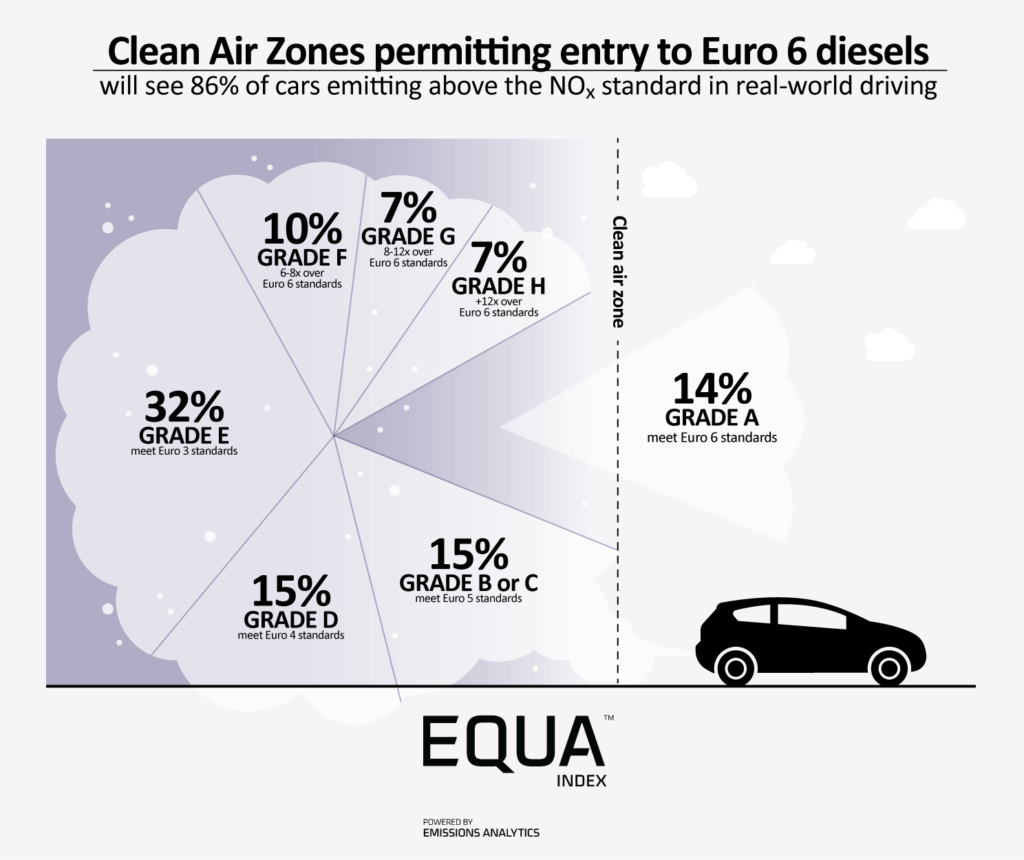
Archive
- AIR Alliance 3
- Air Quality 38
- Audio 3
- Climate Change 14
- EQUA Index 21
- Electrified Vehicles 28
- Euro 7 3
- Fuel Consumption/Economy 20
- Fuels 4
- Infographic 18
- Media 4
- NRMM/Off-road 3
- Newsletter 103
- Podcast 7
- Presentation/Webinar 18
- Press Release 19
- Regulation 16
- Reports 4
- Tailpipe Emissions 49
- Tyre Consortium 2
- Tyre Emissions 26
- Vehicle Interior 6