

Podcast Feature: Building Better with Brandon Bartneck
In the latest episode of Building Better with Brandon Bartneck, Nick Molden and Felix Leach explore the future of sustainable transportation.
In the latest episode of Building Better with Brandon Bartneck, Nick Molden, CEO of Emissions Analytics, and Felix Leach, Associate Professor at the University of Oxford, explore the future of sustainable transportation.
The discussion highlights the pivotal role of two key factors—mass and distance—in determining the environmental impact of transportation. Nick and Felix emphasise the importance of these variables as cornerstones of sustainability.
They also advocate for a transformative reset of public policy and taxation systems, calling for simplified frameworks that align with environmental realities. Exploring the interconnected transportation ecosystem, the influence of consumer choices and actionable steps toward a greener future, this episode offers valuable insights for anyone passionate about sustainability.

Podcast: Emissions Analytics featured in CoMotion Postcast
Nick Molden , CEO and Founder had the privilege of being invited onto CoMotions podcast. On the podcast Nick discusses the question on everyone’s mind how can we quickly and cheaply decarbonize mobility?

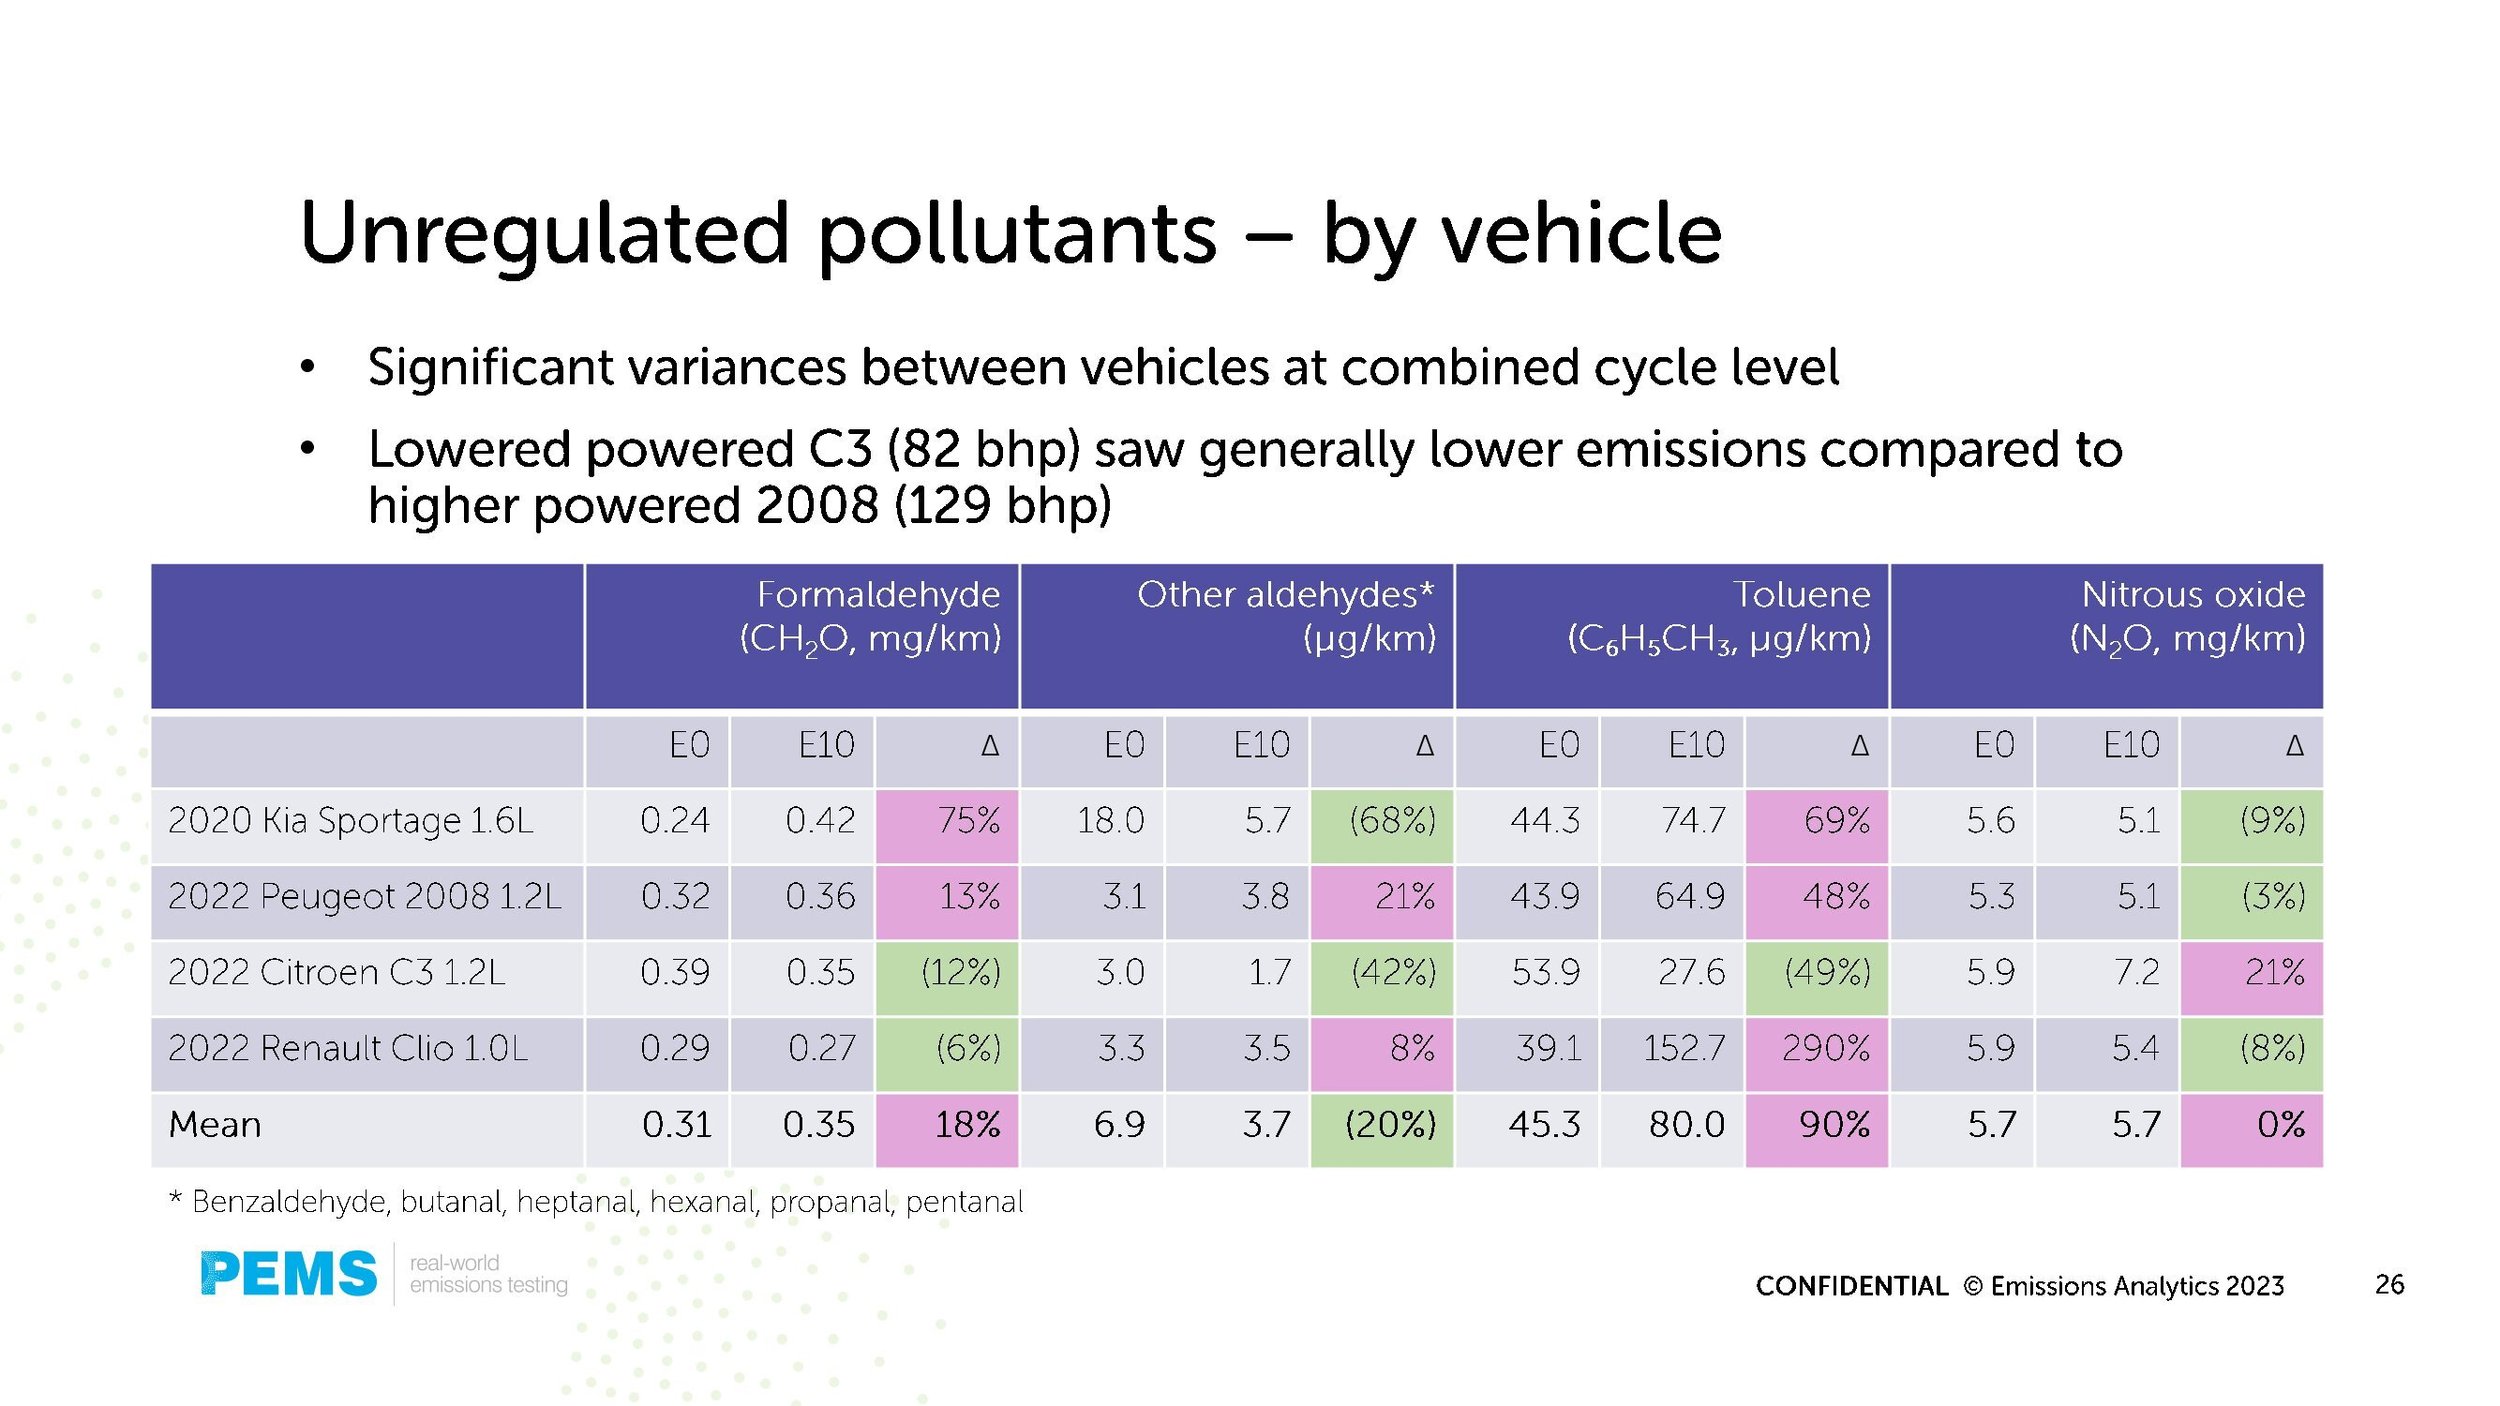
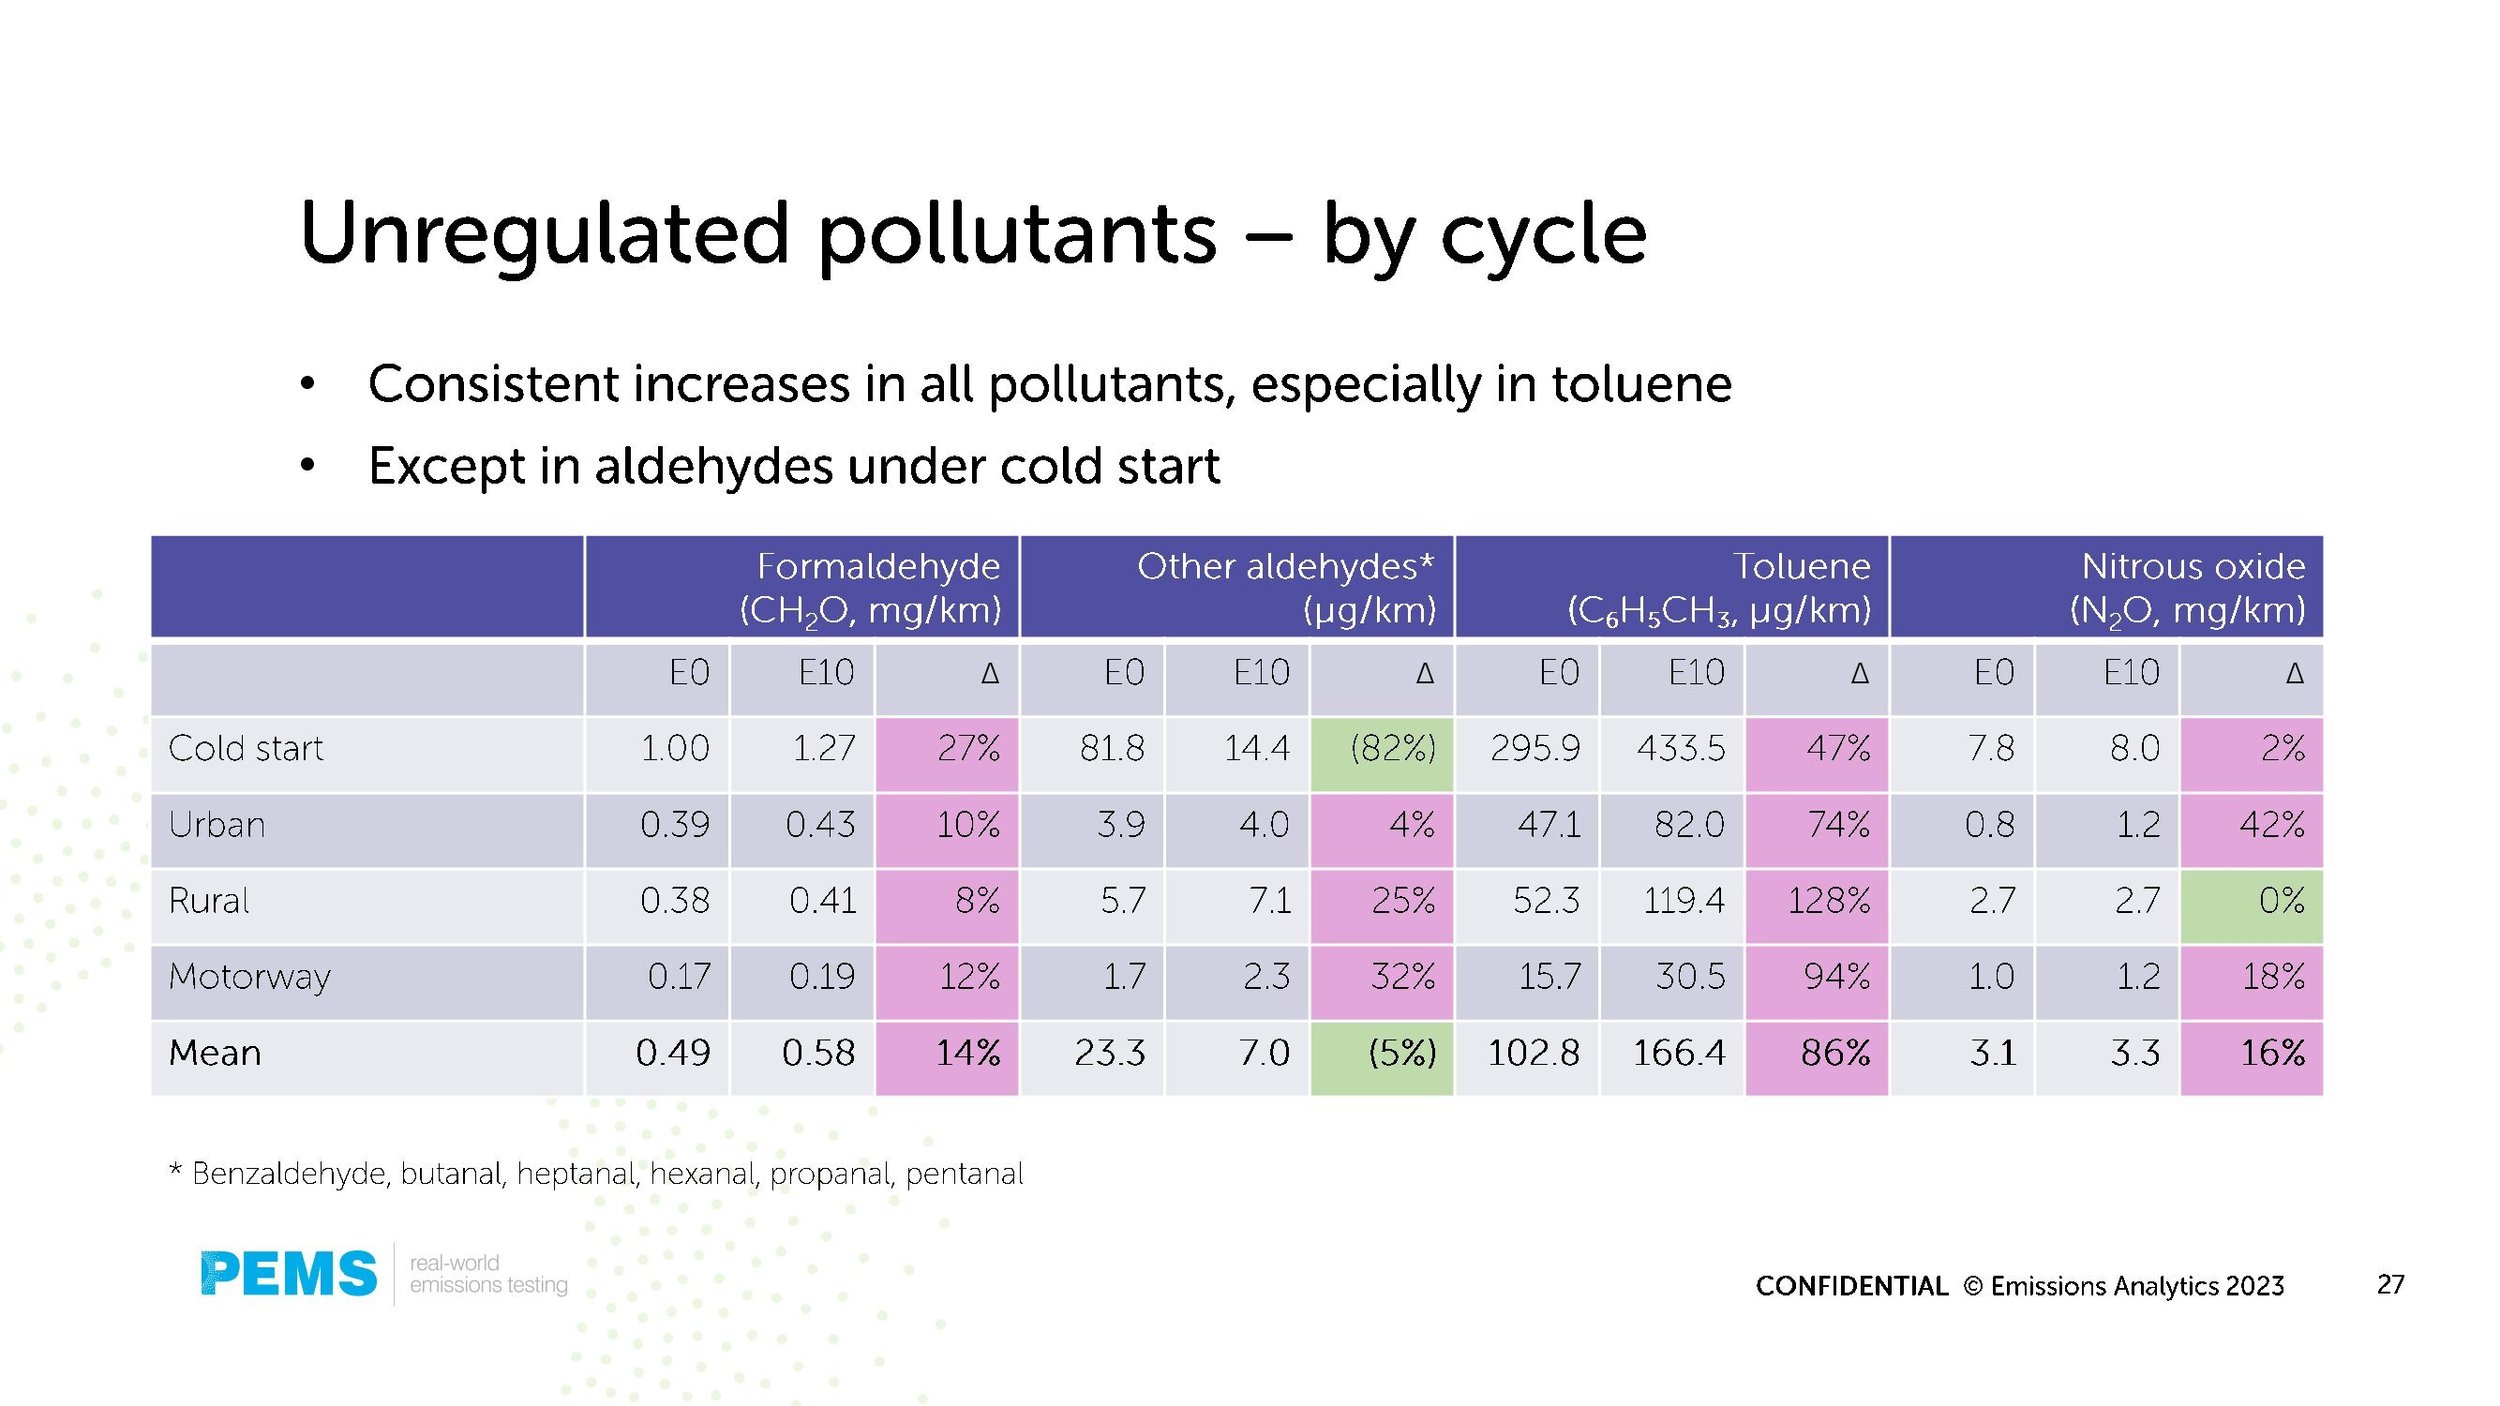
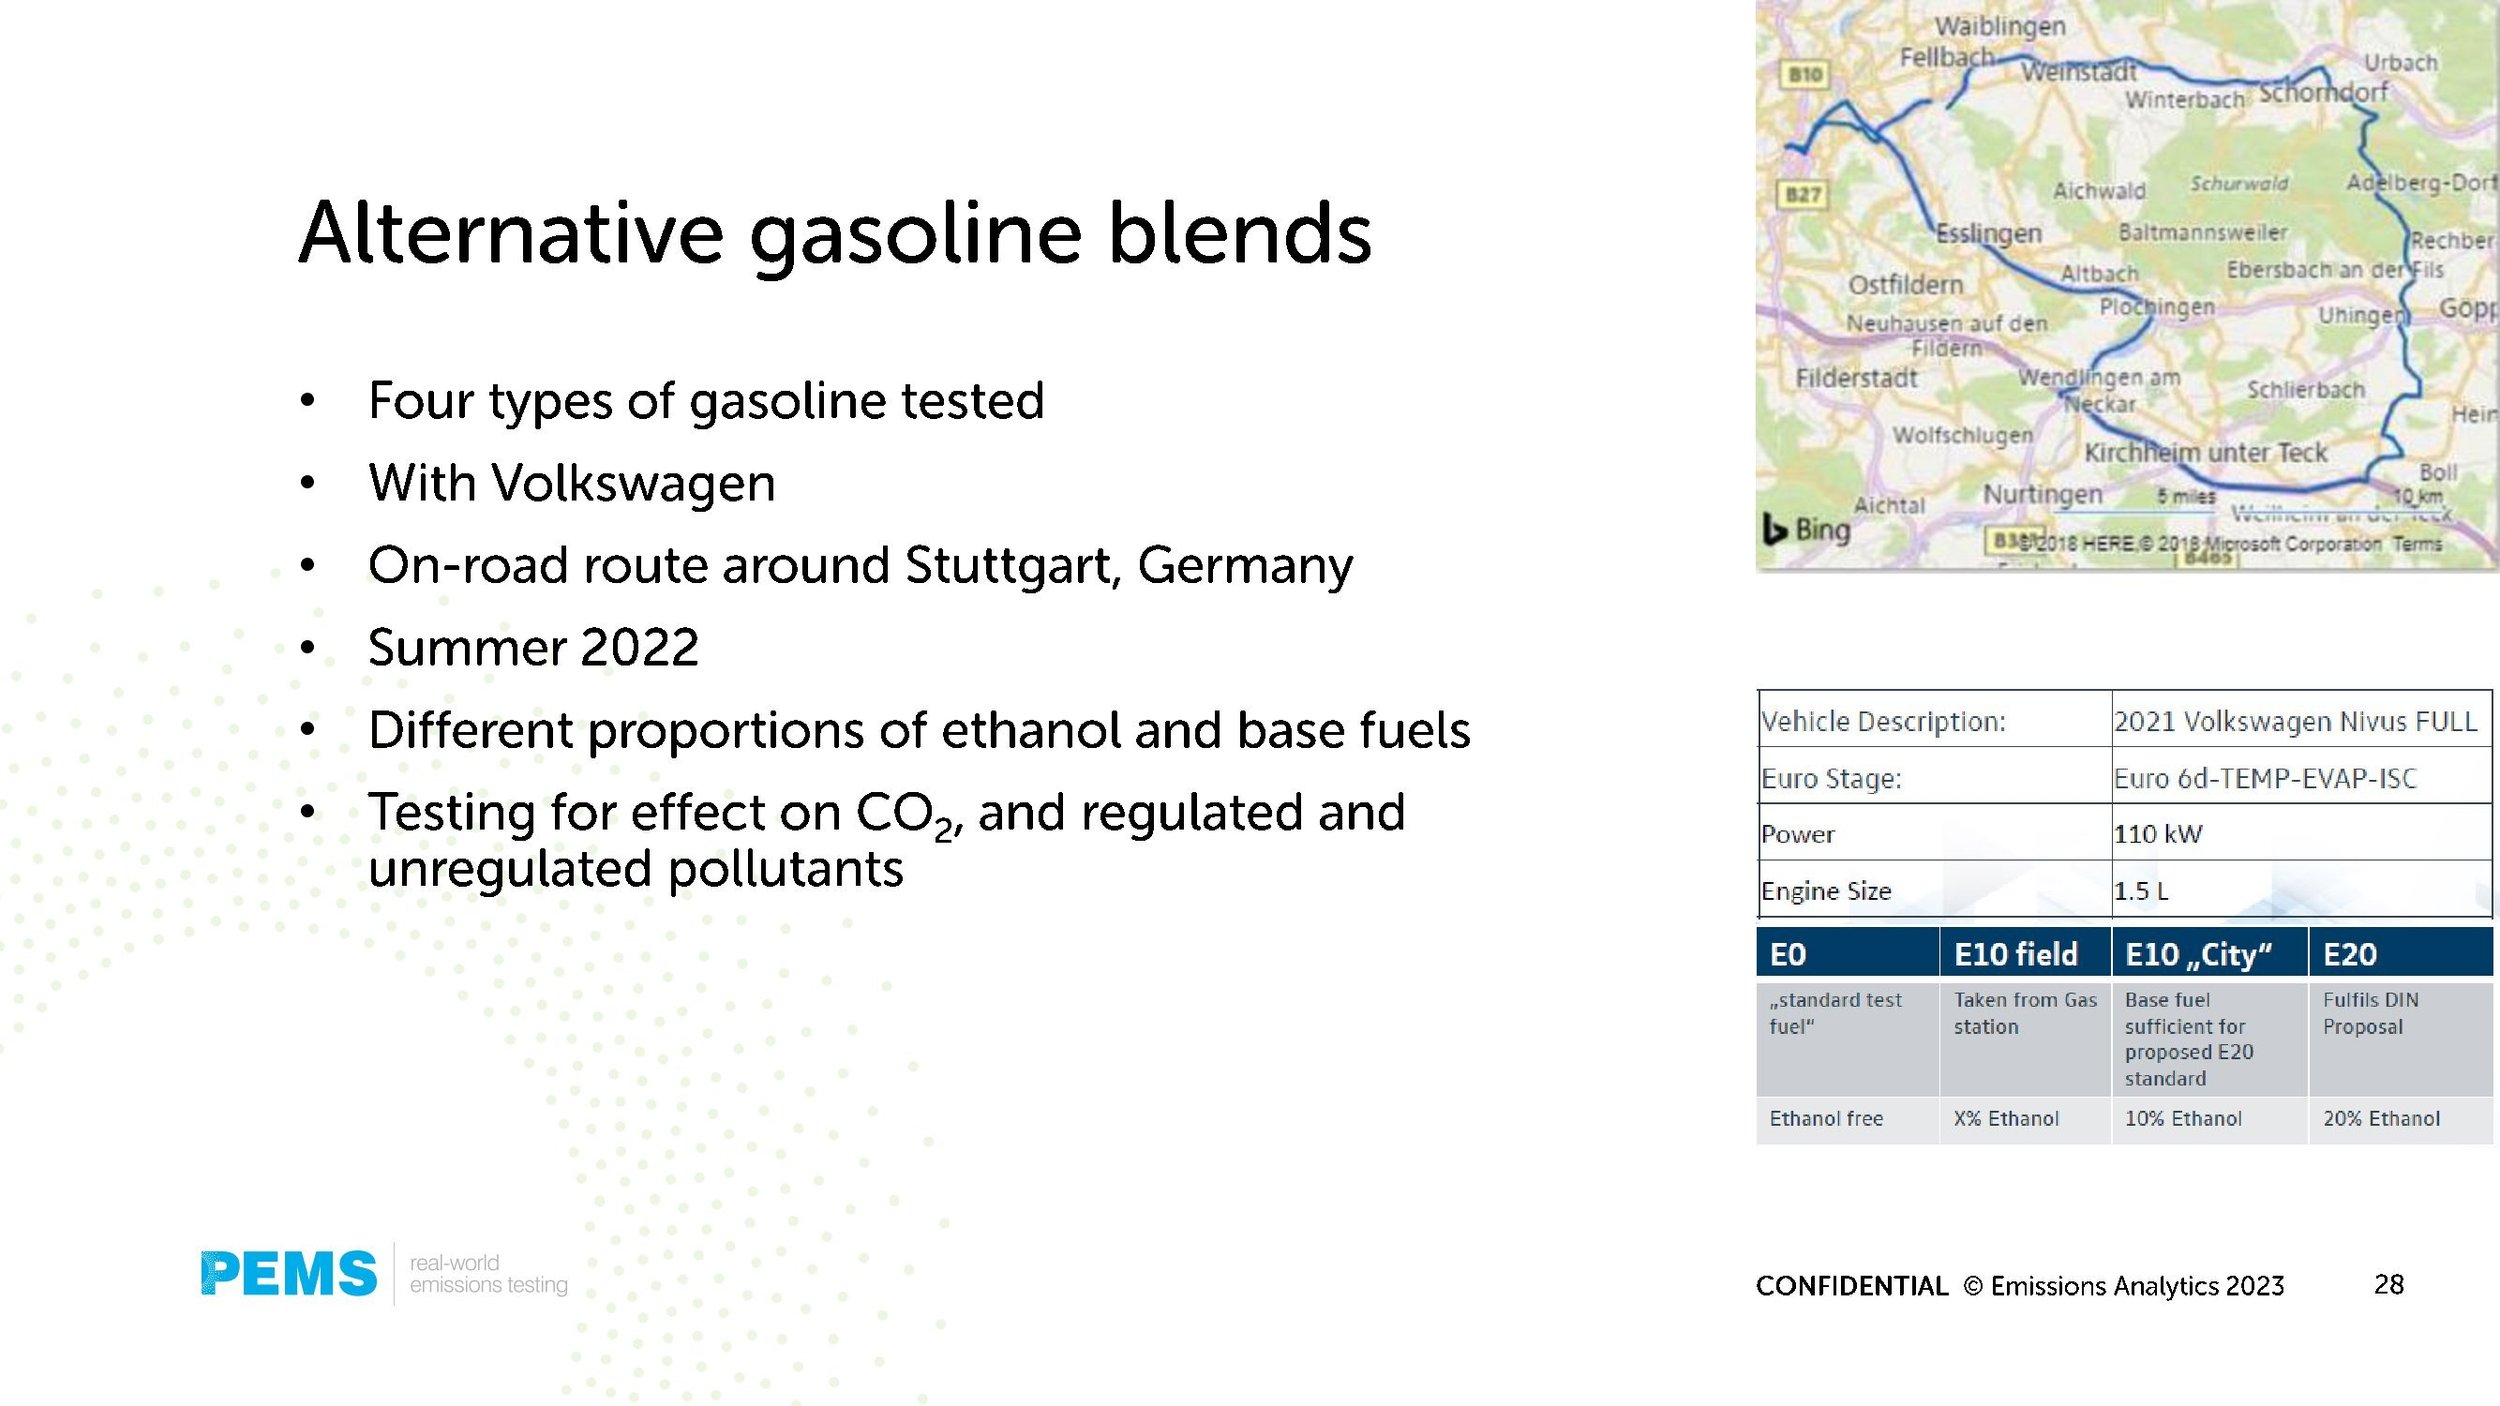
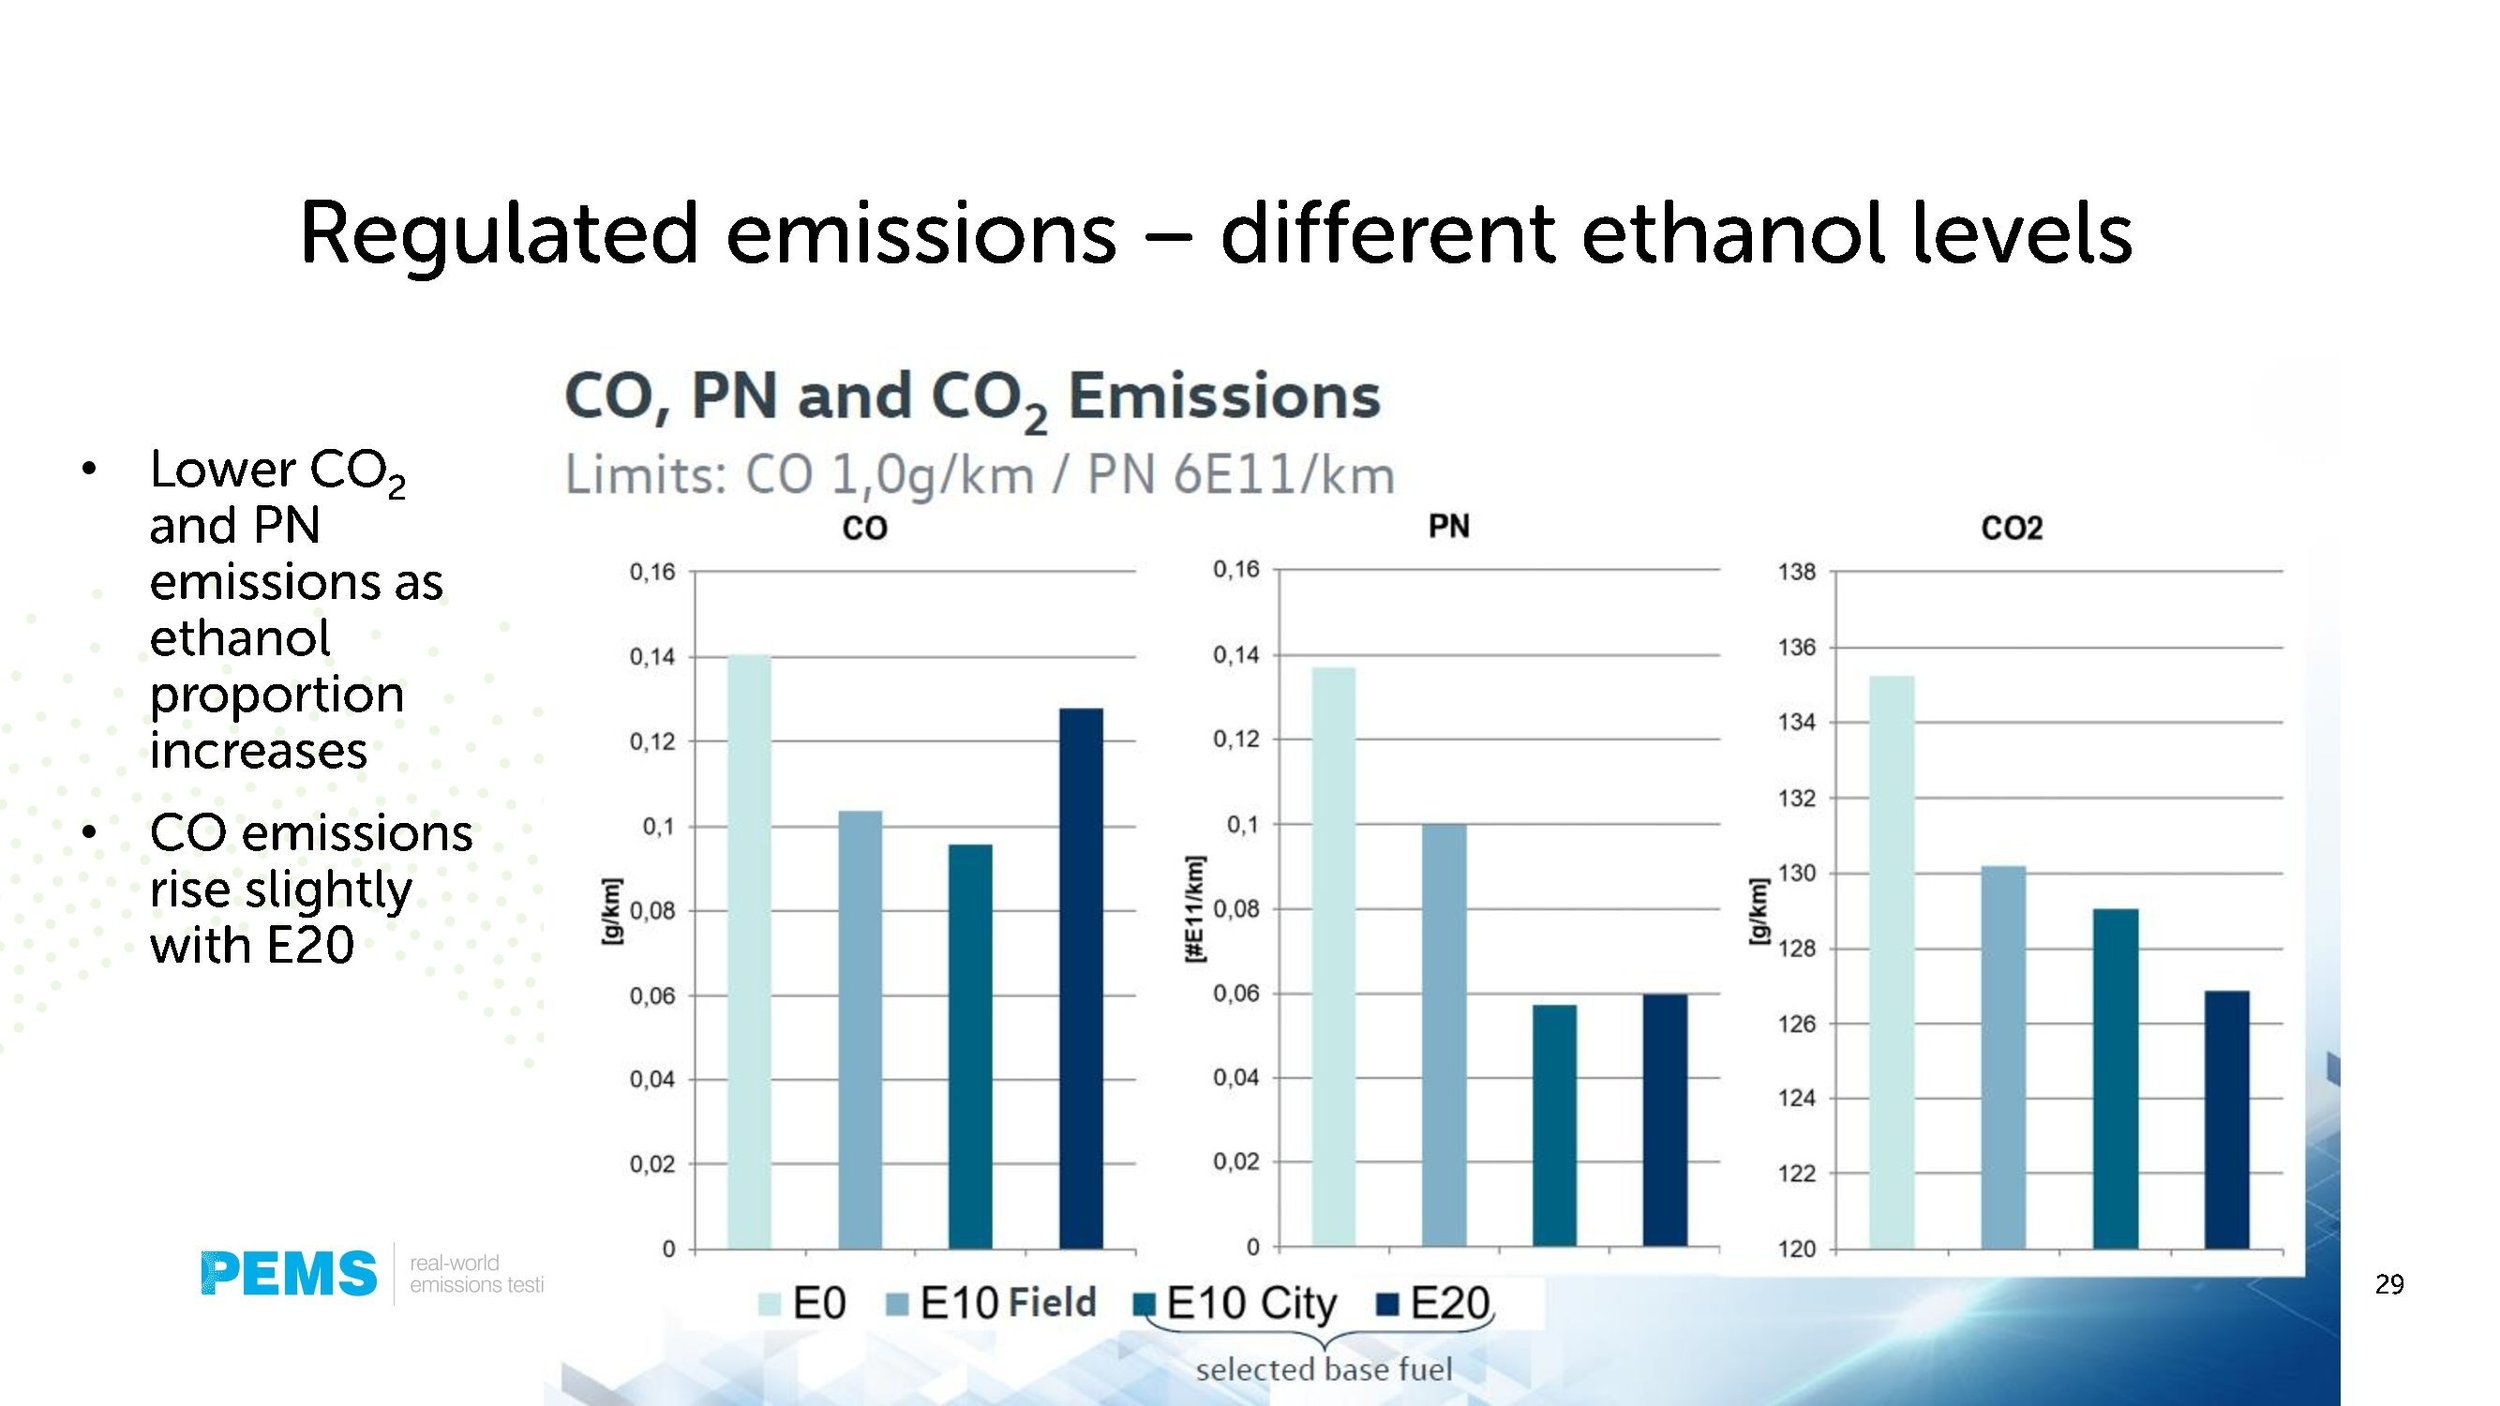
Webinar: The effects of renewable fuels on combustion emissions
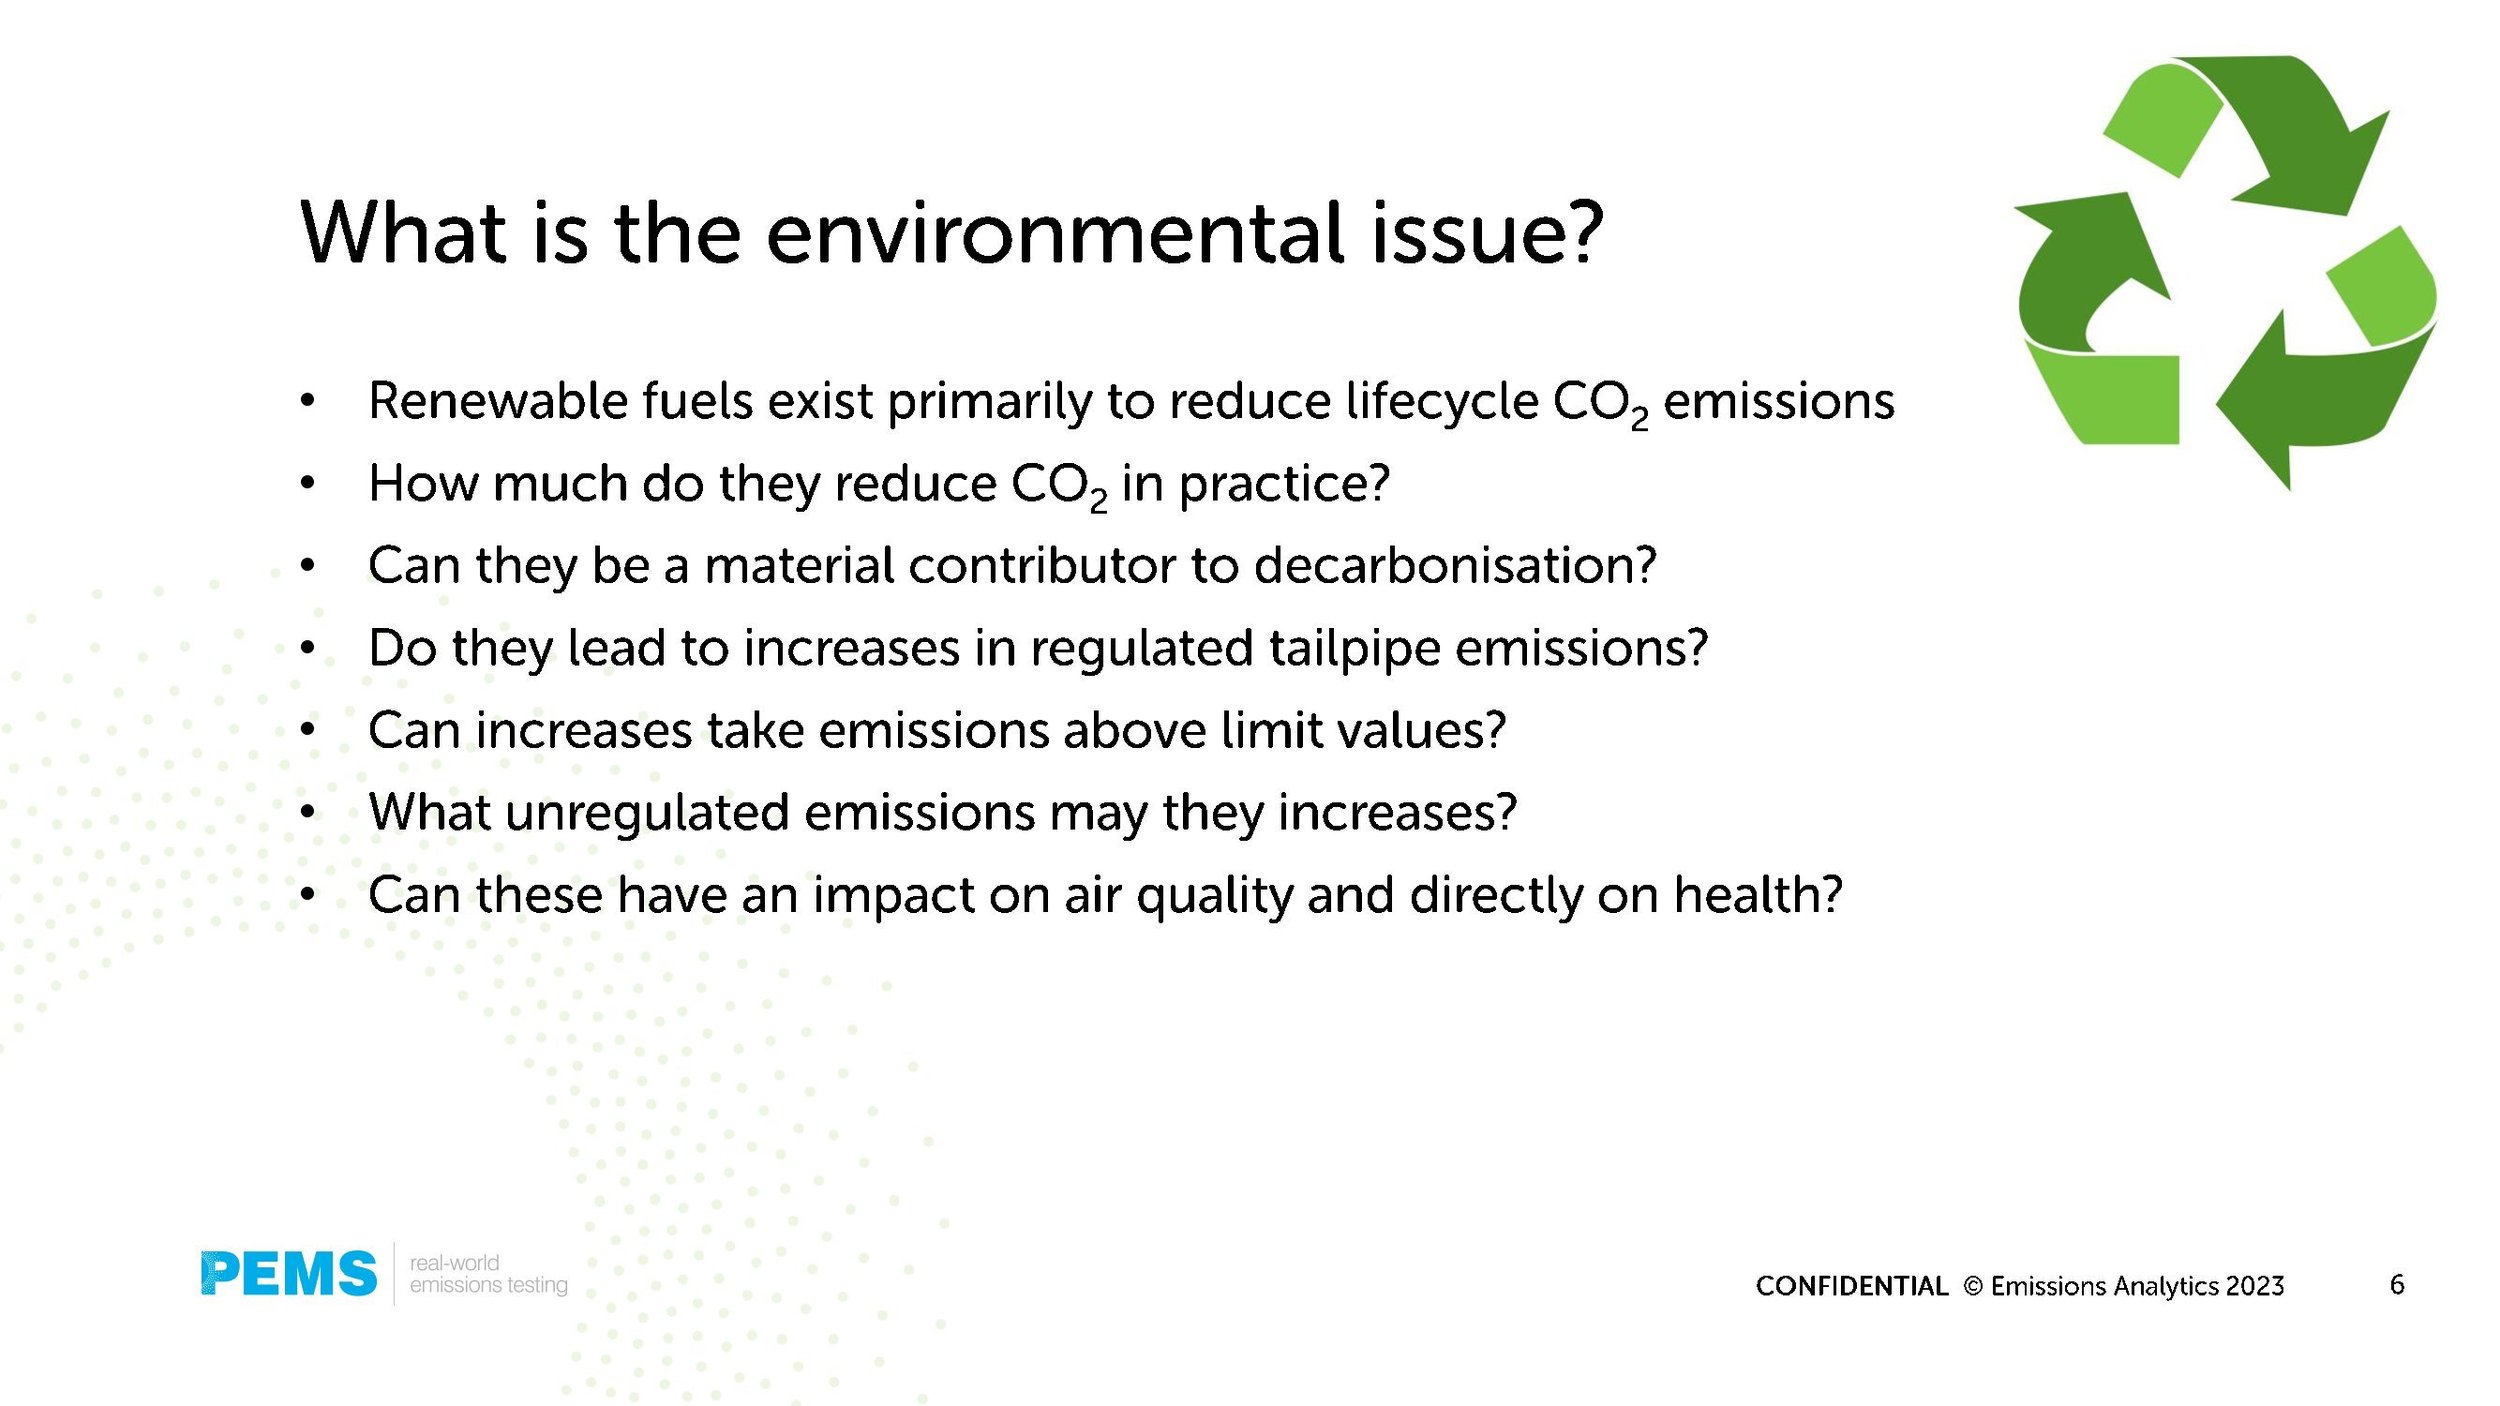
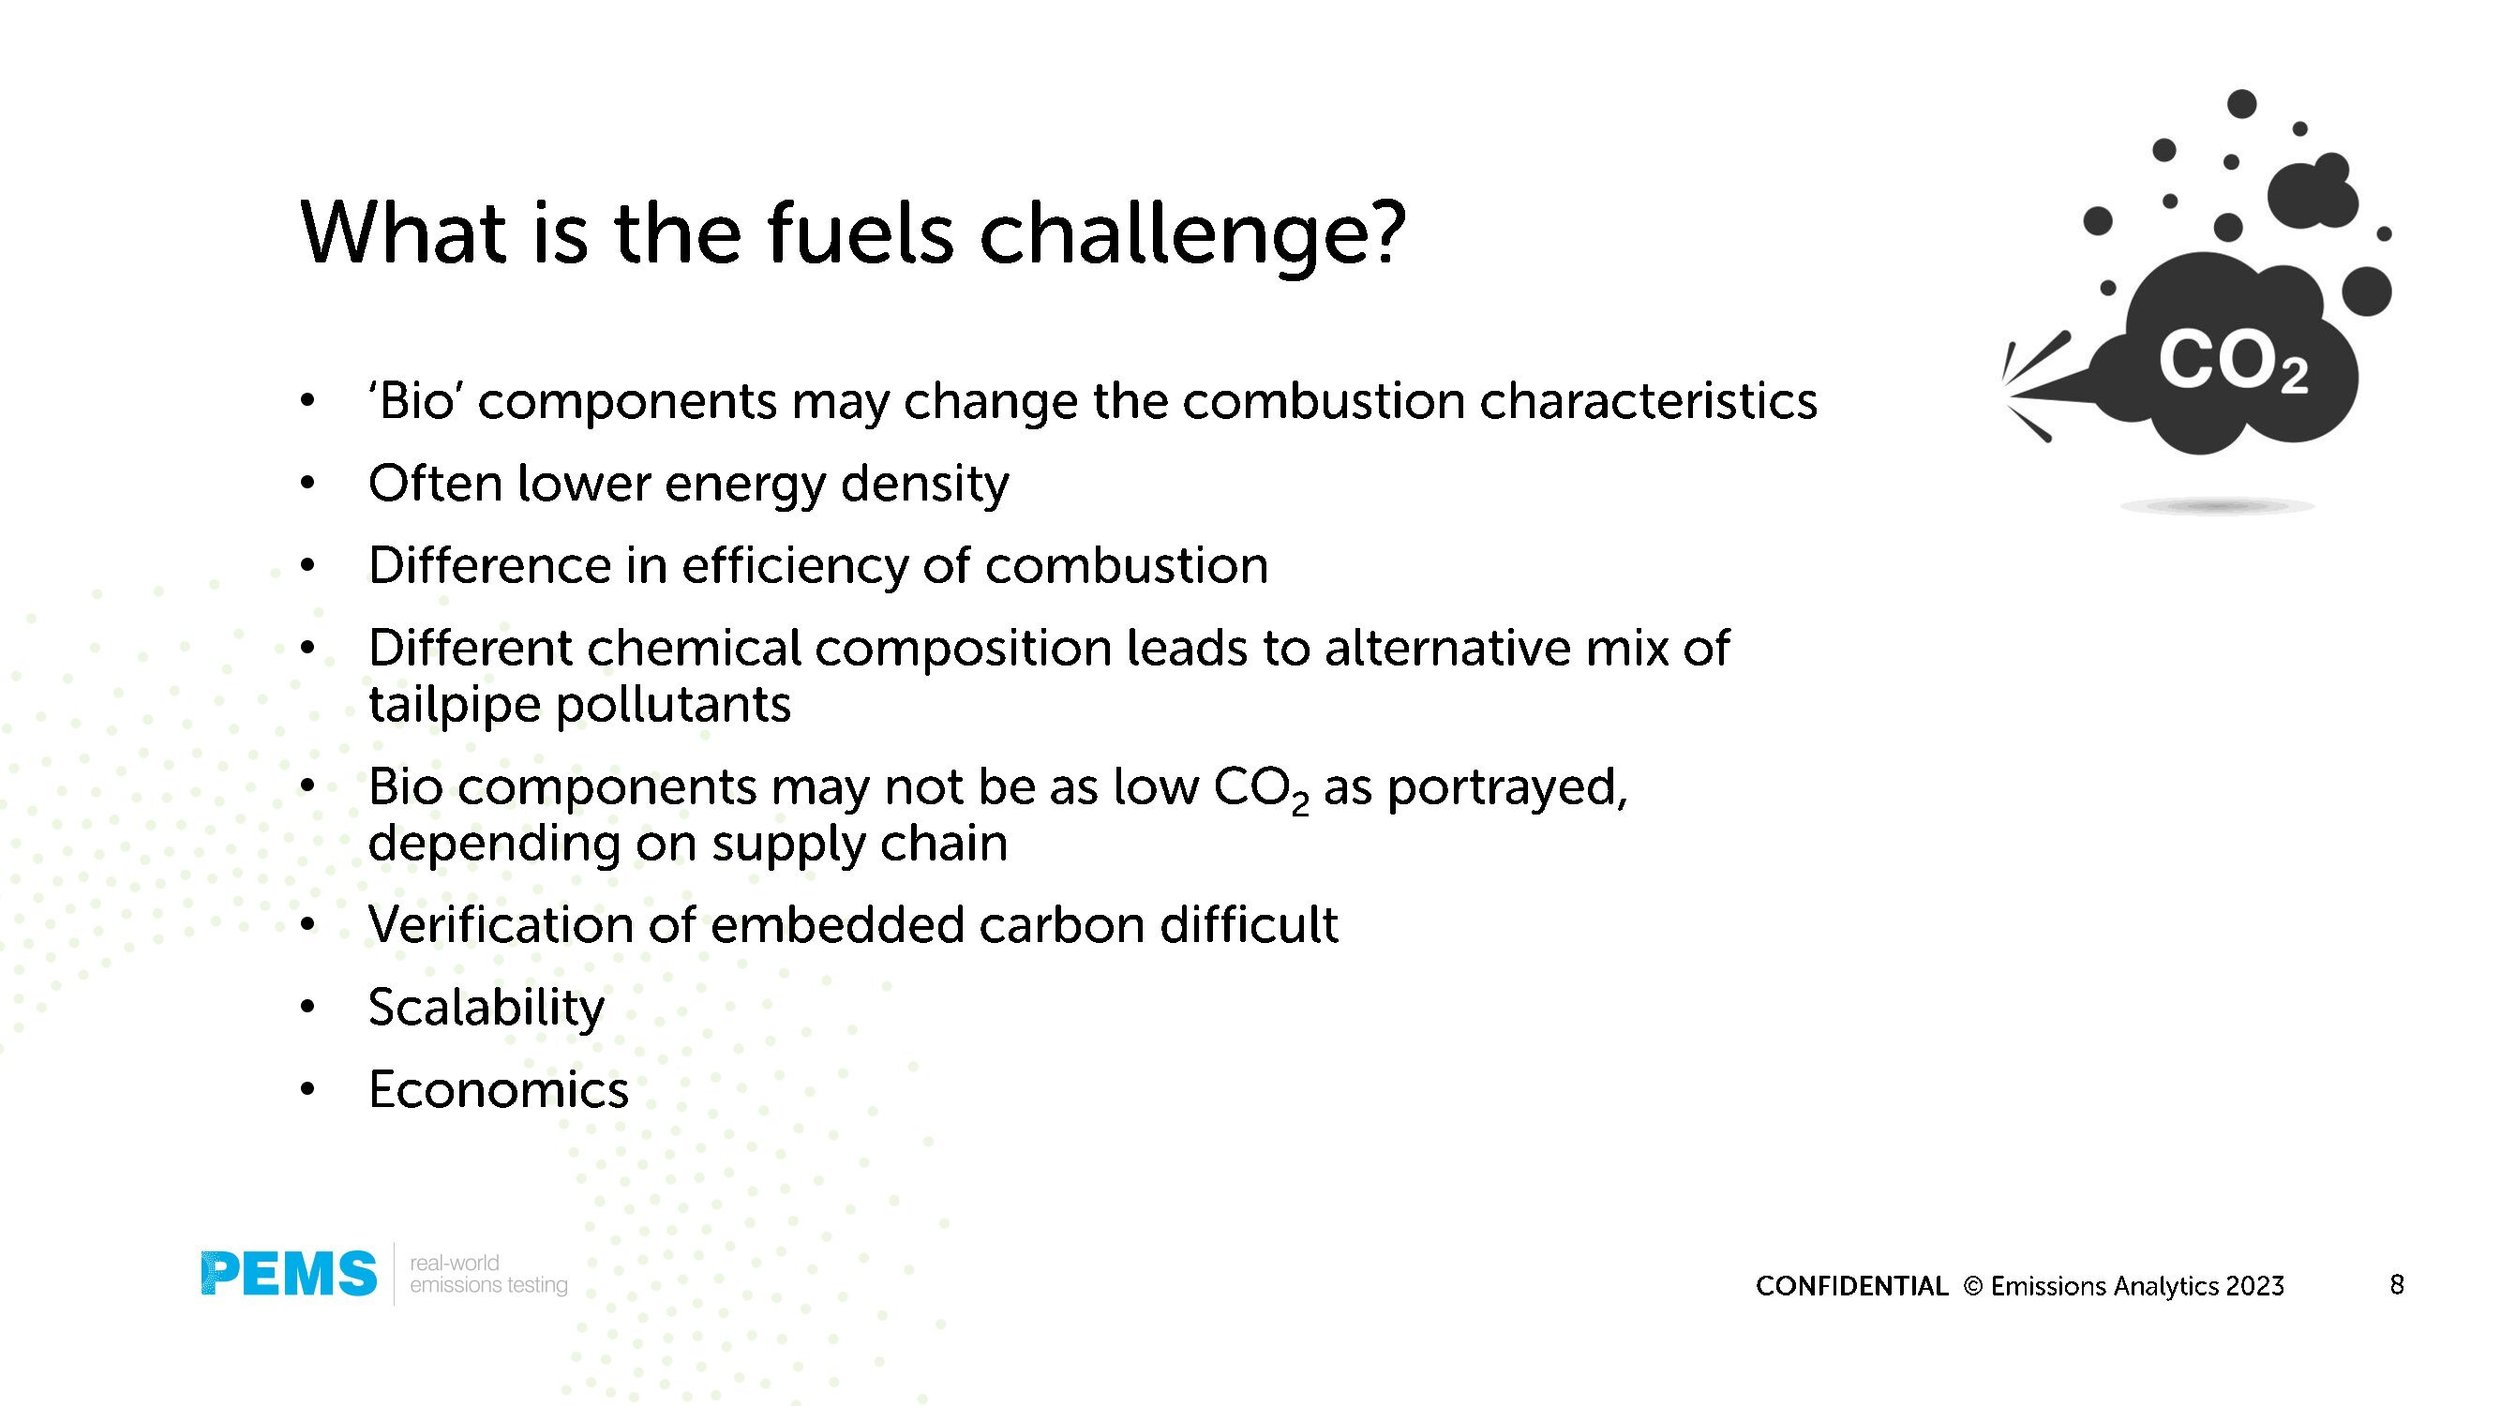
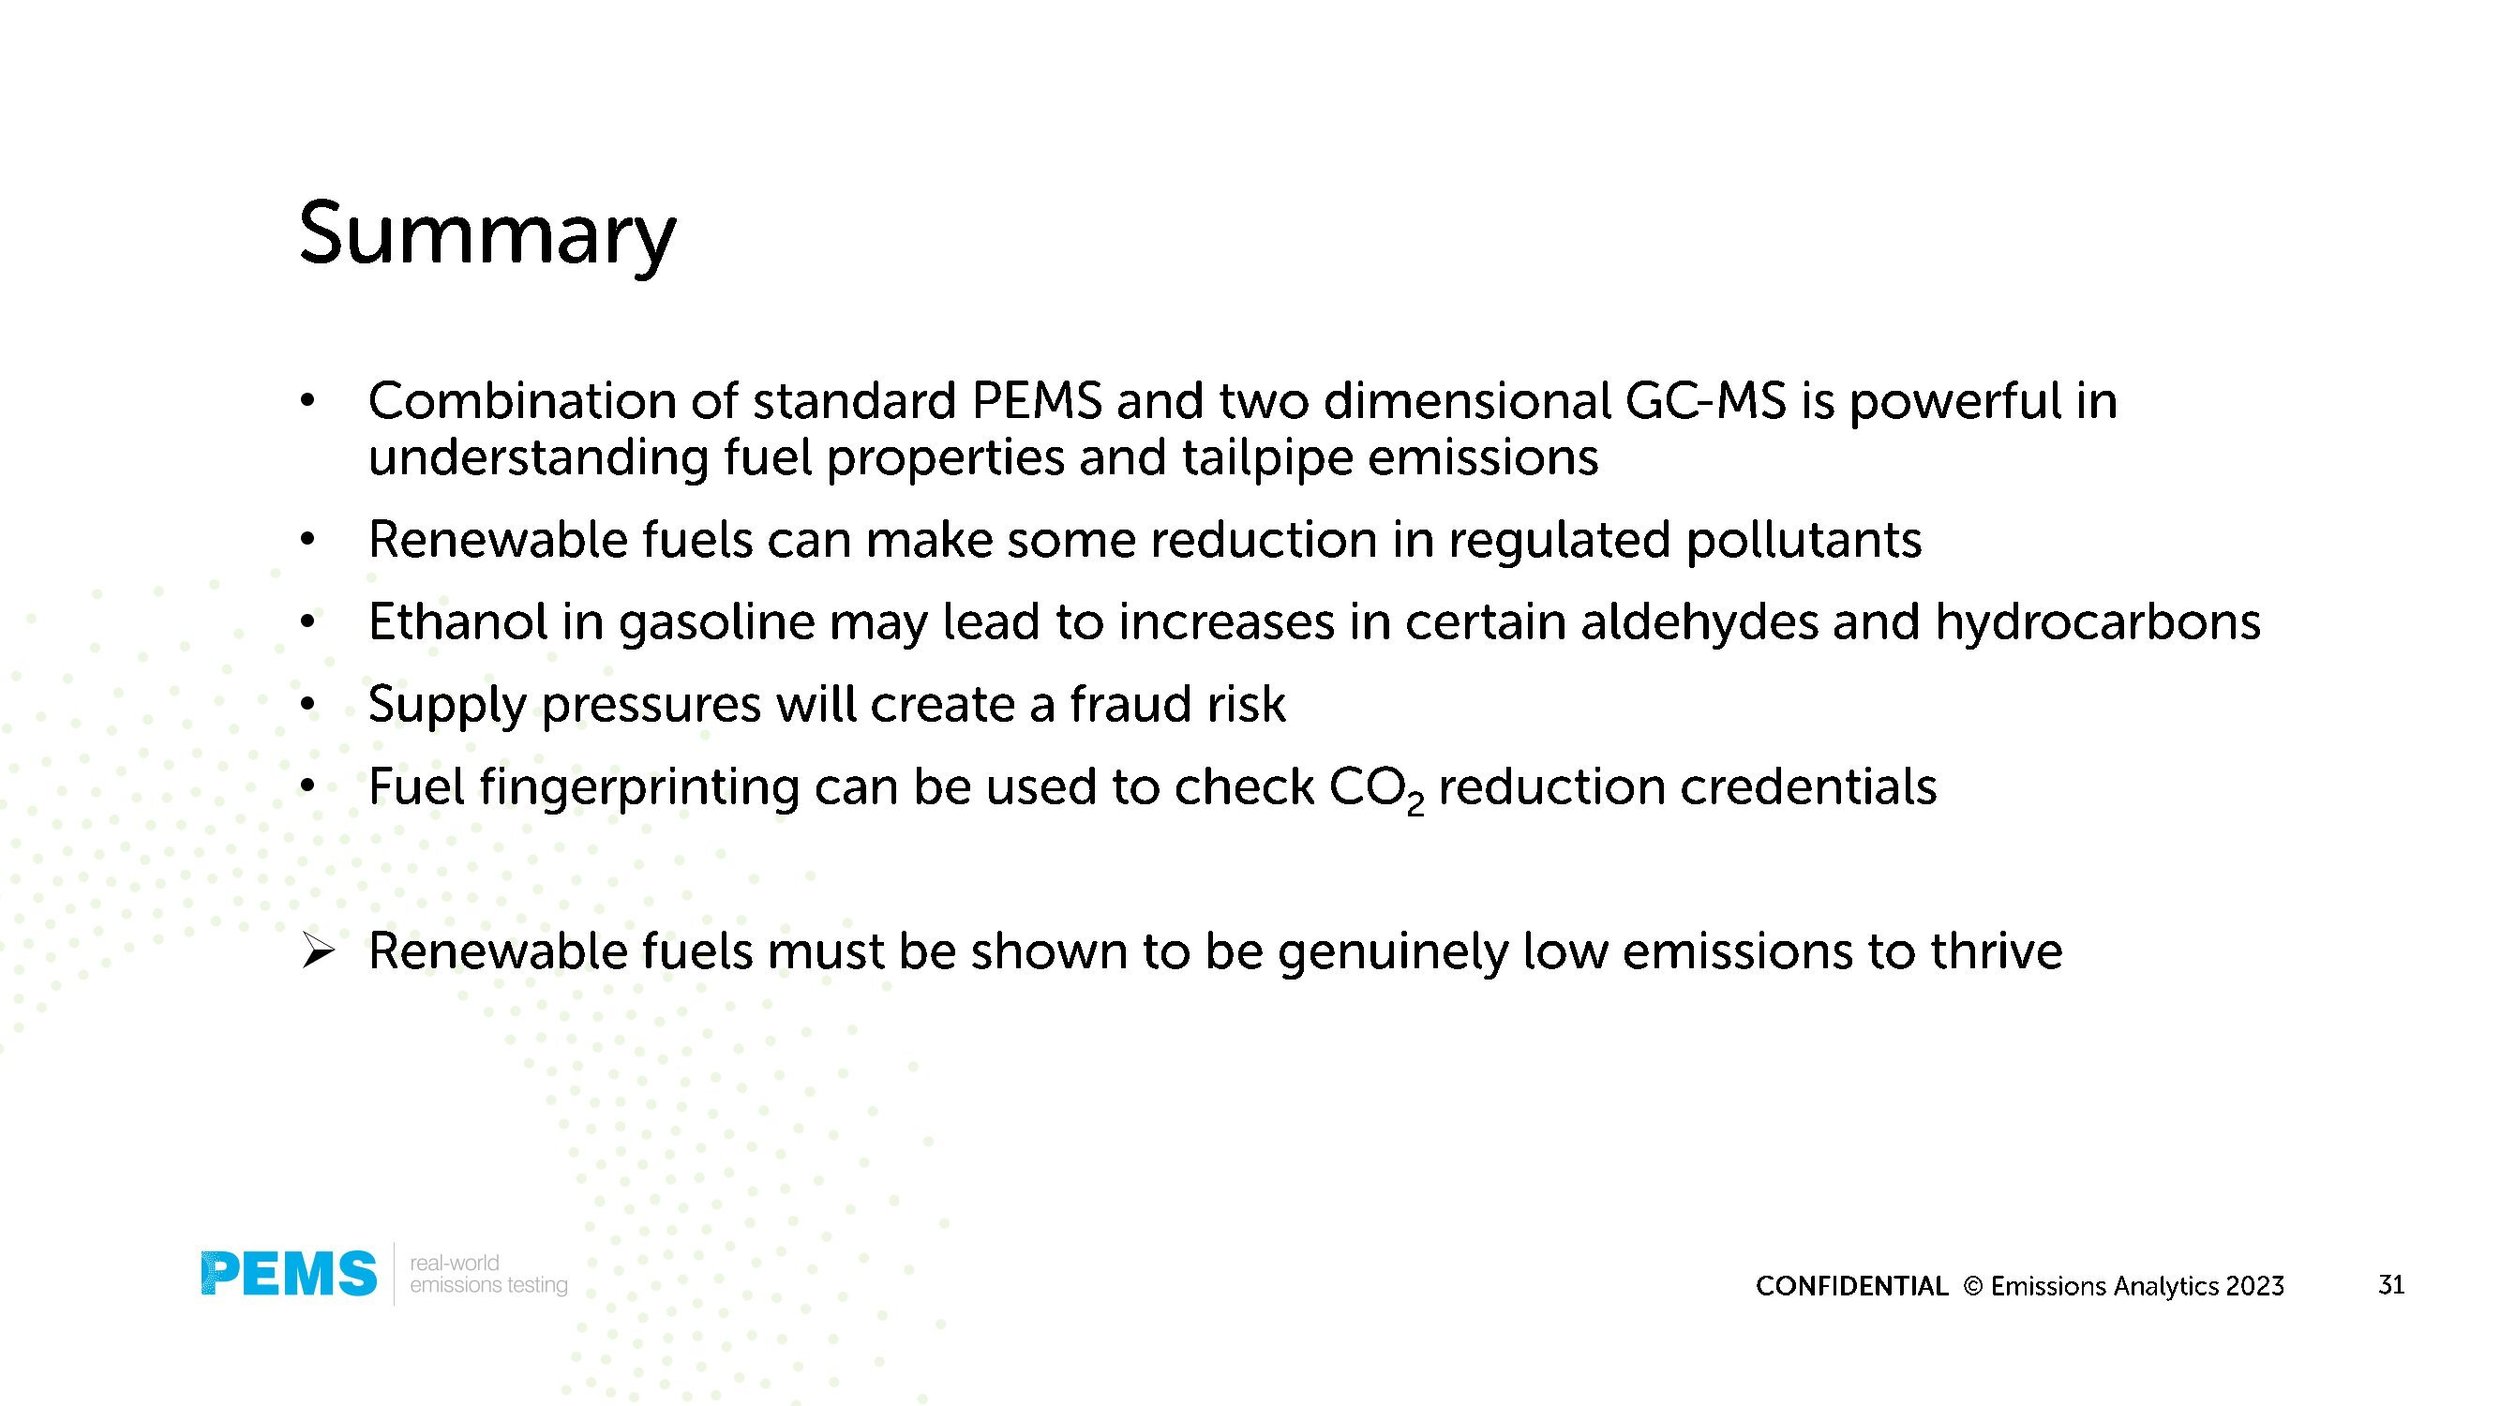
The webinar covering the latest results on the effect of renewable fuels on combustion emissions, which has been conducted together with the University of Oxford. It will look at the chemical composition of renewable fuels, consider the impact that has on tailpipe emissions, and see how well Euro 7 may capture these effects.
Our CEO & Founder, Nick Molden presented a webinar on the effects of renewable fuels on combustion emissions on 14th March 2023. To watch the webinar and download the presentation please see below.
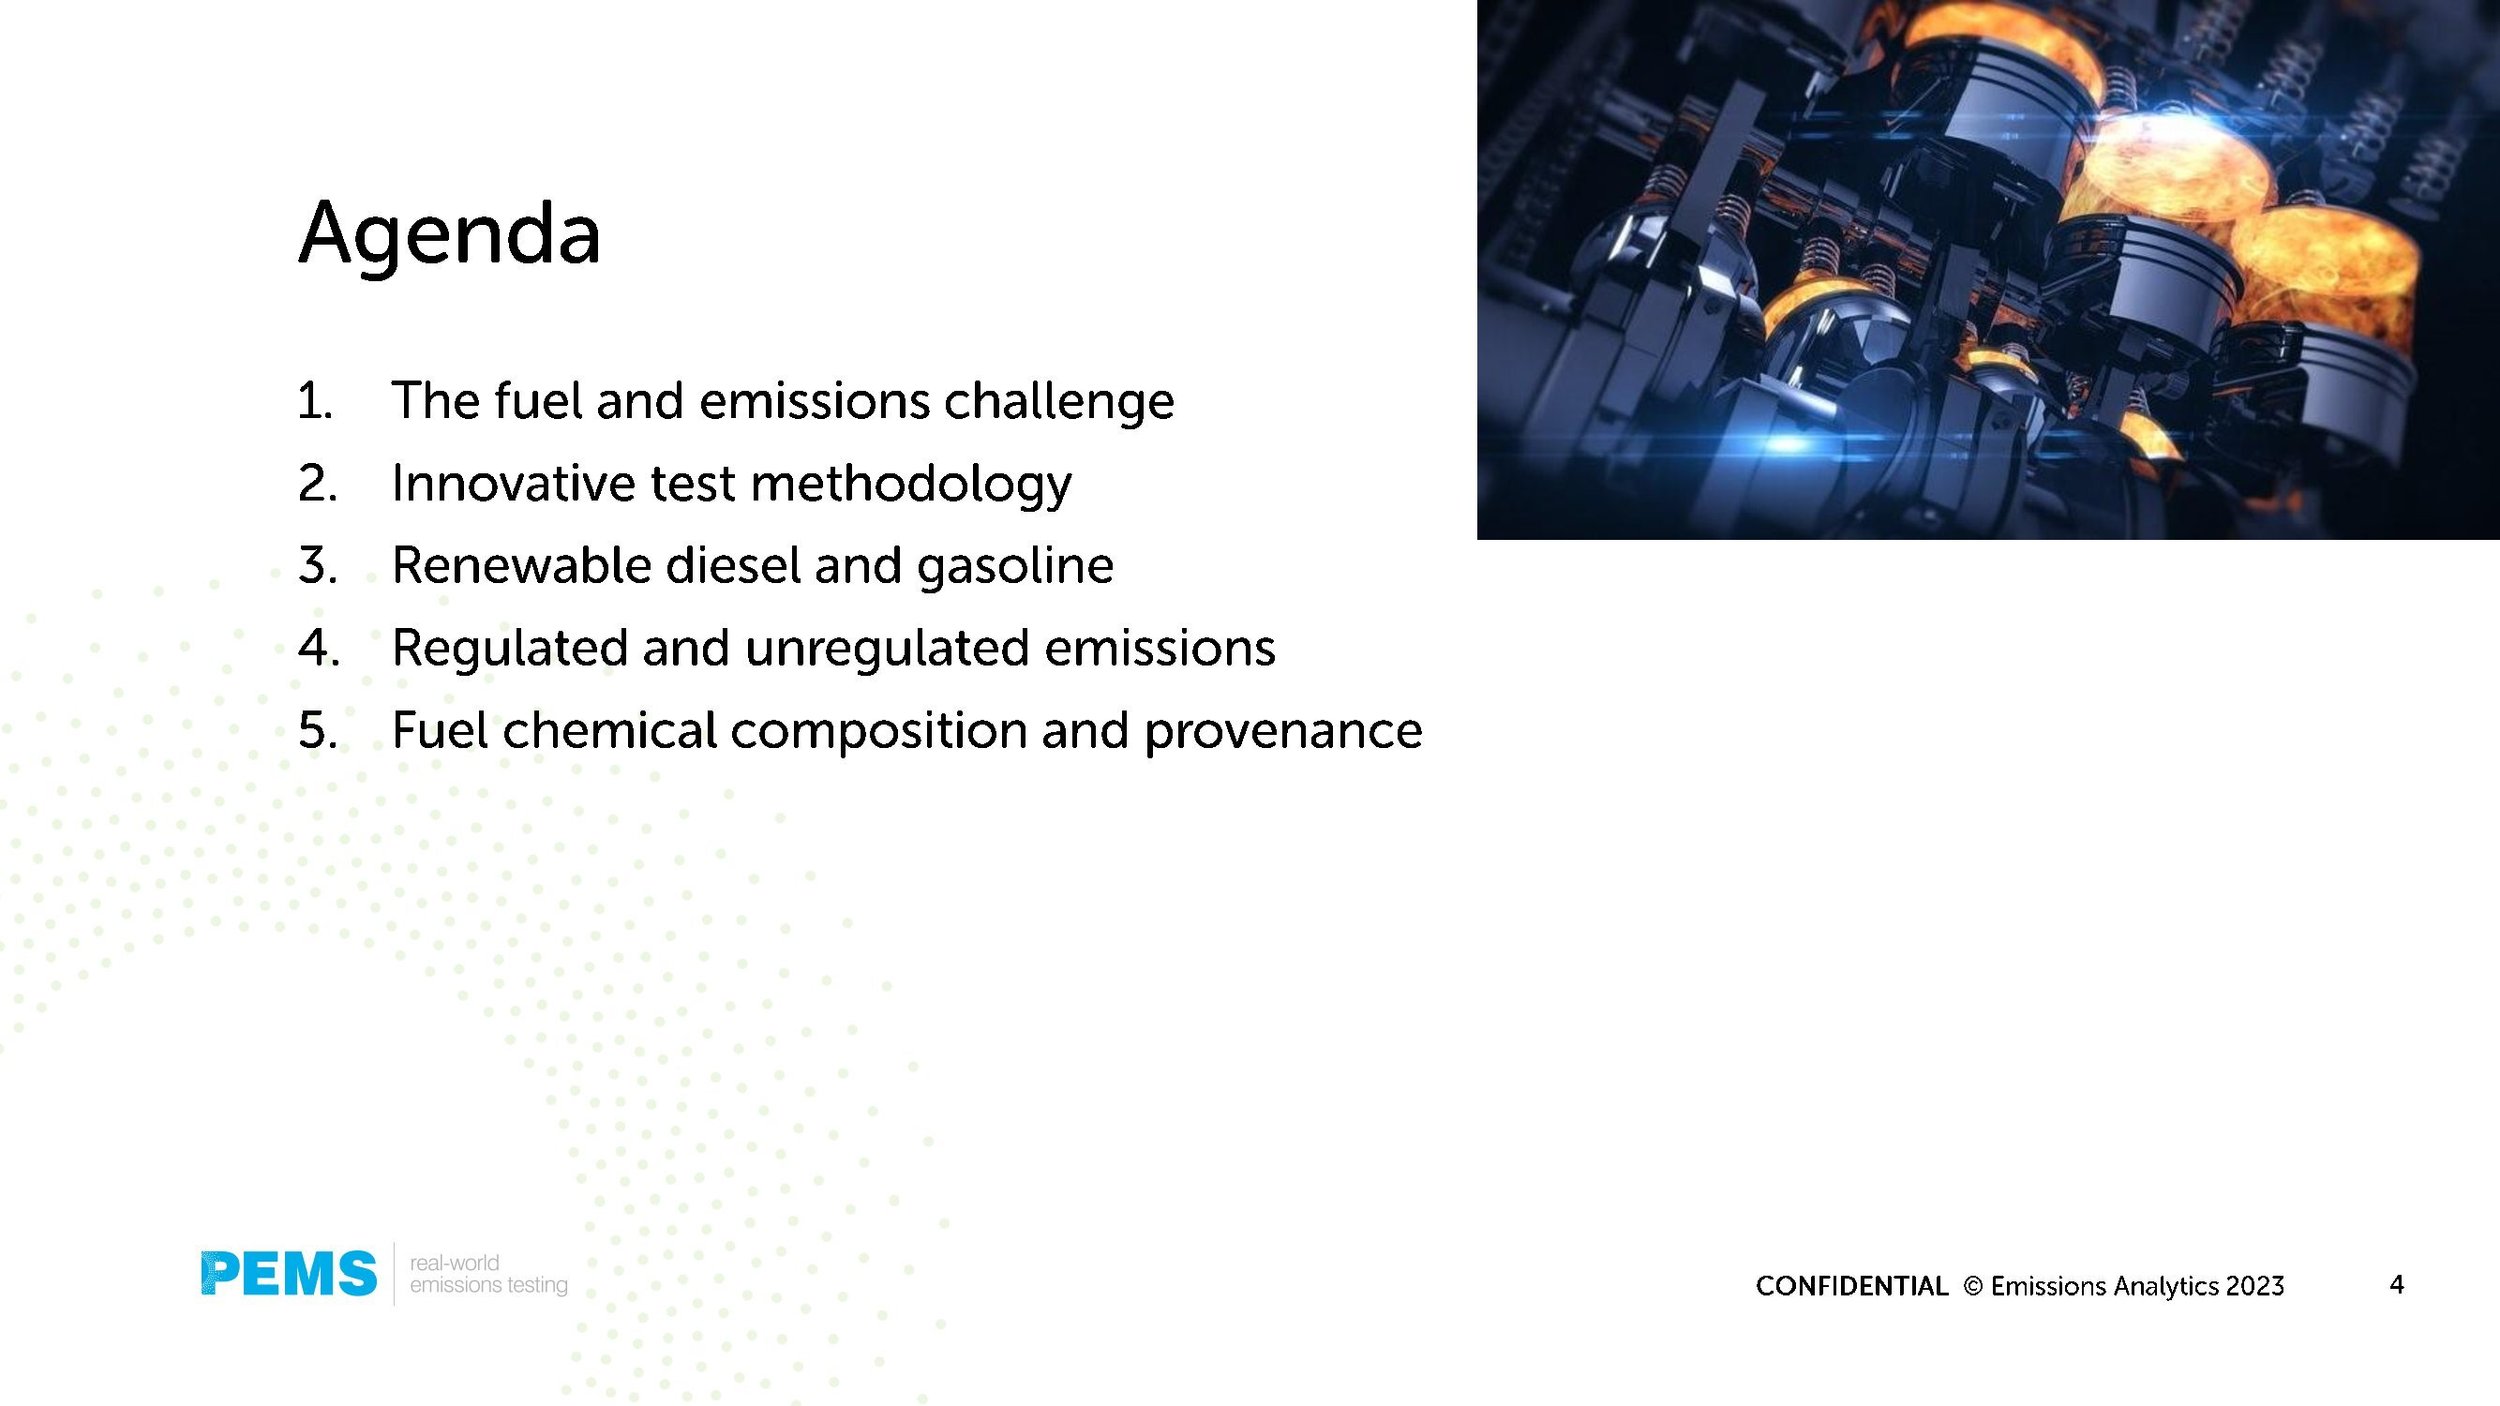
The webinar covering the latest results on the effect of renewable fuels on combustion emissions, which has been conducted together with the University of Oxford. It will look at the chemical composition of renewable fuels, consider the impact that has on tailpipe emissions, and see how well Euro 7 may capture these effects. The presentation will cover:
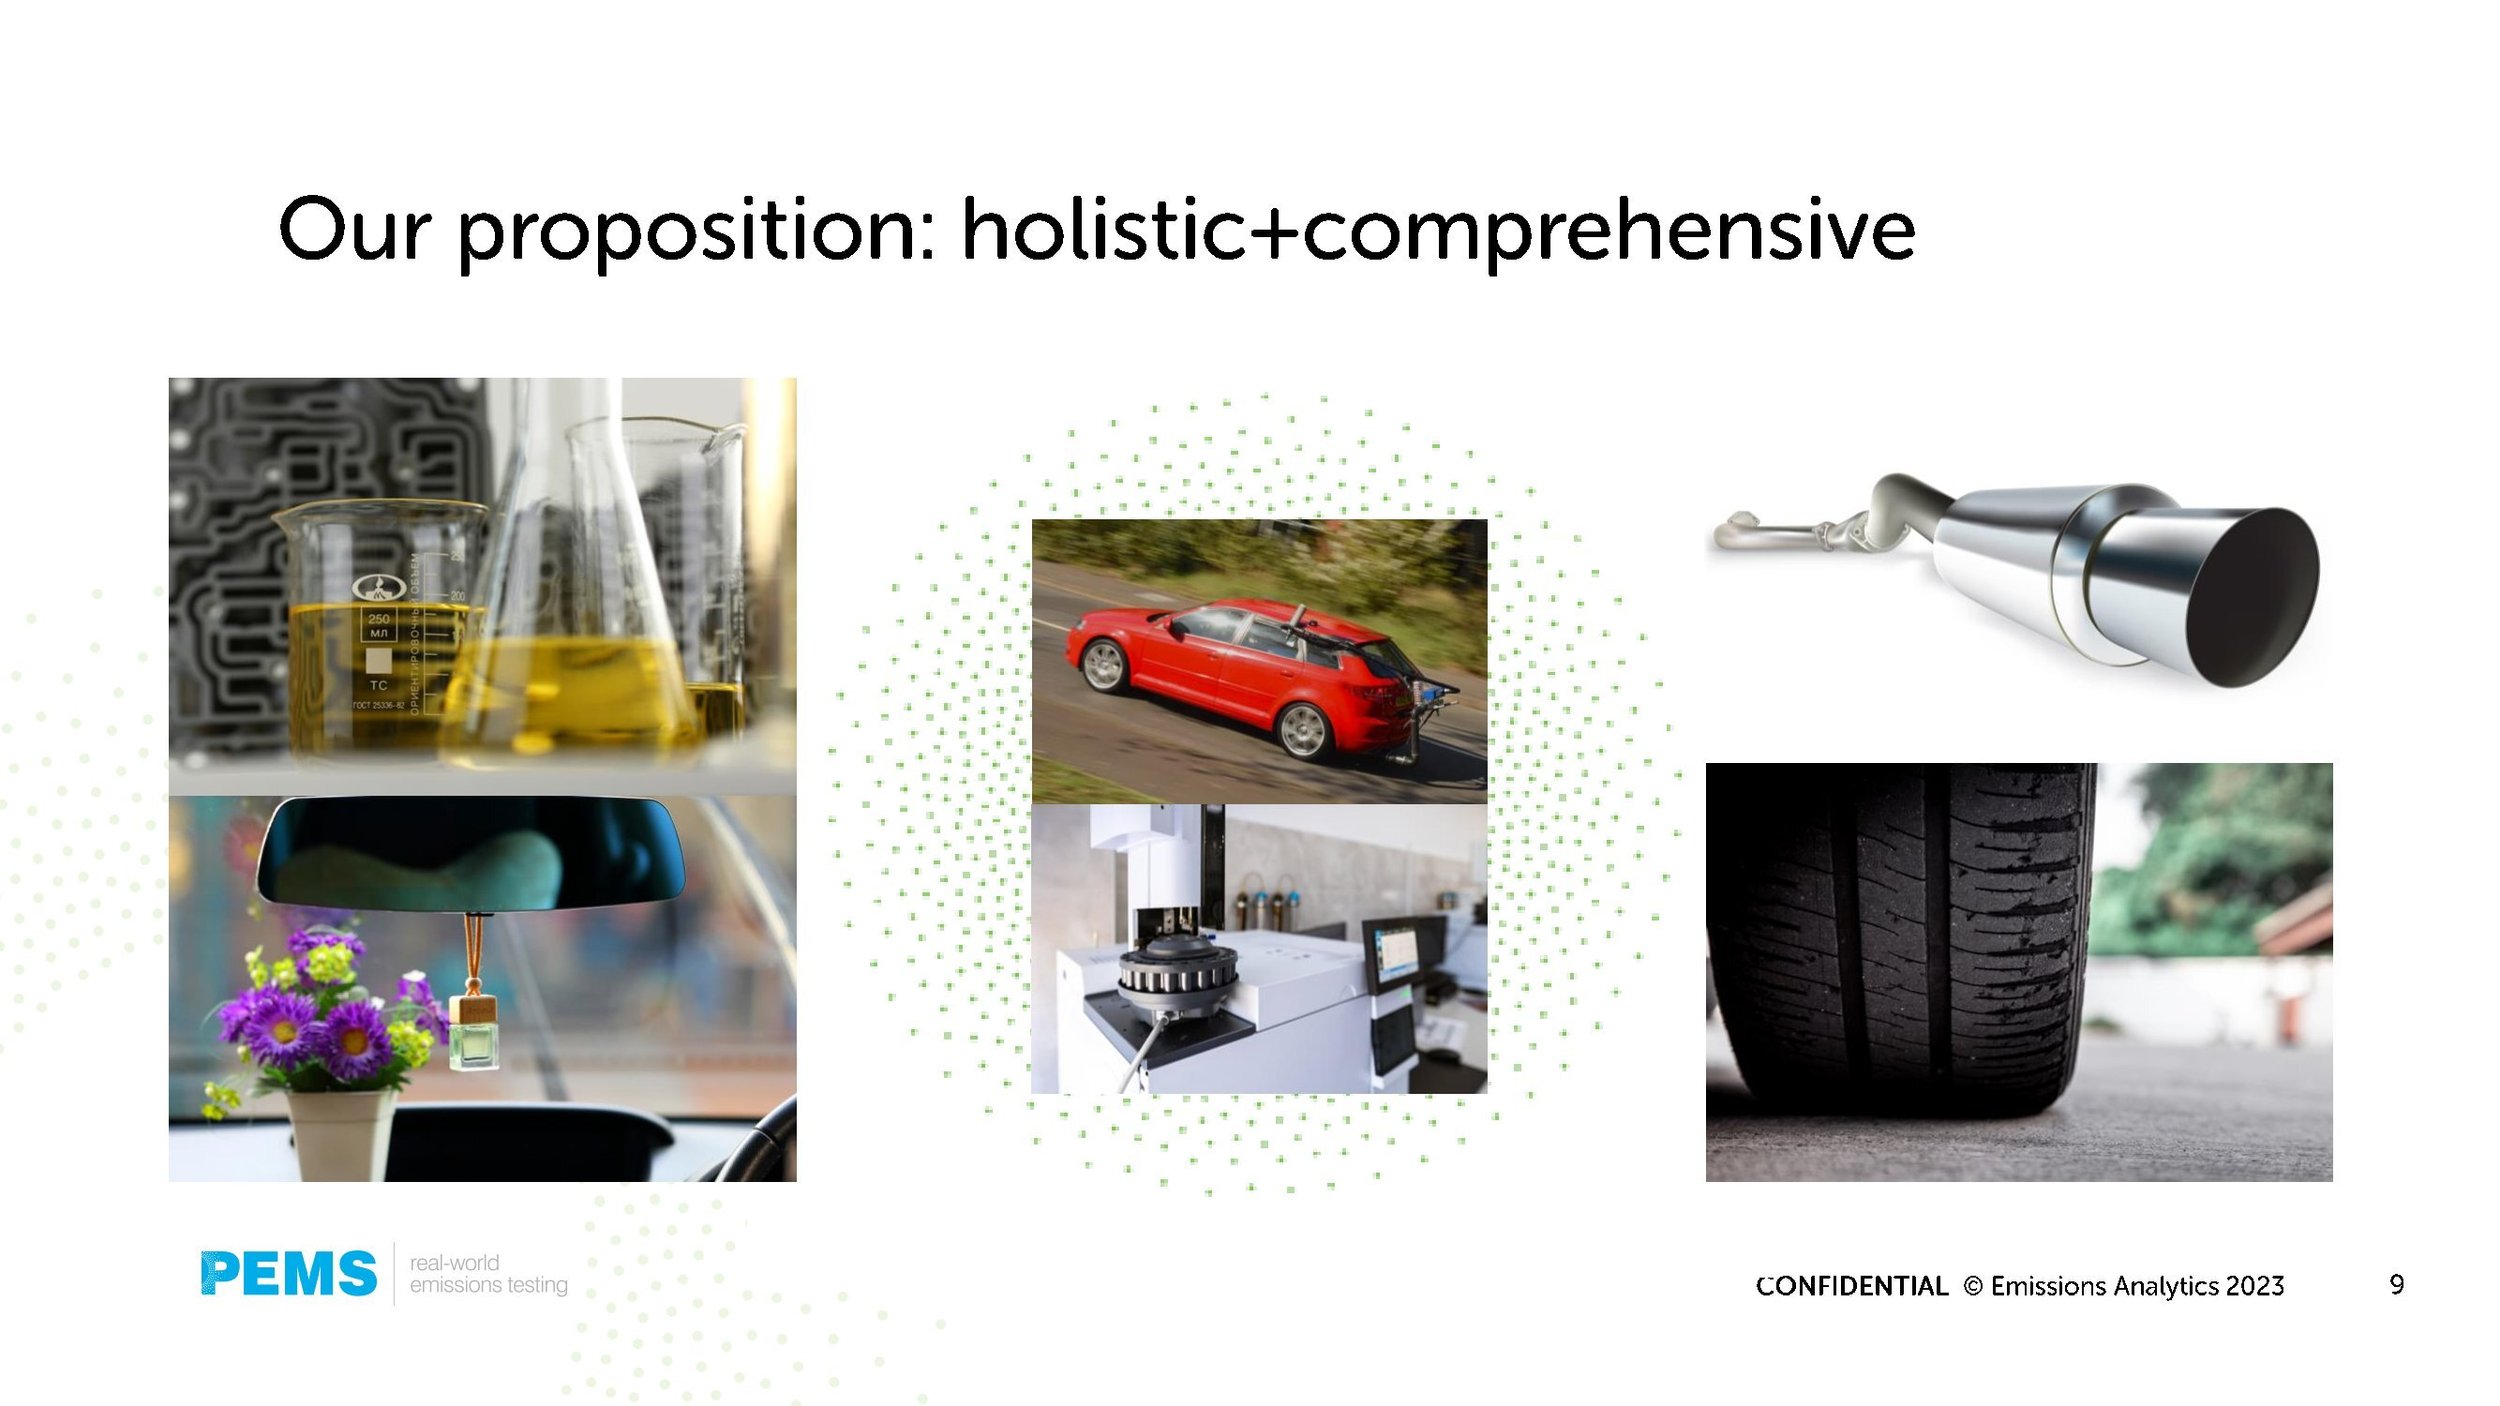
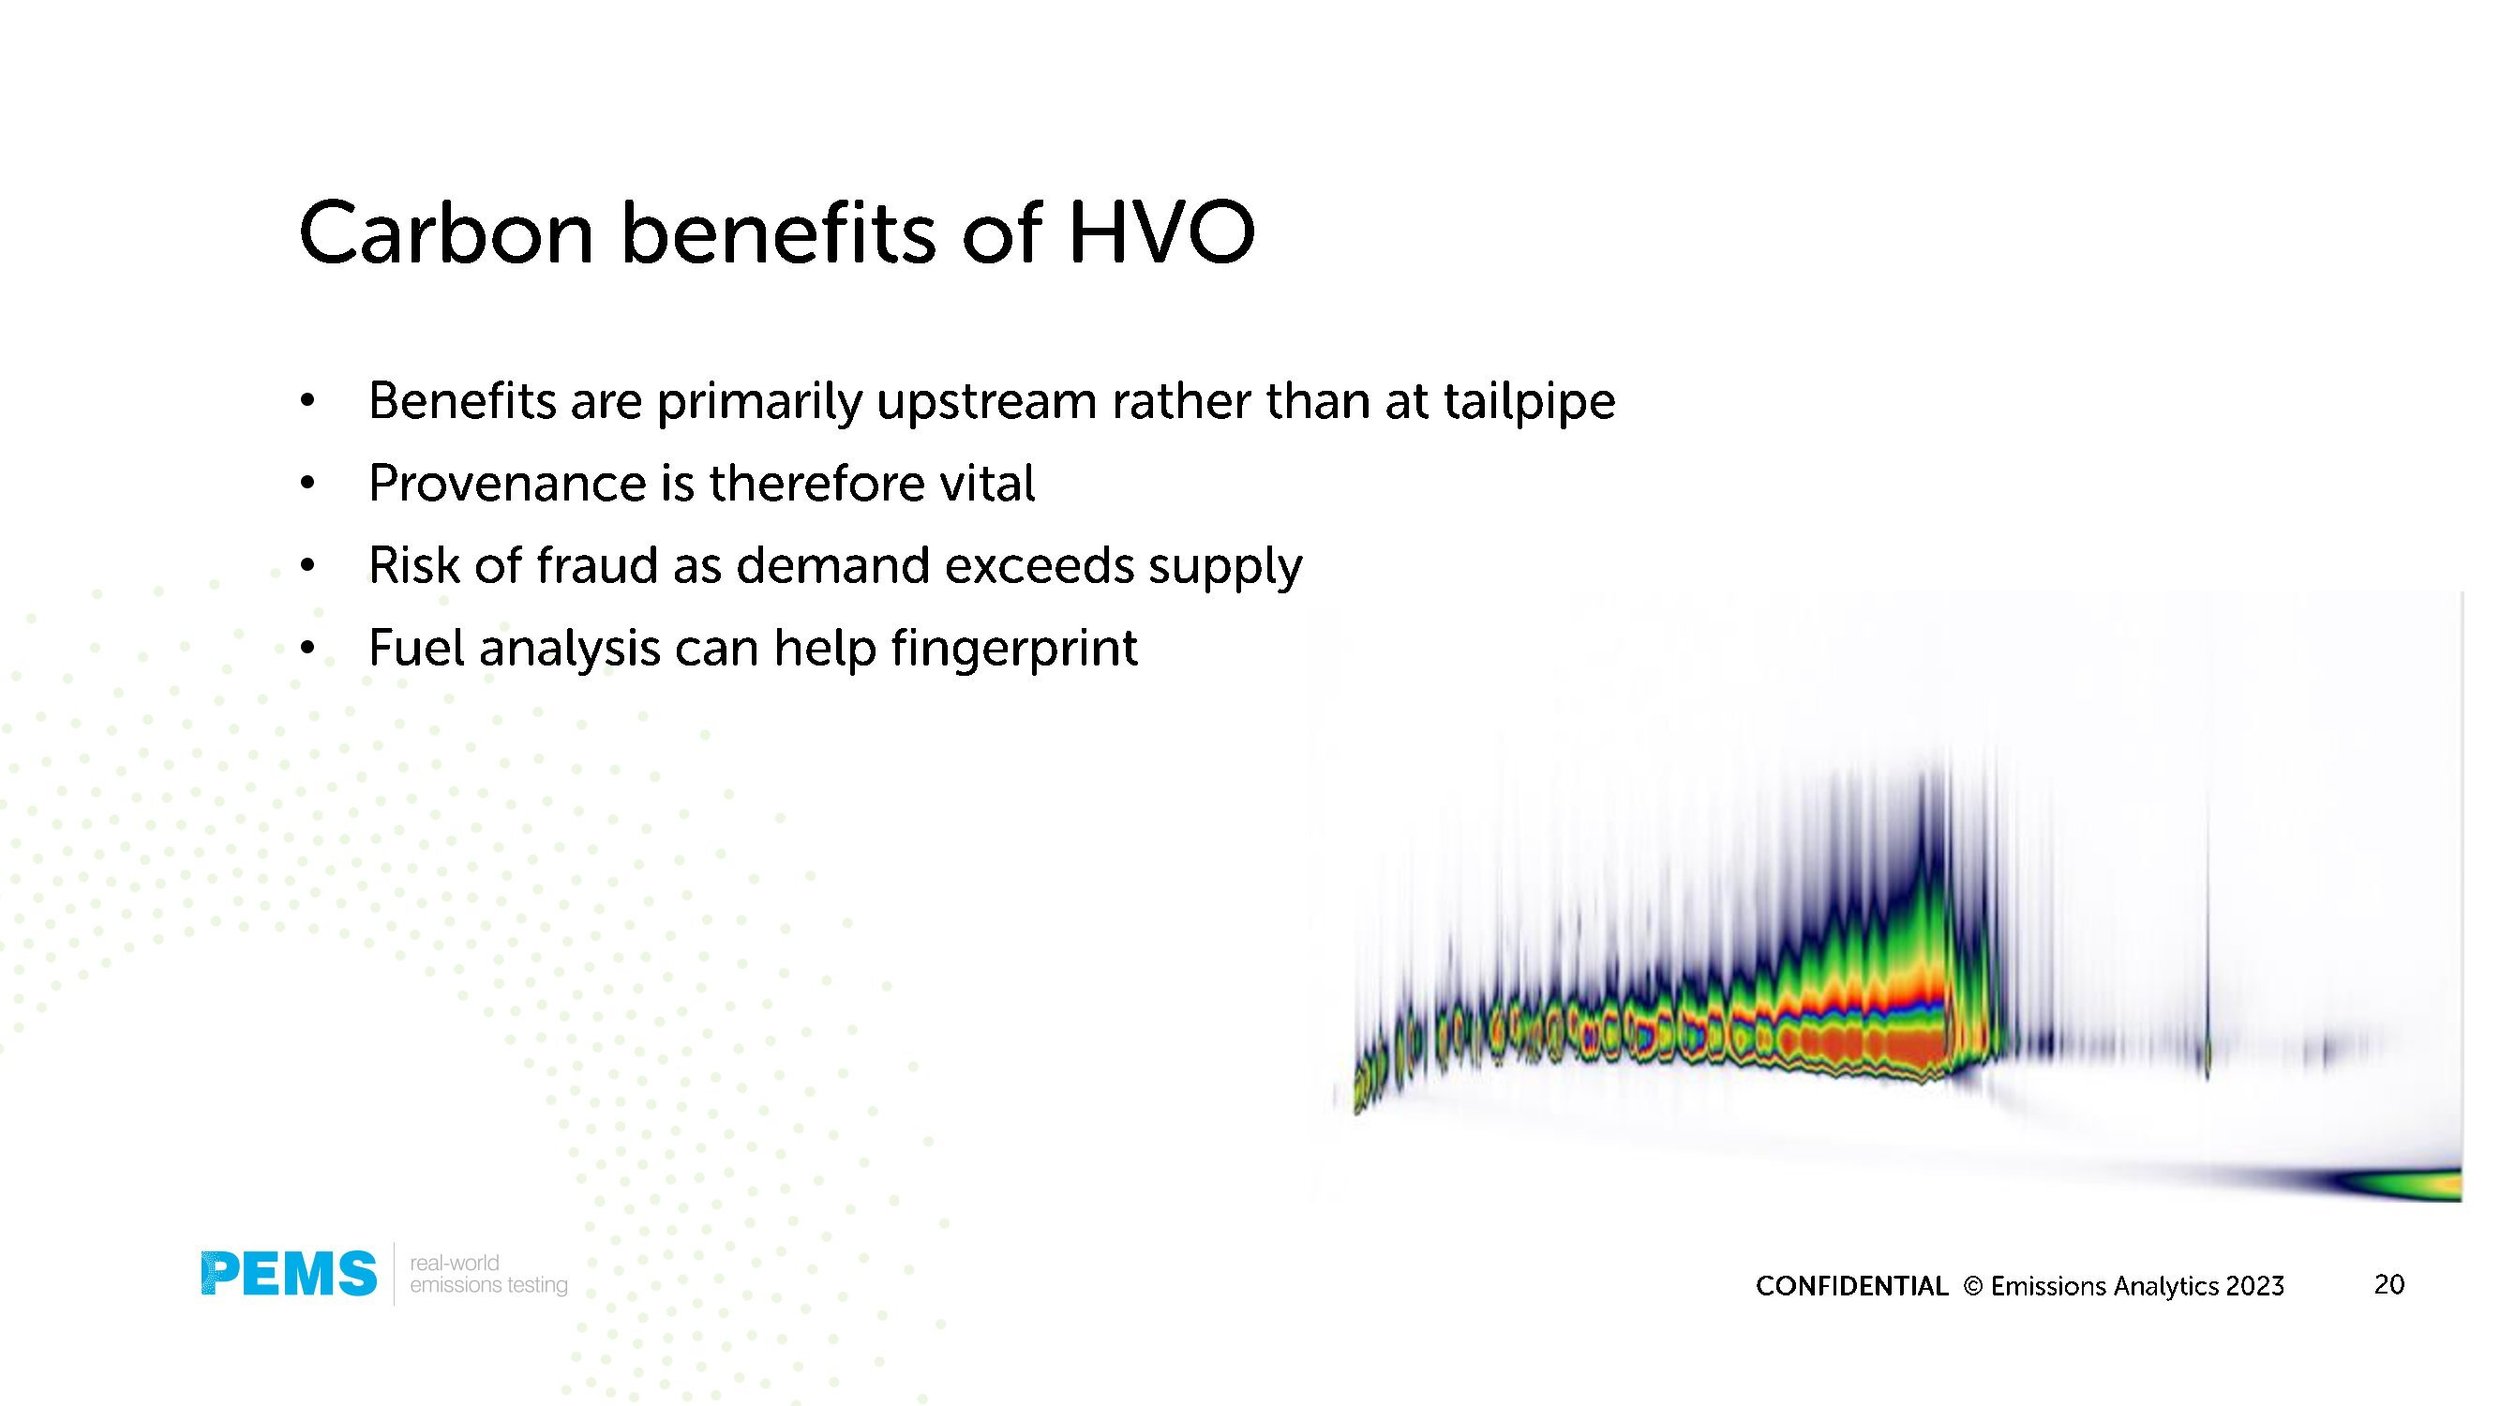
Profiling the organic compounds in fuels
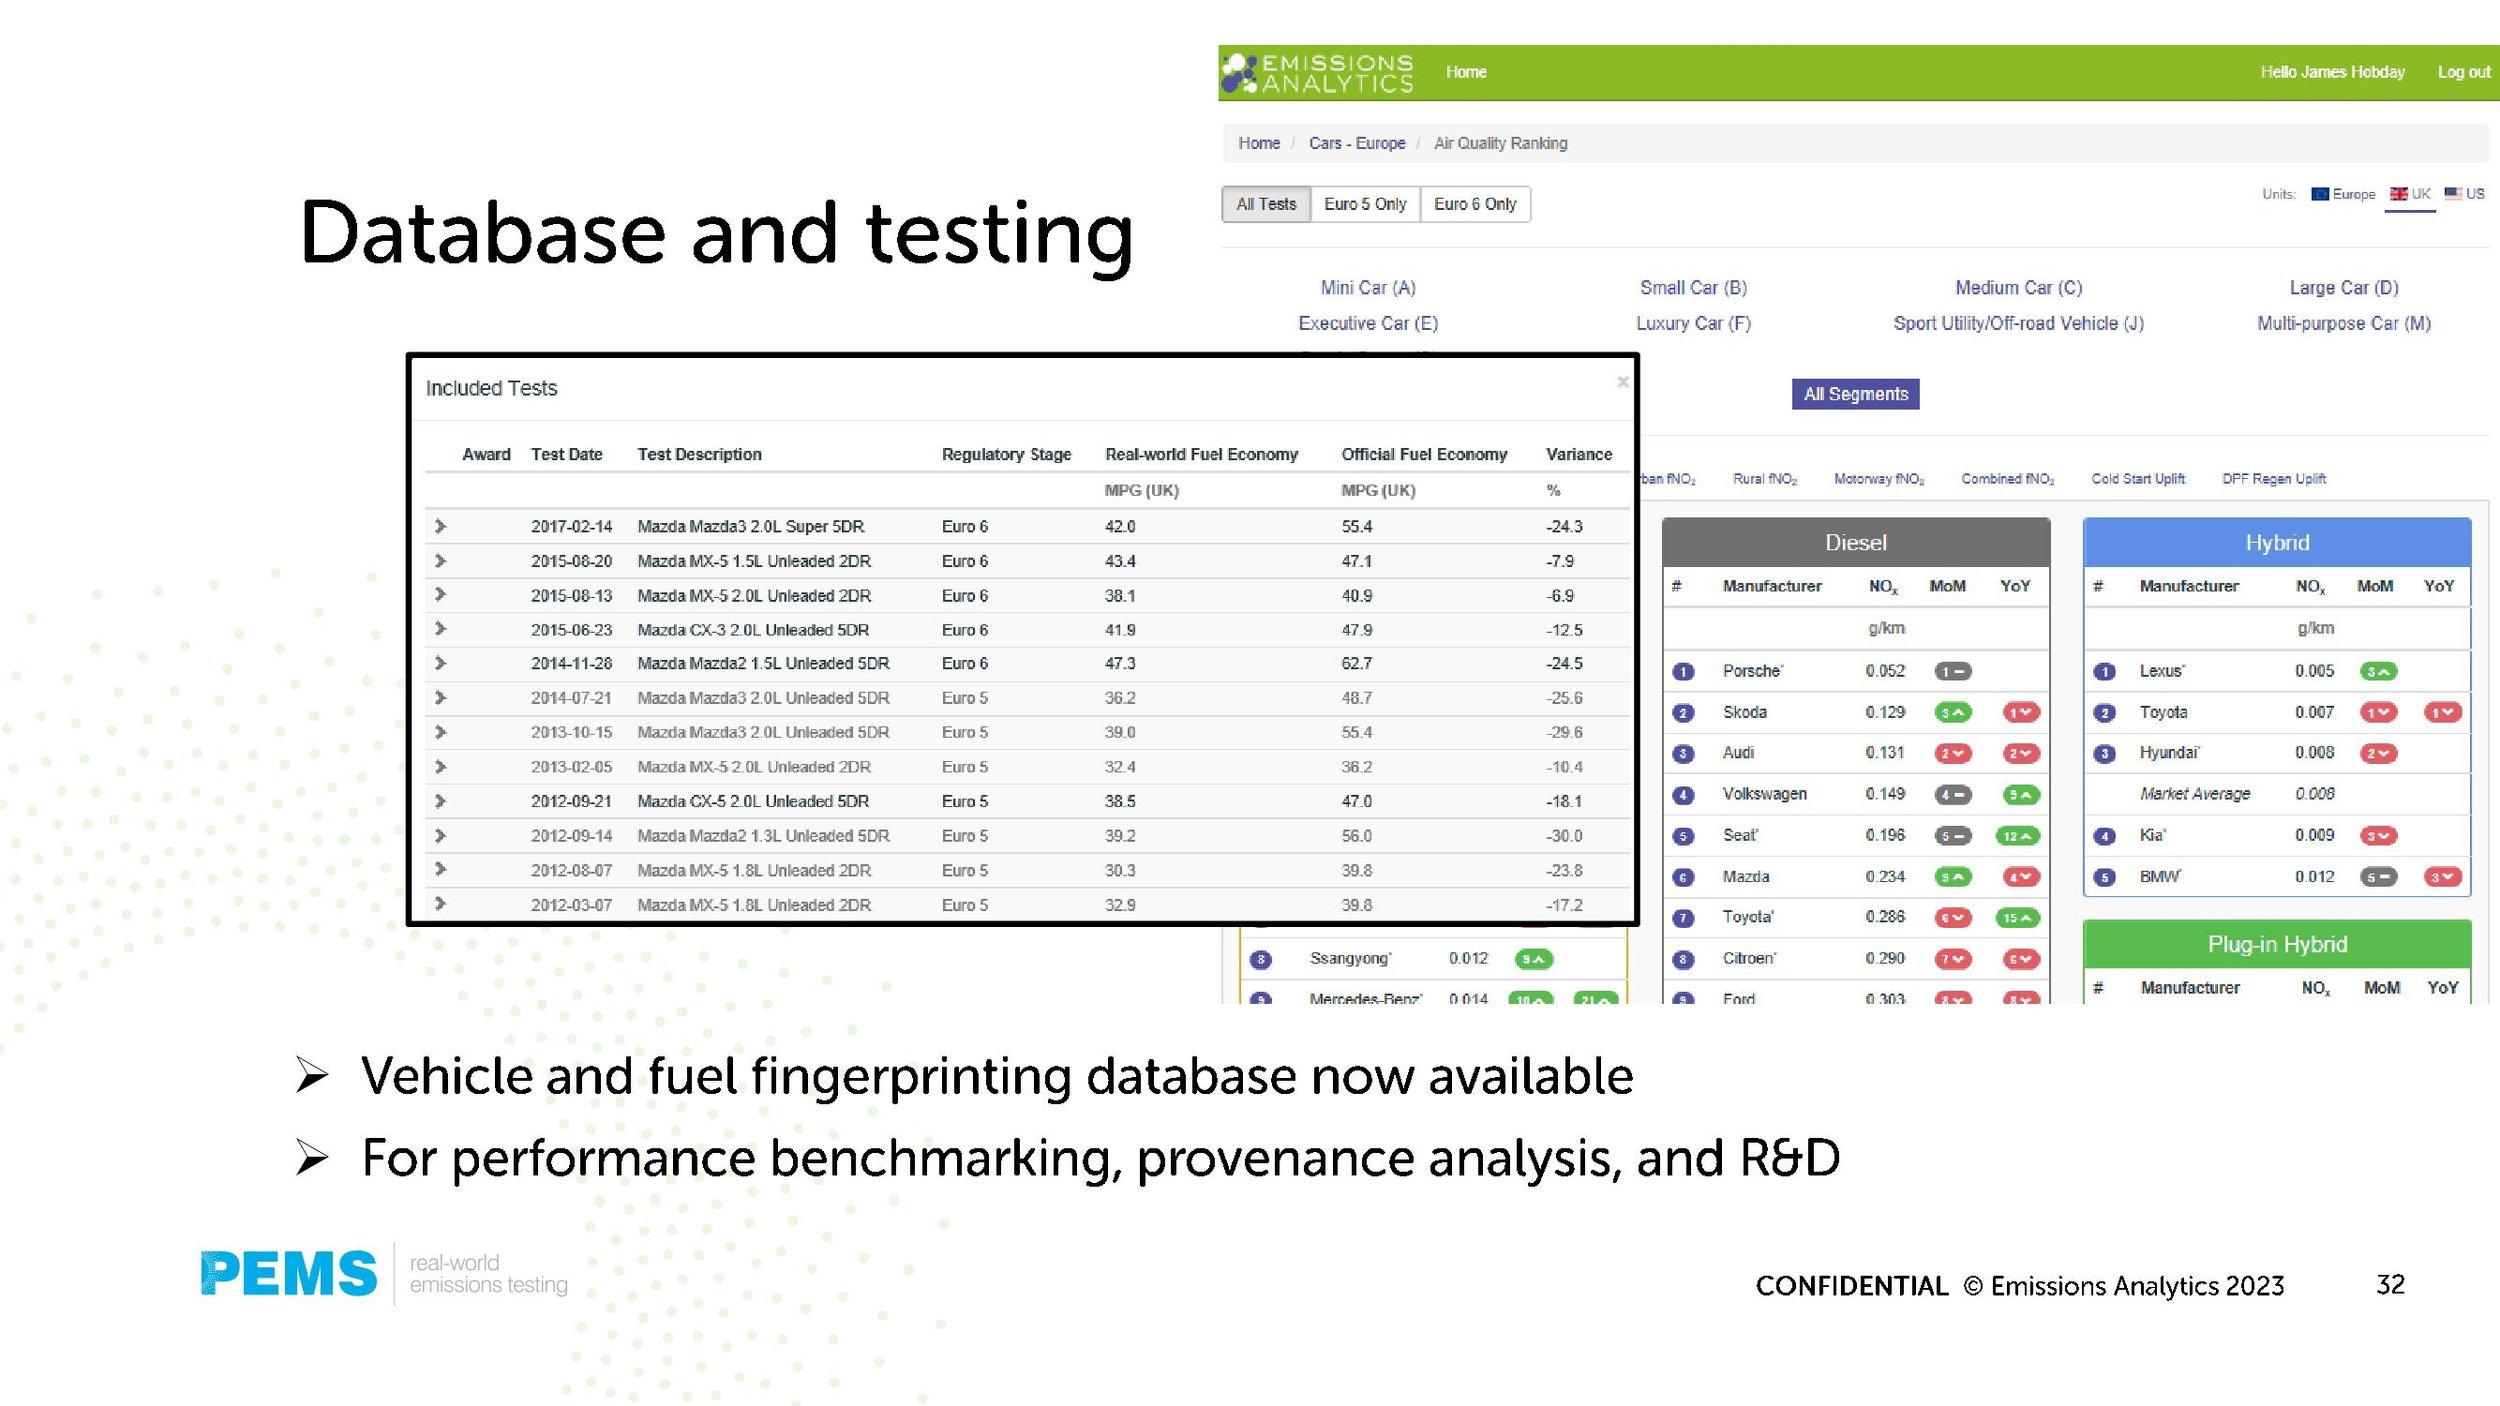
Using this information as a fingerprint to understand provenance
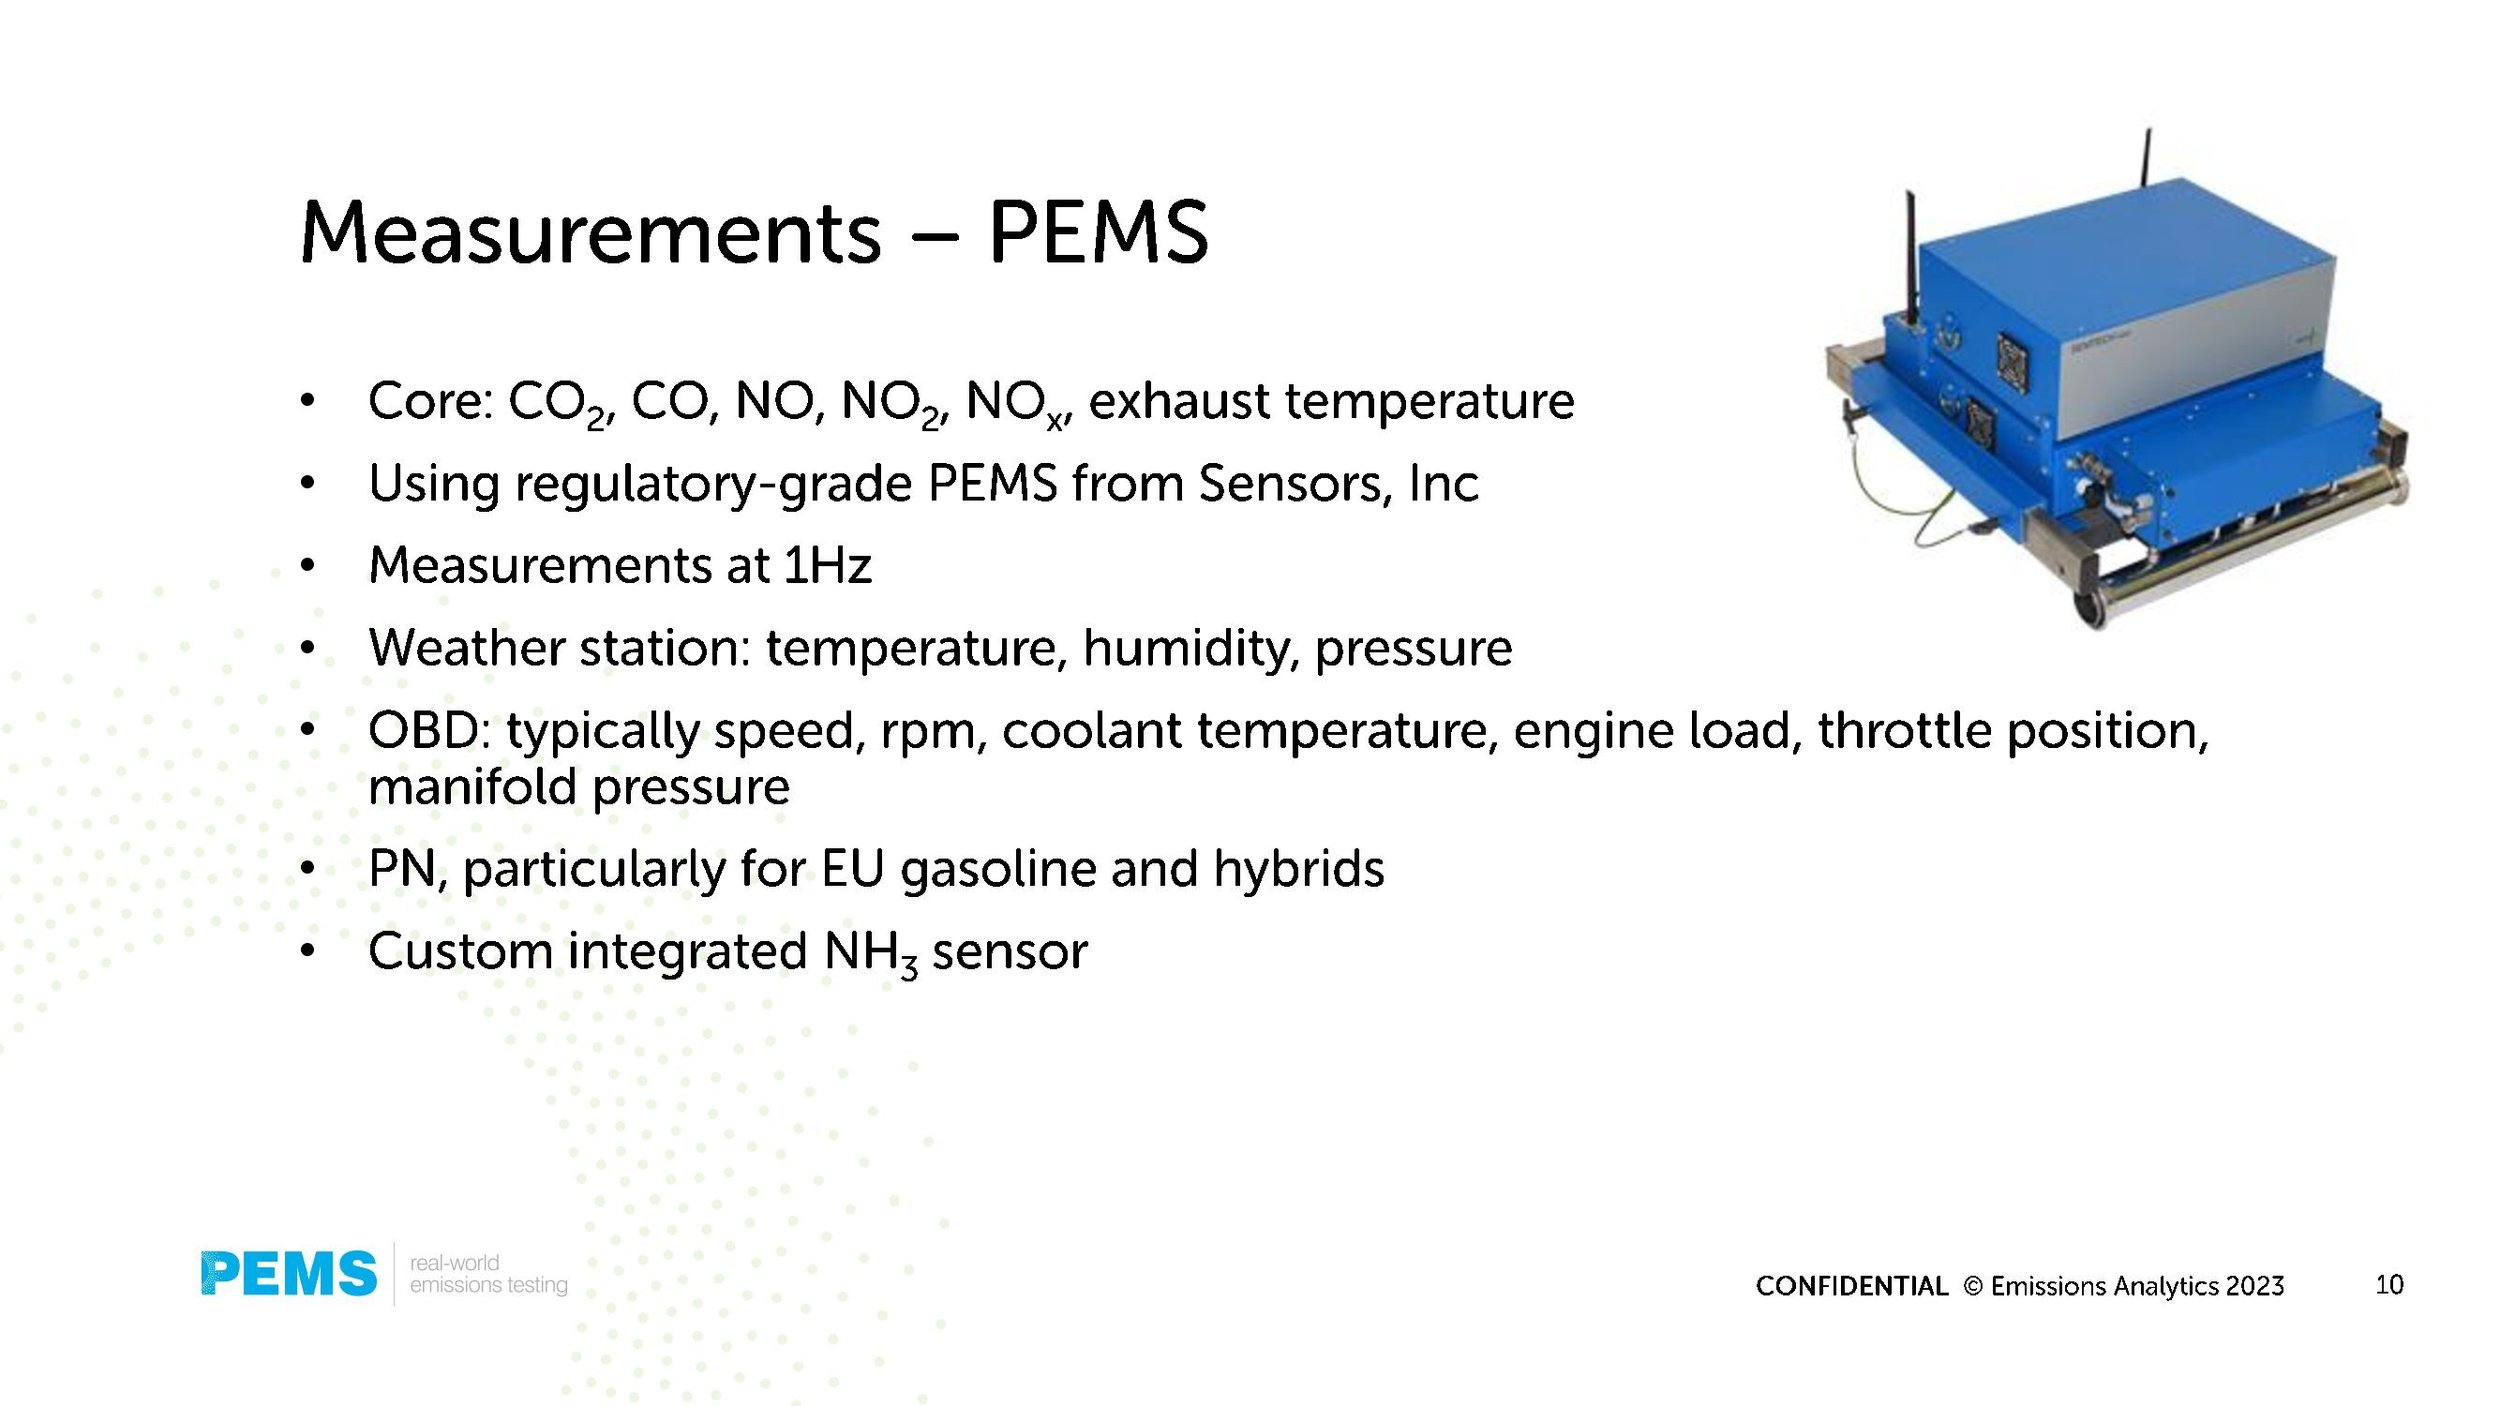
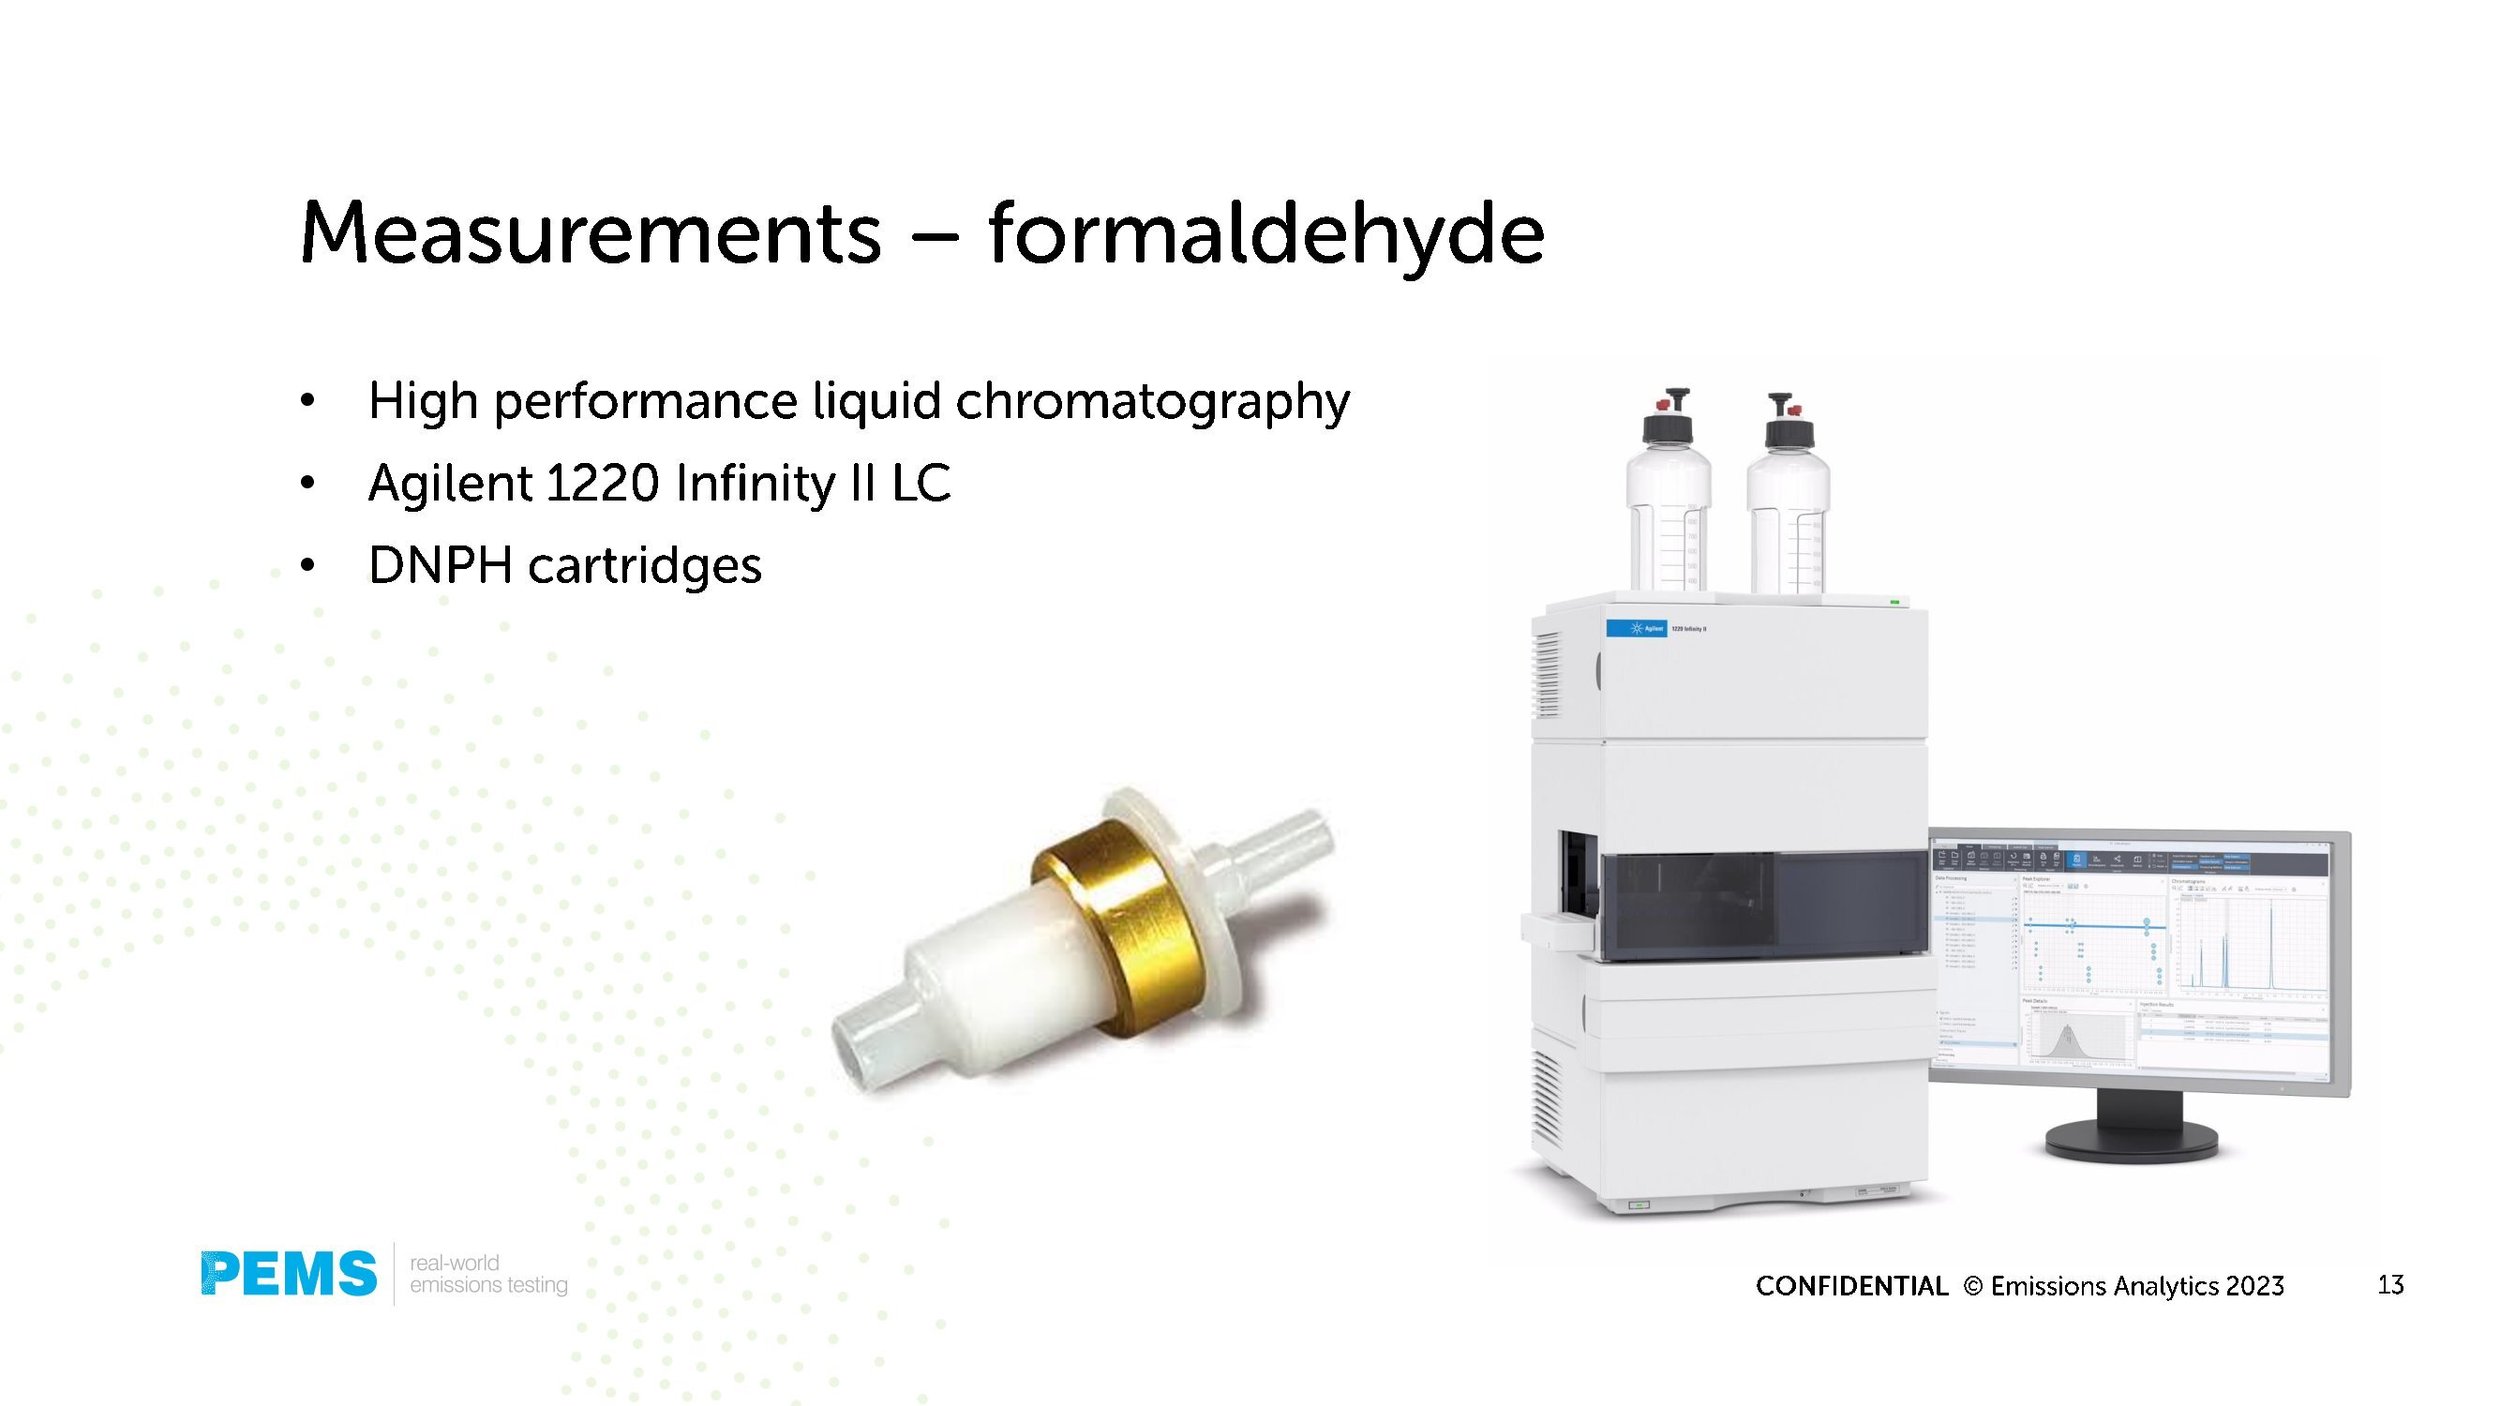
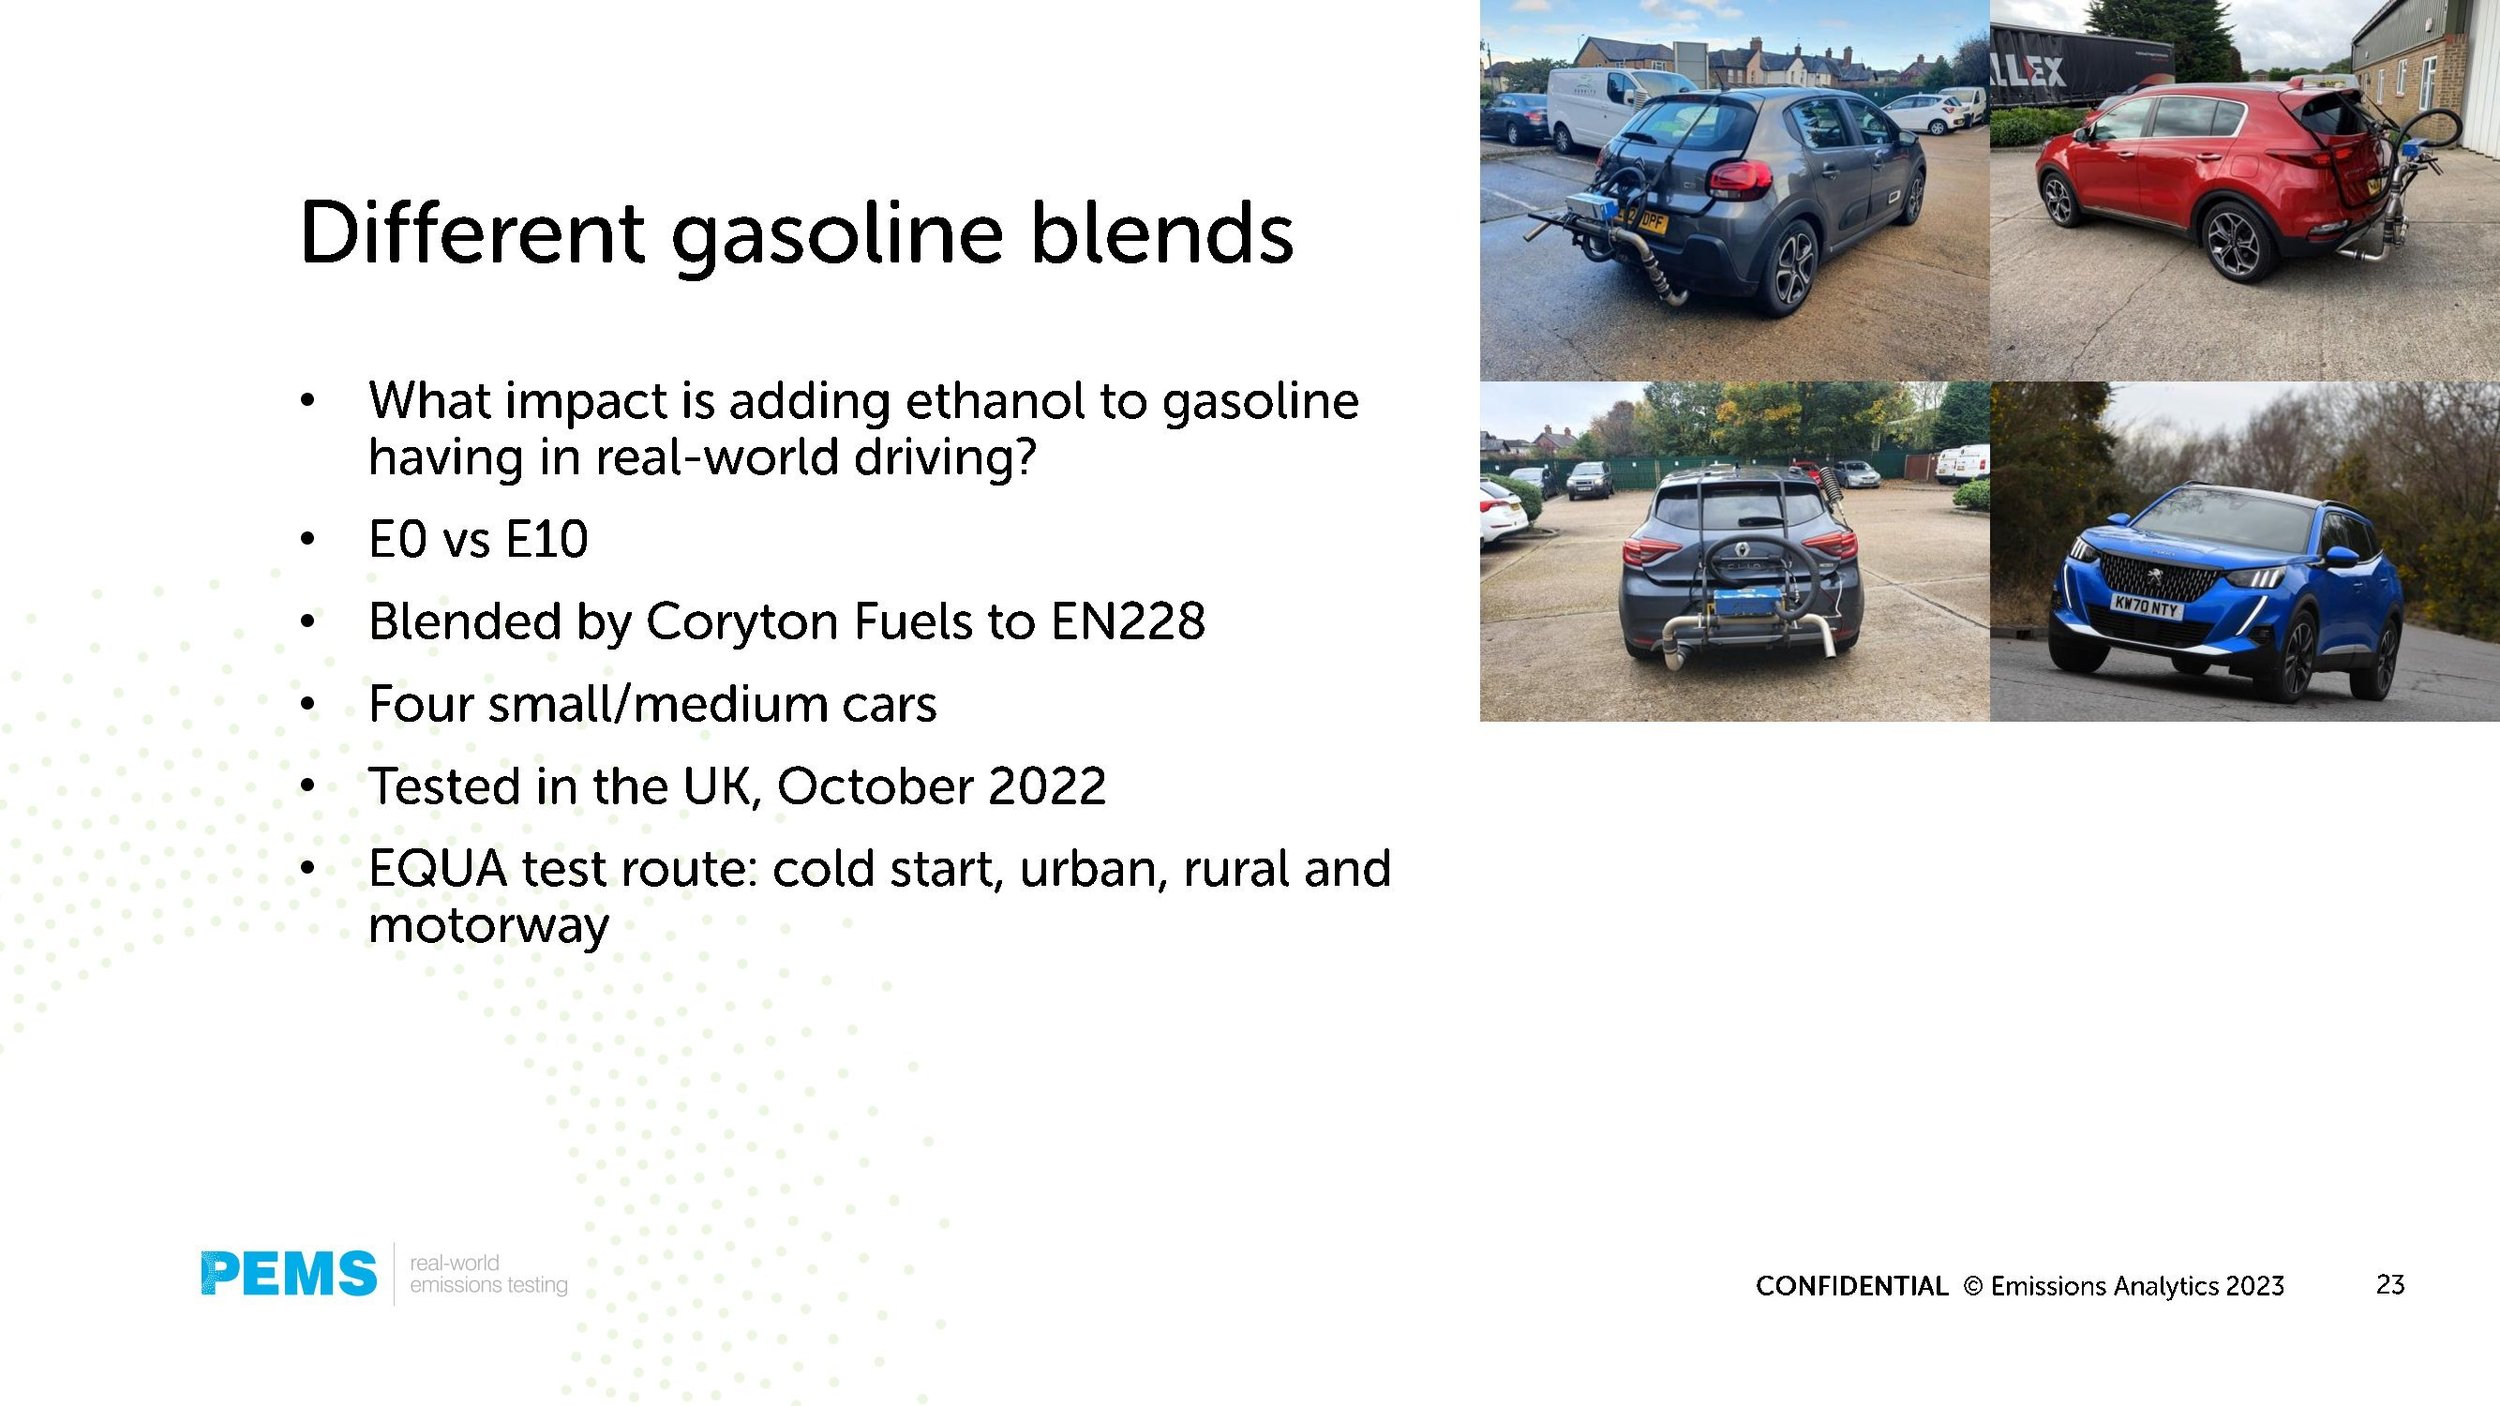
Measuring speciated organic compounds from the tailpipe in real-world driving
Results from the latest on- and off-road testing
Relationships between the chemical composition of fuel and exhaust pollutants


Can hybrid electric vehicles beat diesels on mpg?
Hybrids have always had a miles-per-gallon advantage in urban driving but new EQUA Index data shows that they are gaining on diesels in motoway or highway driving and, if current trends persist, hybrid electric vehicles (excluding plug-in hybrid electric vehicles) are set to take the lead in 2017.
Hybrids have always had a miles-per-gallon advantage in urban driving but new EQUA Index data shows that they are gaining on diesels in motoway or highway driving and, if current trends persist, hybrid electric vehicles (excluding plug-in hybrid electric vehicles) are set to take the lead in 2017.

The dotted trend lines in the above graph, representing motorway mpg for diesel vehicles and gasoline hybrids tested by Emissions Analytics, are converging. While the downturn in diesel mpg may be due to a change in manufacturers’ focus from fuel economy to NOx emissions, what is more striking is the improvement in gasoline hybrid performance on the motorway as a result of technological advances.
The step change in technology is even more noticeable when European EQUA data is compared to North American EQUA results. The graph below shows gasoline hybrid performance in the US is particularly impressive on our combined cycles. With this level of fuel economy it seems unlikely that diesel vehicles will ever make a significant impact on market share in the US. With the mpg penalty of some NOx aftertreatment systems, perhaps it was to gain a fuel advantage over hybrids that Volkswagen resorted to using a defeat device when bringing their diesel models to the US market.

Another noticeable effect of the different product mix in the US is the level of carbon monoxide emissions. Both regular gasoline cars and gasoline hybrids have much lower CO emissions than their European equivalents, with regular gasolines 30% lower and gasoline hybrids 64% lower. This is despite the fact that the US have a less strict limit, at 2.1g/km, than the EU’s, 1.0g/km limit.
When we last wrote about hybrid vehicles back in October 2014, we concluded they were delivering “good but not best-in-class fuel economy, but [were] typically the cleanest, and if you are a light-footed, congested town driver, they are ideal.” Two years on hybrids, particularly in the US, have really upped their game. They are still a cleaner drive than a diesel and may soon offer better fuel economy wherever you drive them but heavy-footed drivers should still exercise caution.


EQUA Mpg Index – a media round up
Find here how the press have been reporting the latest EQUA Index powered by Emissions Analytics
To find out how the press have been reporting the latest EQUA Index powered by Emissions Analytics click on the links below.

Has fuel economy started to fall?
Average fuel economy has fallen for the first time since Emissions Analytics began its real-world test programme in 2011.
Average fuel economy has fallen for the first time since Emissions Analytics began its real-world test programme in 2011. Not only that but the ‘gap’ between official figures and our results did not widen last year. The reason for this appears to be intrinsically linked to the introduction of the Euro 6 emissions standards. This newsletter looks to explain what our data is showing and what this means for fuel economy and CO2 targets in the future.
Evident in our recently published infographic, pictured above, fuel economy has dropped by 3.3 mpg in 2015 and the ‘gap’ has shrunk slightly from 21.5% in 2014 to 21.3% in 2015.
The explanation for this change is due to two main factors, around the mix of vehicles tested and the typical performance of the latest diesel engines. As Emissions Analytics tests vehicles around the time they are launched, there is inevitable fluctuation in the types tested, and hence the mix. This was made more notable with the introduction of the Euro 6 emissions regulations for all new vehicles sold from September 2015.
In the run-up to this deadline, the last of the Euro 5 vehicles had a strong bias towards larger, more powerful vehicles, with lower fuel economy. Perhaps manufacturers were concentrating on releasing the Euro 6 versions of their high volume models first, leaving compliance for the lower-selling or harder-to-comply models until the end of the Euro 5 window.
At the same time as this mix effect, 2015 also saw a reduction in the average fuel economy of the Euro 6 diesel cars tested. These were on average 5.4% less fuel efficient than the Euro 6 diesels tested in 2014. This is likely to be due to some combination of the mix of makes and models launched and in many cases the additional fuel requirement of the NOx abatement systems. In contrast, Euro 6 petrol vehicles tested in 2015 saw a 5.8% improvement in fuel economy compared to those tested in 2014 – these vehicles did not have extra NOx after-treatment systems.
This led us to look at whether the conformity factor (ratio of emissions in real-world driving to the regulated emissions level) for Euro 6 NOx was improving over time and what we found was:
Year Conformity Factor
2013 6.7
2014 2.7
2015 3.5
In 2013 we tested just five Euro 6 models, all early adopters of the new technology, which had showed a high average NOx conformity factor, and also a wide spread. In 2014, it appears that well-placed manufacturers brought mainstream Euro 6 models to market with low conformity factors averaging just 2.7. By 1 September 2015, all models had to be Euro 6 compliant, so included model less well optimised after-treatment systems, perhaps driving the average conformity factor back up.
What can also be seen, however, is that the recently upheld Real Driving Emissions NOx Conformity Factor of 2.1 from 2017 is readily achievable for many, with 29% of models already meeting this level in real-world driving, according to Emissions Analytics’ database.

Round up of average fuel economy for 2015
Round up of average fuel economy for 2015 - Infographic


Average fuel economy is a reflection of the cars we drive
Average fuel economy is a reflection of the cars we drive - Infographic


Air-con on in the sun?
In the knowledge that the readership of this newsletter extends far beyond those of us expecting a traditionally wet British summer, this issue looks at air conditioning and its impact on fuel economy.
In the knowledge that the readership of this newsletter extends far beyond those of us expecting a traditionally wet British summer, this issue looks at air conditioning and its impact on fuel economy.
From our test centre in Los Angeles, where they are lucky enough to need air conditioning most of the year, we test elements of the cycle twice; once with the air conditioning switched on, and again with it switched off. We have looked at the data from over 100 passenger cars and this is what we have found.
With the air-con fully on there is a larger effect on MPG in the city (-5.4%) than in highway driving (-2.7%).
When you look at the data in more detail the effect of air-con on fully on MPG, by fuel type and cycle shows some noticeable differences:
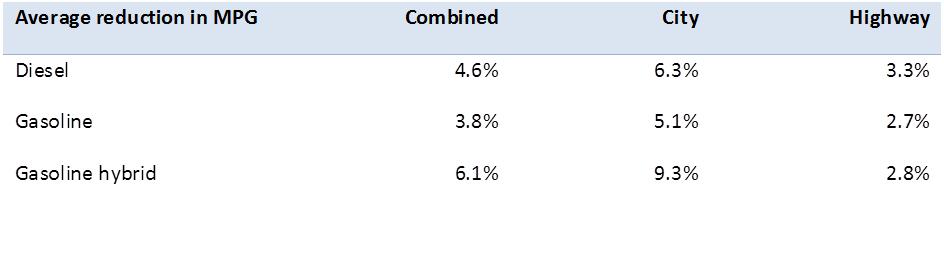
Hybrids suffer a significant reduction in fuel economy with the air-con on in cities, so if you drive one of these it is perhaps better to wind down the windows in town as the aerodynamic penalty may be less.
And when you look at the spread of values in the table below, you can see the effect of air-con differs quite a lot from vehicle to vehicle. So if you live in a hot country and are thinking of buying a car, it pays to investigate your options.

The average effect of air-con on MPG on passenger cars tested in the US is -4%, which equates to 14 g/km of CO2. The average CO2 emissions of our real-world tests in the UK is 160g/km. Thus if the air-con has the same load on a European car then the effect would be an 8% reduction in MPG. However, it’s raining as I write this so perhaps not overly worrying for us Brits!

Revealed: Annual MPG Report Card
Real-world fuel economy hardly growing
Real-world fuel economy hardly growing
Evidence from our large-scale test programme of passenger cars in Europe reveals the difference between the official fuel economy figures for new cars and their real-world results is continuing to grow.
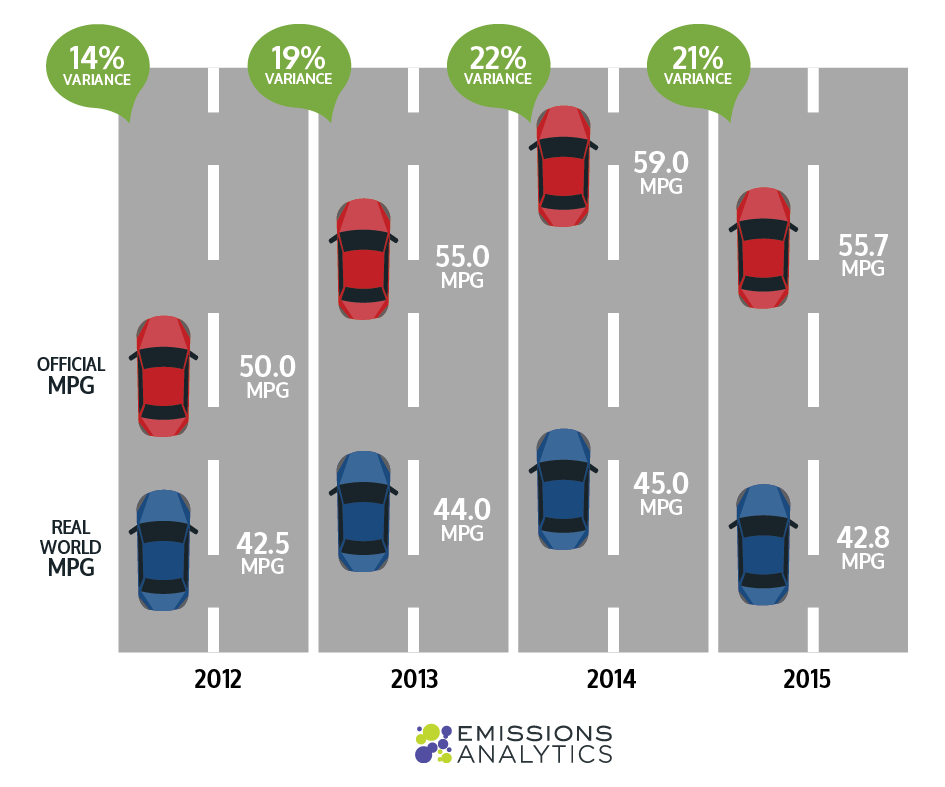
The latest examination of our data shows that the gap between the combined New European Driving Cycle figures and our real-world results has grown to 24%. This is a dramatic increase from the 16% average variance we first recorded in 2012, and shows the degree to which official figures distort the true picture of vehicle efficiency (dotted green line on graph below).
What this means is that, in real terms, the fuel economy motorists can expect from their new vehicles is hardly growing, just 2mpg over the last three years (blue line), yet the official figures show a marked improvement (red line). While it is true that vehicles went through a phase of significant efficiency improvement in the past, these new results suggest progress in this area has now stalled.

The bigger picture
As older cars are replaced by their owners with newer models, fuel consumption and CO2 outputs should fall. However, if drivers switch from larger engines to smaller vehicles this improvement tends to be counteracted. In an earlier newsletter we described how the efficiency gap is greater for smaller-engined vehicles, and particularly downsized engines in larger cars. The very smallest cars are on average 36% below their advertised MPG.
In addition, any backlash against ‘dirty diesels’ may further work against greenhouse gas reductions if consumers switch back to the higher CO2 gasoline vehicles, despite the fact that the industry narrative and public perception about diesels may be lagging reality. We are seeing that the latest Euro 6 diesels are significantly lower in NOx and particulates as discussed in last month’s newsletter.
The overall effect of these factors is potentially to constrain the UK’s ability to meet its greenhouse gas targets, and to cost the consumer more at the pump.
EA has launched a new service for tracking and benchmarking MPG performance. It provides access to our database from high-level trends to detailed results from individual tests. Find out more.
The data we collect is used to populate What Car’s True MPG consumer website. For more information on which vehicles perform best and worst visit their site.

Official MPG growth (red) compared to real on-road growth (blue)
Official MPG growth (red) compared to real on-road growth (blue) Infographic


Beware the danger of downsizing
The old adage that good things come in small packages is not necessarily true in the automotive sector, at least not when it comes to engine size.
The old adage that good things come in small packages is not necessarily true in the automotive sector, at least not when it comes to engine size.
Looking at the data in the table below, based on real-world tests from over 500 model variants, it can be seen that engines under one litre have the greatest variance from their official figures. As well as achieving 36% less than you expect in terms of fuel economy, you will only achieve 3mpg more than the average of all the cars we’ve tested, which includes thirsty performance cars.
For maximum fuel economy you should look for a 1-3 litre engine, as these will return around 45-46mpg. And, to avoid being too disappointed with the result, pick a 2-3 litre vehicle as it will be only 15% worse than you were told you could achieve.

To understand why these ‘eco’ engines perform so poorly on the road, it’s necessary to look at the miles per gallon penalty of accelerating.

The graph shows that the smaller the engine, the larger the penalty acceleration has on mpg. And because the NEDC test has relatively few episodes of acceleration and those that it does have are of a gentle nature, these small engines appear to perform well and receive a high mpg result. That is, until they are taken on the road and driven by real drivers when every rev suddenly burns through the fuel.
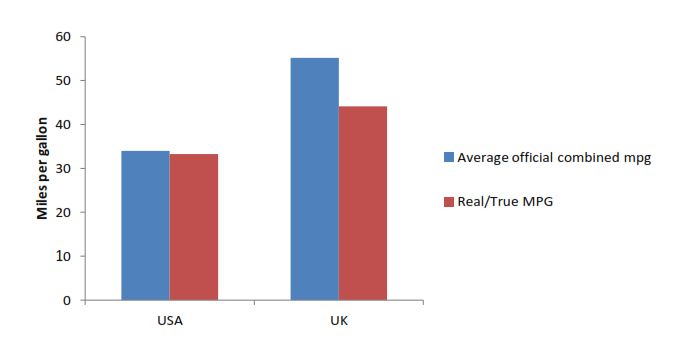
Now contrast the US data, where the EPA five test cycle contains much harsher boundaries and you can see that although there are large engines and an overall lower average mpg, the variance to the statutory figures is very small. You may not get as much from your tank – average European fuel economy is over 40% better than in the US – but at least you know how much not much is.
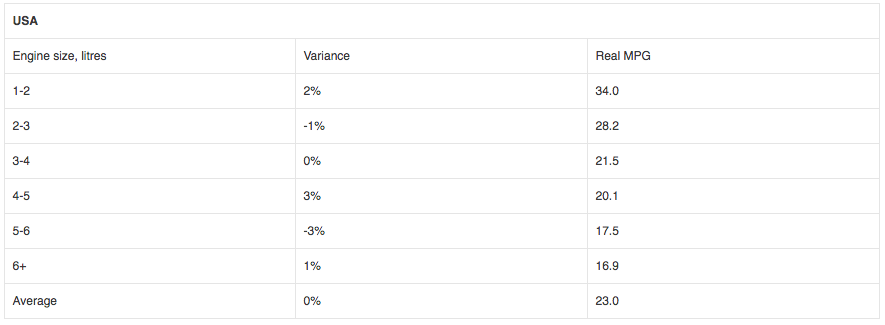
In fact, the US is at a much earlier stage in the trend towards downsizing than Europe, evidenced by the fact that so far we have tested no vehicles in category below 1 litre. Perhaps the more strenuous EPA tests will put a limit on such downsizing – or, at least, downsizing without down-weighting.

Measuring the manufacturers: The EA league table
As promised last month we are going to examine our fuel economy data in more detail, particularly looking at how different manufacturers perform.
As promised last month we are going to examine our fuel economy data in more detail, particularly looking at how different manufacturers perform.
Of the 459 vehicles included in this study, spread across 26 manufacturers, the average real-world mpg by OEM ranges from 31 to 54mpg, with a mean of 44mpg. The deficit from the official figures ranges from 7% to 23%, with the average 22% below NEDC.
The graph, which ranks manufacturers (excluding manufacturers where we have tested fewer than five of their vehicles) according to the extent of their variance from official figures, reveals some interesting observations. Three of the OEMs towards the right of the graph with lower mpg are performance-car-only manufacturers, specifically OEMs 19, 23 and 26. If we exclude these, then the range of real-world mpg shrinks to 40 to 54mpg. By comparison the NEDC figures for these vehicles range from 50 to 63mpg, almost the same spread but 20% higher.
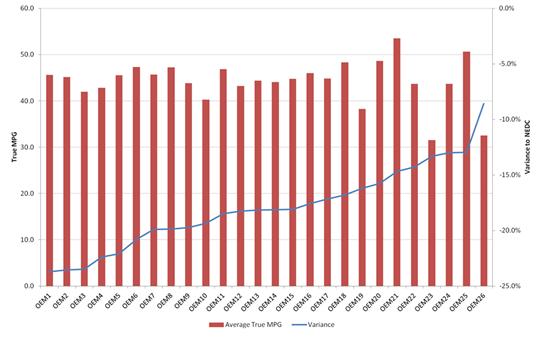
There is then one outlier that does worse than average (OEM 10) and two that are significantly better (OEMs 21 and 25). These manufacturers may have a model range which causes this skewing effect, for instance if they have few big cars in their model mix their average mpg could appear better than other manufacturers. When these three OEMs are also removed from the analysis, the miles per gallon narrows even more from 42 to 49mpg.
So, despite the remaining 20 manufacturers representing a variety of nationalities, technology types and target audiences, their vehicles have surprisingly similar performances in the real world. However, the variance from the official figures still ranges from -13% to -24%.
Although I promised to keep this anonymous, I feel confident that the top performer won’t mind being mentioned. Therefore, I can reveal that OEM 26, which has the smallest variance from the official combined mpg, is Porsche. It also has the second lowest absolute performance, perhaps not surprising given its model line up.
Our consultancy service allows OEMs to see their vehicles in direct relation to their competitors. Contact us if you would like to find out more.

Do we still need to mind the MPG gap?
The gap between official miles per gallon and real world mpg has grown to 22%. This is up 5% since we first started testing fuel economy almost three years ago.
The gap between official miles per gallon and real world mpg has grown to 22%. This is up 5% since we first started testing fuel economy almost three years ago.
The average official combined miles per gallon of the 459 passenger cars we have tested is 57 and this is increasing by approximately 1.7 mpg per year. Real world miles per gallon (TMPG) on the other hand, which averages 44 mpg, remains flat thus causing an increase in the gap of about two percentage points each year as can be seen in the graph below.

MPG vs. Engine size
The graph below shows that broadly speaking the gap grows as the engine size reduces. If you buy a five litre car you will not get great mpg but at least it will be consistent with the salesman’s patter and most likely your expectations. However, if you are shopping for a frugal run-around you are better off looking at the one to three litre engines which give the best absolute performance as well as a lower divergence from official figures than the super minis.

Fuel economy by engine type
Our data also shows that petrol engines, as expected, have worse fuel economy than diesels but interestingly the gap to official is also larger. And, manuals return a better fuel economy than automatics but automatics have a smaller gap between official and real-world figures.

More MPG
We’ll be looking at MPG in more detail in next month’s newsletter, including an analysis of the manufacturer leader board. The published results will be anonymised but OEMs are welcome to email me if they would like to find out how they sit within the table.
* The original Transport & Environment report Mind The Gap can be found here

Do eco tyres really save you money?
Preliminary tests have shown that ratings on tyre labels are not telling the full story. At mid-range speeds, an F-rated tyre performs as well as a B-rated tyre for fuel economy.
Preliminary tests have shown that ratings on tyre labels are not telling the full story. At mid-range speeds, an F-rated tyre performs as well as a B-rated tyre for fuel economy.
We tested two contrasting sets of 175/70 R14 tyres on the road. One set was a standard tyre with B-rating for fuel economy and the other had an F-rating. The test route incorporated a range of steady-state speeds from 40mph to 70mph on tarmac in consistent ambient temperatures.
The B rated tyre was superior in the 40-70 mph range by an average of 3.8% mpg and 3.4% less CO2. There isn’t much in it at the mid-range speed but a performance gap opens up at 55mph and by the time you get to 70mph the fuel economy has improved by 12.9%.
Thus a consumer buying B rated tyres is unlikely to notice a fuel economy benefit if the journeys they customarily make are mainly urban. Whereas a consumer heading up and down the motorway each day should enjoy an improvement.
Now this was an unashamedly quick and dirty investigation but it does demonstrate that the relationship between rolling resistance and fuel economy is not linear and that to bring real improvements to the way tyres are bought and sold manufacturers need to adopt more sophisticated models.
The current tyre labelling system, made mandatory by the EU in November 2012, is not working. In a report compiled by the National Tyre Distributors Association (NTDA) and LANXESS, the manufacturers of high-tech rubber for tyres, it was found that one year on 93% of tyre retailers said customers never or only occasionally requested information on the label and only 30% knew that tyres affect fuel consumption.
We think manufacturers need better models to translate rolling resistance calculations into fuel economy effects. Improved, independently verified testing and labelling, perhaps with a monetary quantification of the typical benefit would provide a tangible benefit that the consumer would welcome.

Speed Demonisation
Changing speed limits on the UK’s roads is hardly out of the news at the moment. For instance, various London boroughs, including Camden and Islington, have recently announced a reduction in the speed limit from 30mph to 20mph to improve road safety. In 2011, the government briefly toyed with the idea of increasing motorway speed limits from 70mph to 80mph.
Changing speed limits on the UK’s roads is hardly out of the news at the moment. For instance, various London boroughs, including Camden and Islington, have recently announced a reduction in the speed limit from 30mph to 20mph to improve road safety. In 2011, the government briefly toyed with the idea of increasing motorway speed limits from 70mph to 80mph. Now they are looking at the possibility of reducing sections of the network to 60mph to alleviate congestion.
Although the Highways Agency politely declined our offer to provide data on the effect of speed on fuel economy and emissions for their M1 consultation, I have decided to share it with you instead as I think it makes for interesting reading.
Every car has an optimum speed for maximum fuel efficiency but what is the range between models and what difference does it make? By mining our data, gathered during tests on more than 500 passenger cars, we decided to find out.
The table below shows that the average optimum speed for the top five selling cars in the UK (2011) is 46mph over an 8mph range.
You can also see that for these same vehicles a reduction in speed from 70mph to 60mph improves fuel economy by an average of 22%, but this varies from 15% on the Ford Focus 1.6 petrol and VW Golf 1.6 diesel to 34% on the Vauxhall Corsa 1.3 diesel.

In a separate study we looked at the effect of reducing the speed limit from 30mph to 20mph and while this reduced CO2 emissions, the impact on CO2, NOx and particulates, due to changes in driving style, warrants further investigation.
While reducing speed may deliver one objective it can have a number of knock-on effects; every car has an optimum speed, 60mph is better than 70mph for fuel economy but 20mph is not necessarily better than 30mph for all tailpipe emissions. Factor in other considerations such as air quality, congestion and road safety and the picture becomes even more complex. What can be concluded however, is that robust data should be the cornerstone of any proposed changes to the rules of our roads.
Sign up here to receive this newsletter
Archive
- AIR Alliance 3
- Air Quality 38
- Audio 3
- Climate Change 14
- EQUA Index 21
- Electrified Vehicles 28
- Euro 7 3
- Fuel Consumption/Economy 20
- Fuels 4
- Infographic 18
- Media 4
- NRMM/Off-road 3
- Newsletter 103
- Podcast 7
- Presentation/Webinar 18
- Press Release 19
- Regulation 16
- Reports 4
- Tailpipe Emissions 49
- Tyre Consortium 2
- Tyre Emissions 26
- Vehicle Interior 6