

Cargo weighs heavily for some LCVs
You may remember back in February we announced we were going to extend our test programme to include light commercial vehicles.
You may remember back in February we announced we were going to extend our test programme to include light commercial vehicles. Well, testing has been underway for the last few months and we have found that fuel economy and nitrogen oxide (NOx) emissions vary considerably depending on whether or not vehicles are fully laden. Our sample is currently small, but we wanted to share some early results.
A van used for work is rarely empty so unlike the official tests, our cycle is repeated twice, first empty and then again at 100% payload. We have tested a number of the most popular Euro 5 vans on the road today and the average impact on fuel economy and NOx by manufacturer when driven fully laden can be seen on the graph below.

Across all vans we have tested, NOx levels are 5.9 times the Euro 5 limit of 180 mg/km when tested empty on our real-world route. Fill these vehicles to 100% of their individual payloads and this ‘exceedance factor’ increases to 12.2 times the legislated limit. However, the impact of load varies from vehicle to vehicle. For instance, Volkswagen produces the cleanest van for NOxwhen empty and despite a 225% increase when full, this vehicle is still the cleanest we have seen. The Ford vans, on the other hand, are higher than the Volkswagen unladen (7.1 times the limit) but this barely increases when full (to 7.6 times), leaving them only marginally more emitting than the Volkswagen.
Fuel economy

Like passenger cars, vans deliver a worse fuel economy on the road than during the official NEDC cycle. The average for the vans we have tested is 14% below official MPG figures when tested empty. Fill them up and the average MPG drops to 27% below the NEDC figures. Just like NOx , there is variability between different models. So far, the Renault gets closest of all the vans tested to its official MPG result (2% below), but suffers badly when laden, dropping a further 13%, whereas load has the smallest impact on the Citroen with a 5% penalty.
It is also interesting to note that there is very little variance between urban and extra-urban driving, for example at 50% load. Typically, unladen, extra-urban MPG would be higher than urban, but the increase in rolling resistance means than on average we found MPG at the higher speeds was 2% lower than in urban driving.
Our programme of van testing is on-going and will grow in 2016. The data so far shows – potentially even more so than for cars – that it is vital to match the right van to the right usage. There are very different characteristic performances between the vans tested so far, making the best purchase decision highly dependent on whether it will be used mainly for urban delivery driving, long distance trunking or carrying heaving loads.

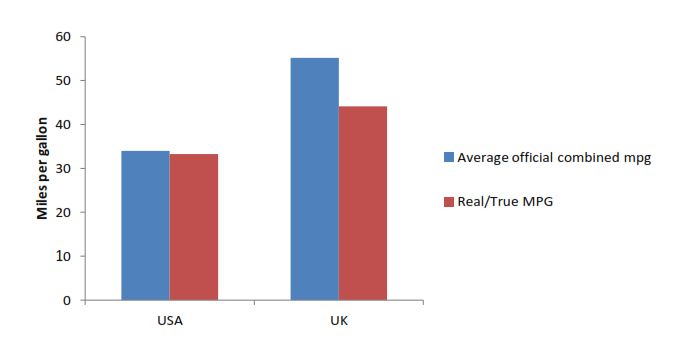
CO2 variance from official results by country
O2 variance from official results by country - Infographic


Real Driving Emissions – How REAL is it?
With the recent Volkswagen scandal focussing the world’s attention on the air quality problems associated with diesel cars, campaigners for clean air have expressed dismay over the EU’s decision not to impose stricter rules for testing new cars on the road.
With the recent Volkswagen scandal focussing the world’s attention on the air quality problems associated with diesel cars, campaigners for clean air have expressed dismay over the EU’s decision not to impose stricter rules for testing new cars on the road. However, Emissions Analytics data shows that full compliance with the Euro 6 limits on oxides of nitrogen (NOx) is already being achieved by some vehicles, and thinks that the industry is on course to clean up dirty diesels.
What is interesting to note from the graph below is that of the 400+ vehicles tested by Emissions Analytics, only one Euro 5 car met the Euro 5 NOx limit, whereas four Euro 6 vehicles have already met the more challenging 0.08g/km Euro 6 regulation. The spread of NOx levels has also reduced in absolute terms with Euro 6, although proportionately the spread is similar to the Euro 5s before them. It is also abundantly clear that the majority of cars we have tested have failed to meet the regulations in real-world driving, with the average NOx levels four times more than they were certified as emitting.

The introduction of a Real Driving Emissions test (RDE) is set to reduce this divergence between laboratory results and real-world driving. Yet the announcement of the Conformity Factors last week, which set the levels of NOx vehicles are permitted to achieve during RDE, have been criticised by many as being too lenient. Our data shows that 36% of Euro 6 diesels have already met the 0.168g/km implied by the 0.08g/km limit plus the Conformity Factor of 2.1 that will come in from 2017 onwards and apply until 2020/1. However, taking into account the test-to-test variability with portable testing, which the Joint Research Centre of the EU recently estimated at up to 30%, manufacturers will need aim for emissions below the 0.168g/km to avoid being caught out during the RDE test. Using that variability number would suggest manufacturers will need to target 0.129g/km. This means that the 0.08g/km limit will be exceeded by around 60% on average in real-world driving. Of the Euro 6 diesels we have tested, 29% already meet this limit, as well as all gasoline cars.
Finally, all models will not need to comply until September 2019, and therefore we conclude that the new regulations as currently proposed will prove easier to achieve than might have been expected, even though some manufacturers and models have a greater task than others. As ever, we will be monitoring the situation and will report back with an update soon.

How PEMS works
A Portable Emissions Measurement System (PEMS) is used to measure vehicle emissions on the road rather than in the laboratory. This methodology, soon to be included as part of the official test for new cars, is used by Emissions Analytics to build a detailed database of real-world emissions.
A Portable Emissions Measurement System (PEMS) is used to measure vehicle emissions on the road rather than in the laboratory. This methodology, soon to be included as part of the official test for new cars, is used by Emissions Analytics to build a detailed database of real-world emissions. Data from over 1000 real-world vehicle tests is available via subscription. Contact us for further details


The first 1000 cars we have tested grouped by manufacturer
The first 1000 cars we have tested grouped by manufacturer - Infographic


Consumers being mislead on emissions – with or without illegal acts
We set up Emissions Analytics four years ago to understand the differences in emissions and fuel economy between the laboratory test and real-world driving conditions in Europe and the United States.
We set up Emissions Analytics four years ago to understand the differences in emissions and fuel economy between the laboratory test and real-world driving conditions in Europe and the United States. Over that time, Emissions Analytics has tested over 1000 cars in Europe and the United States, including over 200 European diesel passenger cars, and makes this data commercially available to many parts of the automotive industry to help bring about a better regulatory regime and help rebuild trust between car manufacturers and consumers.
The illegal action of one manufacturer in the United States threw light, in dramatic fashion last week, on a European situation of higher than expected real-world emissions generated wholly or largely through legal activities. Even legal activity, where it gives rise to misleading results, can be enough to cast wrongful doubt on a whole industry. Having robust, independent real-world emissions data that can sort good from bad is the future, and we plan to lead this.
To summarise the facts in the European market, we have found that real-world emissions of the regulated nitrogen oxides are four times above the official level, determined in the laboratory. Real-world emissions of carbon dioxide are almost one-third above that suggested by official figures. For car buyers, this means that fuel economy on average is one quarter worse than advertised. This matters, even if no illegal activity is found. These differences may well be explained by limitations in the official system, rather than through illegality.
Emissions Analytics has been highlighting these issues for some years now, along with many partners who have analysed our results as well as similar data from other sources. In order to make our findings more accessible and useable to the market, we will be launching an independent accreditation initiative, and we invite all interested parties to participate.

Air quality…it’s hotting up
Will 2015 be recognised as a turning point in the campaign for clean air? It certainly has the potential to as there are a number of threads which, if they come together, could determine the future prospects for urban air quality in Europe.
Will 2015 be recognised as a turning point in the campaign for clean air? It certainly has the potential to as there are a number of threads which, if they come together, could determine the future prospects for urban air quality in Europe.
For instance, the second stage of the Euro 6 regulations for passenger cars will come into force from September. All new cars registered will need to meet reduced limits for NOx, albeit still measured on the artificial laboratory New European Driving Cycle (NEDC).
Also, negotiations will come to a head in the EU around the Conformity Factor for the third stage of the Euro 6 regulations. This will see the use of Portable Emissions Measurement Systems (PEMS) becoming mandatory for the first time. Emissions Analytics has argued long for such portable testing in real-world driving, so this is significant progress. However, a high Conformity Factor (the permissible exceedence of the regulated limits) for a long period could limit the effectiveness of the regulation.
Additionally, the UK government must come up with a new air quality plan after its defeat in the Supreme Court. The activist legal group, ClientEarth, accused the government of failing to meet legal limits for air pollution and the Supreme Court found in its favour, instructing the government to draw up a new plan by the end of 2015.
So, let’s take stock of what Emissions Analytics’ real-world test data is telling us on these points.
The second stage of the Euro 6 regulations is likely to reinforce the existing trend of significantly reducing NOx, but there will still be large exceedances over the regulations. Emissions from Euro 6 diesels are on average 0.340 g/km when they should be 0.08g/km, although this is a 54% reduction on the 0.736 g/km from Euro 5. The issue is much less for gasoline vehicles, which are on average 24% below the 0.06g/km limits. However, 22% of vehicles tested by Emissions Analytics did not meet the limit.
Regarding the Conformity Factor at the third stage of Euro 6, there is growing evidence that, in time, a low factor is viable. Across all Euro 5 diesels we tested, just one met the regulated level. So far for Euro 6 four have already met the limit, using a mix of selective catalytic reduction (SCR) and lean NOx trap (LNT) after-treatment systems. There is still much work to do, but the evidence shows that the limits themselves could be met.
A new version of the UK’s air quality plan is being written by the Department for Environment, Food and Rural Affairs and Secretary of State Liz Truss has announced consultation “later this year”. Crucial in our view will be the understanding and modelling of primary NO2 emissions, as this is a major contributor towards roadside pollution yet is not specifically regulated by Euro 6. Emissions Analytics has found that the variation in this fraction of NO2 in NOx between models has also grown, as a result of differences in after-treatment technologies; for Euro 6 diesels it is 17%-80%, where previously is was 27%-70% in Euro 5 models.
To assist the industry in making a success of Euro 6, Emissions Analytics recently launched an online database of its results, which will be updated in real-time as it continues its rolling test programme. We don’t know yet how these important developments will impact urban air quality but we will be tracking it closely.


The impact of cold starts on NOx emissions
The impact of cold starts on NOx emissions - Infographic


Average fuel economy is a reflection of the cars we drive
Average fuel economy is a reflection of the cars we drive - Infographic


Time to decide the car for our 1000th test
Since rigging our first car with PEMS equipment in 2011, we have tested almost 1000 vehicles. To mark this milestone we want you to suggest our 1000th automobile.
Since rigging our first car with PEMS equipment in 2011, we have tested almost 1000 vehicles. To mark this milestone we want you to suggest our 1000th automobile. To give you some ideas we have put together a summary of the best performers, the worst and everything in between. Plus our testers have shared their favourites.
Number of cars tested in UK 672
Number of cars tested in USA 315
Number of diesels tested 402
Number of petrols tested 585
Number of miles driven 96,075
Number of data points recorded 9,450,000
Most miles per gallon 2012 Citroen C3
70.3mpg (UK)
58.6mpg (USA)
4.0l/100km (EU)
Fewest miles per gallon 1968 Plymouth GTX
12.8mpg (UK)
10.7mpg (USA)
22.1l/100km (EU)
Testers’ favourites
Sam Boyle – Dodge Charger SRT (the Hellcat) – “700hp in a family car, what all dads are looking for!”
Steve Hayton – Aston Martin Vantage – “Very cool and the only one to meet its offical mpg in 2014”
Jesus Flores – Audi A7 – “Very sleek interior, amazing drive and great mpg”
Adam Shawford – Jaguar F-type – “It looks amazing and has a soundtrack to match”
Femi Idowu – Mercedes Benz S300 – “Everything you could want in a car, luxurious and classy.”
Chris Conway – VW Golf R – “The TrueMPG is great for the performance and it sounds epic!”
Test#1000 – You decide!
Tell us which car you think we should test, it could be one you think is particularly good on fuel economy, or particularly bad for NOx. It could be a classic or brand new. As long as it’s road-worthy we can test it so get thinking. Suggest a car.
Emissions Analytics is the leading provider of independent on-road emissions data to the automotive secotr. Results from all our tests are available by subscription. Find out more.

Do the benefits of stop-start technology outweigh the irritations?
The principle behind stop-start technology makes sense. Turn off your engine whilst it is not needed, for instance at red traffic lights, and you will save fuel and reduce emissions.
The principle behind stop-start technology makes sense. Turn off your engine whilst it is not needed, for instance at red traffic lights, and you will save fuel and reduce emissions. However, at EA we wanted to know just how much of a difference it really makes and so we mined our database of 900 real on-road tests to find out.
First we looked at the test results from a VW Golf fitted with stop-start technology, crunched the numbers and found it spent 9% of our test idling, or rather in the off-mode. For this fairly typical diesel vehicle, 0.4g of CO2 is saved per second that the engine is switched off. Extrapolate this and, as the table below shows, drivers of this model do see some benefit from having engines equipped with stop-start technology.
During the official New European Drive Cycle (NEDC) the car spends 24% of the time idle. So when we ran our Golf data through this test the resultant fuel efficiency was supposedly even greater.

Admittedly, the analysis above only considers one vehicle and it is still based on a test cycle, albeit our real on-road cycle rather than in the lab. However, earlier this year for Channel 4’s Dispatches programme, EA fitted a data logger to a real driver’s car and tracked it for a week. Data from this real-world experiment showed that this Seat Alhambra spent 8% of its time idling. Very similar to the 9% of time the Golf was in off-mode but a far cry from the 24% anticipated by the official tests.
Interestingly, our data also shows that exhaust temperature drops by about 40% when the engine switches to the off-mode. When the engine re-starts the temperature quickly rises again. However, this can often coincide with a period of acceleration as the vehicle pulls away, which may mean higher NOx emissions. Thus careful thermal management strategies need to be employed by the manufacturers to ensure their exhaust after treatments are still effective against NOxemissions, which is something EA will be studying in more detail in the future.

Stop-start technology is a particularly attractive proposition for manufacturers looking to achieve a high MPG result and low CO2 rating on the NEDC. Drivers will see some benefits, just not as much as published because the NEDC is flattering the result due to its high proportion of stationary time. So, if you can cope with the annoyance factor of having your engine switch off every time you pull up it is worth having.

Air-con on in the sun?
In the knowledge that the readership of this newsletter extends far beyond those of us expecting a traditionally wet British summer, this issue looks at air conditioning and its impact on fuel economy.
In the knowledge that the readership of this newsletter extends far beyond those of us expecting a traditionally wet British summer, this issue looks at air conditioning and its impact on fuel economy.
From our test centre in Los Angeles, where they are lucky enough to need air conditioning most of the year, we test elements of the cycle twice; once with the air conditioning switched on, and again with it switched off. We have looked at the data from over 100 passenger cars and this is what we have found.
With the air-con fully on there is a larger effect on MPG in the city (-5.4%) than in highway driving (-2.7%).
When you look at the data in more detail the effect of air-con on fully on MPG, by fuel type and cycle shows some noticeable differences:
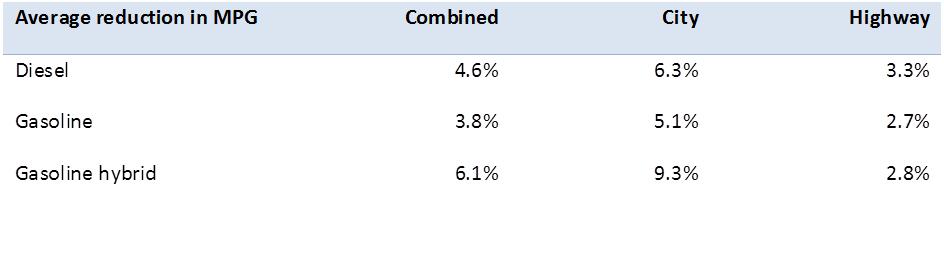
Hybrids suffer a significant reduction in fuel economy with the air-con on in cities, so if you drive one of these it is perhaps better to wind down the windows in town as the aerodynamic penalty may be less.
And when you look at the spread of values in the table below, you can see the effect of air-con differs quite a lot from vehicle to vehicle. So if you live in a hot country and are thinking of buying a car, it pays to investigate your options.

The average effect of air-con on MPG on passenger cars tested in the US is -4%, which equates to 14 g/km of CO2. The average CO2 emissions of our real-world tests in the UK is 160g/km. Thus if the air-con has the same load on a European car then the effect would be an 8% reduction in MPG. However, it’s raining as I write this so perhaps not overly worrying for us Brits!

Revealed: Annual MPG Report Card
Real-world fuel economy hardly growing
Real-world fuel economy hardly growing
Evidence from our large-scale test programme of passenger cars in Europe reveals the difference between the official fuel economy figures for new cars and their real-world results is continuing to grow.
The latest examination of our data shows that the gap between the combined New European Driving Cycle figures and our real-world results has grown to 24%. This is a dramatic increase from the 16% average variance we first recorded in 2012, and shows the degree to which official figures distort the true picture of vehicle efficiency (dotted green line on graph below).
What this means is that, in real terms, the fuel economy motorists can expect from their new vehicles is hardly growing, just 2mpg over the last three years (blue line), yet the official figures show a marked improvement (red line). While it is true that vehicles went through a phase of significant efficiency improvement in the past, these new results suggest progress in this area has now stalled.

The bigger picture
As older cars are replaced by their owners with newer models, fuel consumption and CO2 outputs should fall. However, if drivers switch from larger engines to smaller vehicles this improvement tends to be counteracted. In an earlier newsletter we described how the efficiency gap is greater for smaller-engined vehicles, and particularly downsized engines in larger cars. The very smallest cars are on average 36% below their advertised MPG.
In addition, any backlash against ‘dirty diesels’ may further work against greenhouse gas reductions if consumers switch back to the higher CO2 gasoline vehicles, despite the fact that the industry narrative and public perception about diesels may be lagging reality. We are seeing that the latest Euro 6 diesels are significantly lower in NOx and particulates as discussed in last month’s newsletter.
The overall effect of these factors is potentially to constrain the UK’s ability to meet its greenhouse gas targets, and to cost the consumer more at the pump.
EA has launched a new service for tracking and benchmarking MPG performance. It provides access to our database from high-level trends to detailed results from individual tests. Find out more.
The data we collect is used to populate What Car’s True MPG consumer website. For more information on which vehicles perform best and worst visit their site.

Official MPG growth (red) compared to real on-road growth (blue)
Official MPG growth (red) compared to real on-road growth (blue) Infographic


Growth in the MPG gap since EA started measuring real on-road performance
Growth in the MPG gap since EA started measuring real on-road performance - Inforgraphic


The end of the road for dirty diesels?
We have been listening to the proposals to discourage ‘dirty diesels’ by cities across Europe, and read with interest the statement from the Society of Motor Manufacturers and Traders (SMMT), speaking up in favour of the diesel car. In our opinion, the evidence from real-on-road tests speaks for itself.
We have been listening to the proposals to discourage ‘dirty diesels’ by cities across Europe, and read with interest the statement from the Society of Motor Manufacturers and Traders (SMMT), speaking up in favour of the diesel car. In our opinion, the evidence from real-on-road tests speaks for itself.
Our research shows Euro 5 standard diesels and earlier are indeed ‘dirty’. They produce high levels of NOx which is harmful to human health. Emissions are particularly bad in urban environments because NOx emissions correlate more closely with incidences of acceleration than speed, thus the stop-start nature of city driving exacerbates air pollution. And, it is made worse by the high number of older diesel buses, taxis and delivery vehicles in the urban environment.
To help combat this problem, the legal limit for NOx emissions was reduced to 0.08g/km with the introduction of the Euro 6 standard for passenger cars, effective from September 2014. We tested a number of the earliest Euro 6 diesels on the market and found that they produced levels of NOx which were seven times above the legislated limits. You can read more about it in the ICCT’s 2014 report, to which EA contributed data.
However, our latest tests show that many newer Euro 6 diesels are showing marked improvements, with NOx levels averaging 2.5 times above the legislated limit. In addition, great strides have been made to clean up new buses and the NOx emissions are now very low from many of these vehicles. Another concern with diesels is the emissions of particulates which are linked to heart and lung disease. However, this issue was addressed with the Euro 5 standard which saw the addition of diesel particulate filters to the exhaust system, which has significantly reduced this problem.
Automotive manufacturers have been investing in NOx abatement technologies and strategies in anticipation of the forth-coming legislative changes which will require an element of real on-road testing, known as Real Driving Emissions. In future it will no longer be sufficient to simply pass the test, manufacturers will also have to demonstrate that their vehicles also comply when driven in the real world.
This can only be to the benefit of urban air quality and thus we agree with the SMMT in that a simplistic ‘demonisation’ of new diesels is not correct. In fact, careful attention needs to be paid to other technologies creating emissions increases, such as direct injection gasoline engines. Nevertheless, there are issues with diesels that are not captured by the regulations, for example the proportion of NOx that is emitted as NO2, the more harmful component. Our research shows that this proportion can be as high as 90% in urban driving, much higher than generally acknowledged.
Emissions Analytics has been leading research in these areas, for example with Imperial College London through the Air Pollution Research in London group, to ensure that the clean-up of diesel engines continues to translate into reality.

Weighing the cost of a new van
EA is in the business of improving the quality and availability of data in the automotive sector and so we will soon be introducing on-road testing for light commercial vehicles in the UK, helping consumers make informed decisions about which vehicle to buy with an easy to use miles per gallon calculator.
EA is in the business of improving the quality and availability of data in the automotive sector and so we will soon be introducing on-road testing for light commercial vehicles in the UK, helping consumers make informed decisions about which vehicle to buy with an easy to use miles per gallon calculator.
A major contributing factor to fuel economy for vans and pickup trucks is the load on board. So, in addition to our standard fuel economy test, we will include repeat cycles with the vehicle fully laden at its maximum payload. This will enable the buyer to consider how they expect to use the vehicle and find out what effect this will have on their fuel consumption.
In a 2014 report, the RAC Foundation found that the carriage of equipment, and delivery and collection of goods accounted for 79% of the mileage of light commercial vehicles in the UK. However, this is unquantified in the official tests.
The regulators would argue that testing vans and trucks unladen provides a level playing field, allowing for comparisons between vehicles. Yet in this sector of the market, carrying capacity varies within a CO2 class. The fully laden Ford Transit Courier can carry 112kg (247lb) more than the Vauxhall Corsavan but both record CO2 of 103g/km. In theory they should give the same fuel economy – but only if driven empty!
USA perspective
Although the EPA’s five-cycle test regime produces official figures which, on average, more closely match real-world performance than in Europe, the test still does not account for a fully-loaded vehicle.
Thus the question facing the consumer, who is purchasing a vehicle for its intended purpose, to carry stuff, is the same on both sides of the Atlantic – how much will it really cost to run?
We have been addressing this issue from our Motor Trend test centre in Los Angeles, looking into the impact of variable payload. For example, when we packed the Nissan NV200 with bags of cement increasing its payload to 1132lb (513kg) – its maximum is 1470lb (667kg), and drove it on our 88-mile (142km) city and highway test route, we saw a reduction in fuel economy from 25mpg to 22mpg (US gallons). Read more. Based on the average distance driven of 15,000 miles, that equates to an additional 82 gallons (310l) of fuel per year, which multiplied by the 8 million or so new commercial vehicles registered each year is a lot of extra gas.

Vans and pickups are an increasingly important sector for UK and US drivers, so this data will help us understand their real-world performance. Watch this space for trends and observations as UK testing gets underway in March 2015.

Ploughing ahead with tractor testing
Working with Emissions Analytics, engineering researchers at Harper Adams University have developed a new method to accurately measure the exhaust emissions of agricultural machinery.
Working with Emissions Analytics, engineering researchers at Harper Adams University have developed a new method to accurately measure the exhaust emissions of agricultural machinery.
Traditionally, machines such as tractors are tested in controlled environments such as a soil hall, not taking into account the many variables from real-life scenarios, which result in transient engine loads.
With support from CLAAS and EA, the postgraduate students used PEMS equipment quite literally in the field. Two engine exhaust after treatment systems commonly used by tractors to reduce emissions were tested; a CLAAS Axion 830 with a selective catalytic reduction system and a CLAAS Arion 650 using exhaust gas recirculation combined with a diesel particulate filter.
Both tractors were trialled in three conditions – using a dynamometer to add a variable load to the PTO shaft; road testing at high speed with a fully laden trailer; and in a field with a subsoiler and power harrow. As with road vehicles the CO, CO2, NOx and THC data was combined with vehicle data such as GPS position, engine load and speed.
The project was designed to investigate the differences between theoretical CO2 conversion factors and real-world factors for non-road mobile machinery; and to demonstrate the feasibility of using PEMS equipment for such a task. The results, analysed by Miles Metcalfe with supervision from PhD student Rob Fillingham, were written up for his MEng Agricultual Engineering dissertation for which he was awarded a first class.
Metcalfe demonstrated that the assumed linear relationship between engine load and CO2 conversion factor was in fact better suited to an exponential curve, and that by using the traditional conversion factors supplied by DEFRA, CO2 is in fact being over estimated as there is a significant difference of p<0.001 between the DEFRA value and the PEMS result.
Observations made, such as an increase in CO2 conversion factors whilst the tractor was turning at lower engine speeds or loads at the field’s headlands, show that this innovative collaboration between Emissions Analytics and the agricultural sector has the potential to allow farmers to not only save fuel but reduce damaging emissions by using data gathered from real agricultural practices. And, as regulations change for N-RMM, the power of PEMS to measure compliance is evident.
Archive
- AIR Alliance 3
- Air Quality 38
- Audio 3
- Climate Change 14
- EQUA Index 21
- Electrified Vehicles 28
- Euro 7 3
- Fuel Consumption/Economy 20
- Fuels 4
- Infographic 18
- Media 4
- NRMM/Off-road 3
- Newsletter 103
- Podcast 7
- Presentation/Webinar 18
- Press Release 19
- Regulation 16
- Reports 4
- Tailpipe Emissions 49
- Tyre Consortium 2
- Tyre Emissions 26
- Vehicle Interior 6