
The great public transport squeeze
Public transport, almost by definition, works when it is packed. As demonstrated at the current time, with usage at around three-quarters of pre-pandemic levels, the economics of many parts of public transport are in crisis, not least at Transport for London. A similar pattern is seen with environmental impact: per passenger, a full bus has lower carbon dioxide (CO2), nitrogen oxide (NOx) and particulate emissions than a car; but a near-empty bus is worse. But there is another, less well understood, aspect of public transport regarding the users’ exposure to pollution while travelling, which presents a further challenge to rebuilding these modes. Looking forward, not just do emissions and economics need to be considered, but also the comfort and health of passengers.
To study this, we tested a range of transport modes between central London and Oxford city centre, a distance of approximately 50 miles (80 km) as the crow flies. This project was funded by the TRANSITION Clean Air Network through the first round of its Discovery & Innovation Fund in 2021¹.
The main pollutants of interest for this study were particles – both mass and number – and volatile organic compounds (VOCs). These are likely to be the most problematic pollutants in confined spaces, and this selection mirrors the work on passenger car interior air quality work at the UNECE and CEN Workshop 103². To measure these, we used the V2000 from National Air Quality Testing Services for particles³. For VOCs, samples were collected in thermal desorption tubes – using both passive and active sampling – and then analysed in a two-dimensional gas chromatography system: GCxGC-TOF-MS from SepSolve Analytical and Markes International. Due to limitations in the study, most journeys were undertaken only once and, therefore, more data would be required to understand variability between exposures on different days.
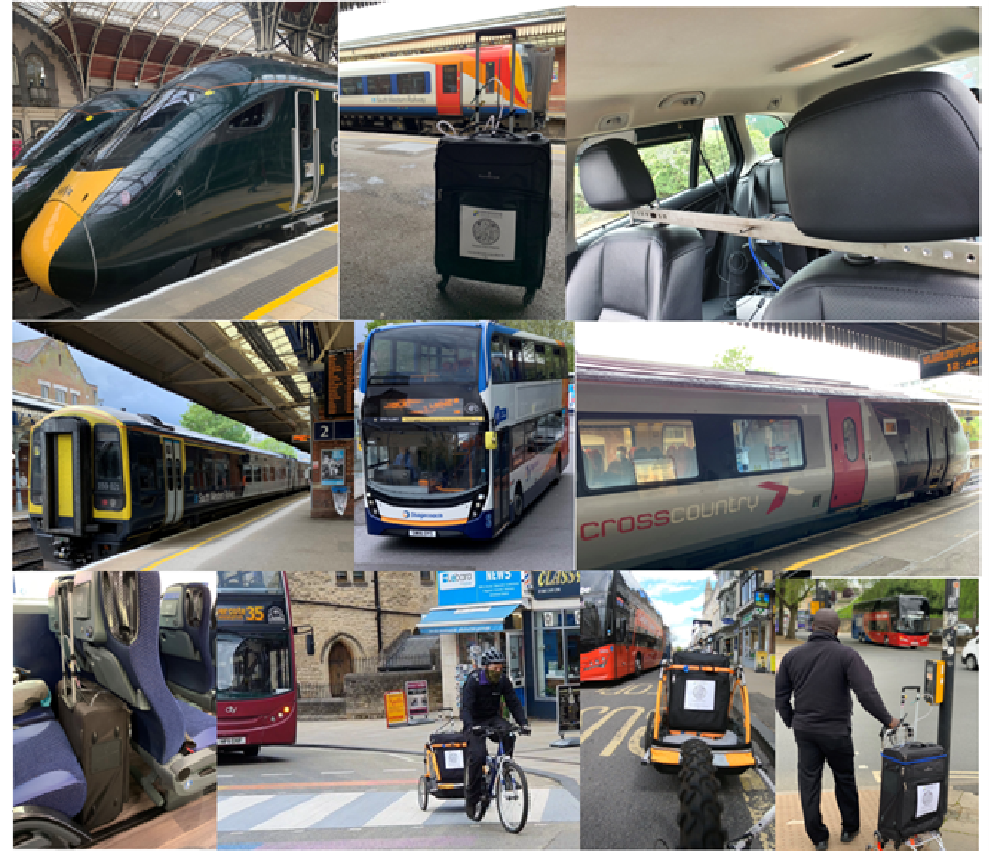
The transport modes tested were the electric train, diesel train, diesel coach, diesel and hybrid bus, battery electric vehicle (BEV), diesel internal combustion engine (ICE) vehicle, bicycle and on foot. Most of these vehicles were relatively modern, as shown in the images above. The car journeys were point-to-point from London Paddington station to Oxford High Street, whereas the others – except bicycle and on foot – were multi-stage journeys, trying to achieve the most direct route. For example, the diesel train was direct between the cities with an added bus journey to Oxford city centre. The least direct route involved the London Underground, an electric train, then a diesel train and a bus.
Before getting into analysis of the vehicles, it is important to say that, generally speaking, active travel by bicycle or on foot led to among the lowest pollutant exposures, even in the city of Oxford, although there was significant variability between journeys. Although the traveller was exposed to spikes in pollutants, especially from other vehicles, the level of dilution with fresh air was high. However, cycling or walking is not a viable substitute mode for the whole journey from London to Oxford.
The table below shows the estimated total mass exposure to VOCs, per passenger, split into functional groups, for the different journeys, factoring in the trip duration and volume of air inhaled due to the activity level involved. Simplistically, the VOC functional groups have been presented in increasing order of potential toxicity, from alcohols at the lowest level to polycyclic aromatic hydrocarbons (PAHs) and nitrogen-containing compounds, which are often carcinogenic.
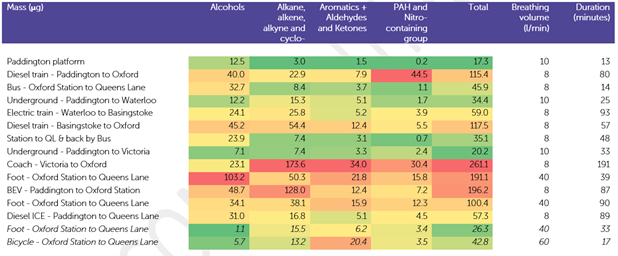
Overall, the coach generated the greatest VOC exposures, particularly in the alkane and aromatic groups. The highest PAH exposures were on the direct diesel train to Oxford. Electrified public transport typically saw low exposures, indeed lower than the BEV passenger car. In fact, the exposures in this brand-new BEV were almost four times higher than the nine-year-old diesel car. This may be due to the BEV being a smaller city car, whereas the diesel was a premium vehicle, which may have had a superior ventilation and filtration system. Furthermore, it is seen more widely that BEVs can have worse in-cabin pollution as energy is not applied sufficiently to the ventilation system in order to maximise range.
The coach saw the greatest overall exposures, not least because of the journey's long duration, with a significant proportion of the VOCs appearing to originate from personal care products – deodorants, shampoos, perfumes and so on – from other passengers, as shown in the table below. To perform this analysis, each VOC is allocated to a category based on its most likely source, and the unit of measurement reflects the total area under the peaks on the chromatogram. Although these personal care products are likely to be less toxic to humans at the concentrations measured, the coach also had the highest level of fumes from fuels and lubricants, which are likely to have come from other vehicles on the road, but allowed to enter and persist in the coach cabin.
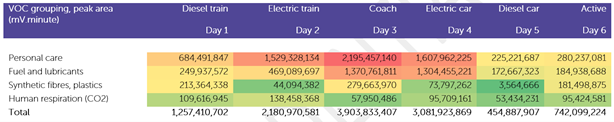
By far the cleanest vehicle, therefore, is the diesel car (a Mercedes-Benz), but the electric car is poor – the prevalence of VOCs from both personal care products and engine fumes in the BEV is consistent with the idea that the ventilation is poor in this budget car (a Vauxhall), and how important a good ventilation system is to balance filtration and air exchange rates in protecting the driver.
Is there evidence to support this when looking at the particle and CO2 results? The table below shows the average results for particulate number (PN), particulate mass (PM) and CO2. Broadly, the former two are measures of pollutant exposure, whereas CO2 is a proxy for air freshness and rate of air exchange. This immediately reveals the public transport dilemma – packing more people in tends to lead to stuffier air, just as passenger density is the key to greenhouse gas emissions reduction per passenger-mile.
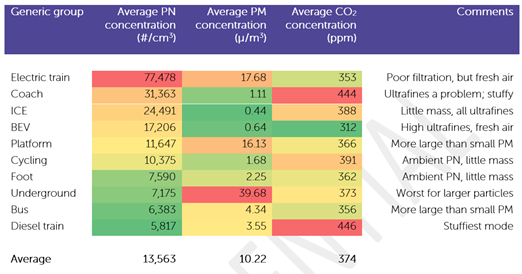
The London Underground journey – an electric train – has by far the highest PM exposures, which is likely to be fluff, metal from the tracks and human detrita. Ultrafine particles, as measured by PN, are relatively low there, in contrast to the electric train from London Waterloo to Basingstoke, which saw high particle levels. For particles, the results were similar between the two types of car, which suggests the issue is more that VOCs are off-gassing from the interior materials on the new BEV, and its ventilation system is not exchanging the air often enough to keep the concentrations down. The least fresh air was found on the coach and diesel train, which werebad not just for VOC exposures, but general comfort.
Thus far in this newsletter, we have described emissions in a vehicle-centric way. However, when the real-time data is considered in more detail, it is clear that a significant proportion of exposures on public transport are not when the vehicle is moving. Rather, the process of waiting for, boarding and alighting the vehicle, together with it letting on other passengers at stops, creates exposure spikes. The time series chart below takes the example of the journey via the Underground, electric train and then diesel train to Oxford.
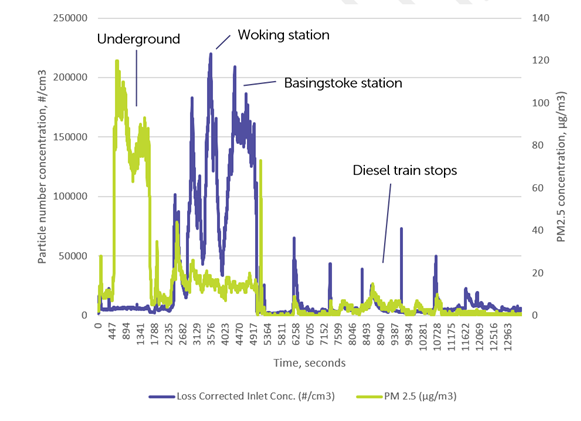
After the fluffiness of the Underground, getting onto the electric train at Waterloo showed a spike in both PM and PN, followed by PN spikes at various stations. The change, with a wait on the platform, onto the diesel train at Basingstoke had a large, persistent elevated level of PN and brief spike of PM. Much of this is due to a cocktail of diesel fumes and cooking smells from food concessions inside the station. The diesel train, once boarded, was cleaner, but with spikes at each station.
In short, public transport is getting squeezed between active travel and the car, both in economics and for health. It is not sufficient just to upgrade public transport vehicles to reduce VOC and particle exposures, but also the whole experience including interchanges, stopping patterns and waiting times. Public transport also needs to resolve the tension between wanting to squeeze as many people in for good economics and environmentals, and maintaining a good level of air freshness and comfort.
References
TRANSITION is a UK-wide network, led by the University of Birmingham in collaboration with nine universities and over 20 cross-sector partners, aiming to optimise the air quality and health outcomes of transport decarbonisation. The network (NERC ref. NE/V002449/1) is itself funded by UK Research & Innovation through its Clean Air Strategic Priorities Fund, administered by the Natural Environment Research Council. Raw data from the testing can be found in Centre for Environmental Data Analysis (CEDA) at https://catalogue.ceda.ac.uk/uuid/96c912c7c0094da2a8627d446cb06708.