

Air quality…it’s hotting up
Will 2015 be recognised as a turning point in the campaign for clean air? It certainly has the potential to as there are a number of threads which, if they come together, could determine the future prospects for urban air quality in Europe.
Will 2015 be recognised as a turning point in the campaign for clean air? It certainly has the potential to as there are a number of threads which, if they come together, could determine the future prospects for urban air quality in Europe.
For instance, the second stage of the Euro 6 regulations for passenger cars will come into force from September. All new cars registered will need to meet reduced limits for NOx, albeit still measured on the artificial laboratory New European Driving Cycle (NEDC).
Also, negotiations will come to a head in the EU around the Conformity Factor for the third stage of the Euro 6 regulations. This will see the use of Portable Emissions Measurement Systems (PEMS) becoming mandatory for the first time. Emissions Analytics has argued long for such portable testing in real-world driving, so this is significant progress. However, a high Conformity Factor (the permissible exceedence of the regulated limits) for a long period could limit the effectiveness of the regulation.
Additionally, the UK government must come up with a new air quality plan after its defeat in the Supreme Court. The activist legal group, ClientEarth, accused the government of failing to meet legal limits for air pollution and the Supreme Court found in its favour, instructing the government to draw up a new plan by the end of 2015.
So, let’s take stock of what Emissions Analytics’ real-world test data is telling us on these points.
The second stage of the Euro 6 regulations is likely to reinforce the existing trend of significantly reducing NOx, but there will still be large exceedances over the regulations. Emissions from Euro 6 diesels are on average 0.340 g/km when they should be 0.08g/km, although this is a 54% reduction on the 0.736 g/km from Euro 5. The issue is much less for gasoline vehicles, which are on average 24% below the 0.06g/km limits. However, 22% of vehicles tested by Emissions Analytics did not meet the limit.
Regarding the Conformity Factor at the third stage of Euro 6, there is growing evidence that, in time, a low factor is viable. Across all Euro 5 diesels we tested, just one met the regulated level. So far for Euro 6 four have already met the limit, using a mix of selective catalytic reduction (SCR) and lean NOx trap (LNT) after-treatment systems. There is still much work to do, but the evidence shows that the limits themselves could be met.
A new version of the UK’s air quality plan is being written by the Department for Environment, Food and Rural Affairs and Secretary of State Liz Truss has announced consultation “later this year”. Crucial in our view will be the understanding and modelling of primary NO2 emissions, as this is a major contributor towards roadside pollution yet is not specifically regulated by Euro 6. Emissions Analytics has found that the variation in this fraction of NO2 in NOx between models has also grown, as a result of differences in after-treatment technologies; for Euro 6 diesels it is 17%-80%, where previously is was 27%-70% in Euro 5 models.
To assist the industry in making a success of Euro 6, Emissions Analytics recently launched an online database of its results, which will be updated in real-time as it continues its rolling test programme. We don’t know yet how these important developments will impact urban air quality but we will be tracking it closely.


Time to decide the car for our 1000th test
Since rigging our first car with PEMS equipment in 2011, we have tested almost 1000 vehicles. To mark this milestone we want you to suggest our 1000th automobile.
Since rigging our first car with PEMS equipment in 2011, we have tested almost 1000 vehicles. To mark this milestone we want you to suggest our 1000th automobile. To give you some ideas we have put together a summary of the best performers, the worst and everything in between. Plus our testers have shared their favourites.
Number of cars tested in UK 672
Number of cars tested in USA 315
Number of diesels tested 402
Number of petrols tested 585
Number of miles driven 96,075
Number of data points recorded 9,450,000
Most miles per gallon 2012 Citroen C3
70.3mpg (UK)
58.6mpg (USA)
4.0l/100km (EU)
Fewest miles per gallon 1968 Plymouth GTX
12.8mpg (UK)
10.7mpg (USA)
22.1l/100km (EU)
Testers’ favourites
Sam Boyle – Dodge Charger SRT (the Hellcat) – “700hp in a family car, what all dads are looking for!”
Steve Hayton – Aston Martin Vantage – “Very cool and the only one to meet its offical mpg in 2014”
Jesus Flores – Audi A7 – “Very sleek interior, amazing drive and great mpg”
Adam Shawford – Jaguar F-type – “It looks amazing and has a soundtrack to match”
Femi Idowu – Mercedes Benz S300 – “Everything you could want in a car, luxurious and classy.”
Chris Conway – VW Golf R – “The TrueMPG is great for the performance and it sounds epic!”
Test#1000 – You decide!
Tell us which car you think we should test, it could be one you think is particularly good on fuel economy, or particularly bad for NOx. It could be a classic or brand new. As long as it’s road-worthy we can test it so get thinking. Suggest a car.
Emissions Analytics is the leading provider of independent on-road emissions data to the automotive secotr. Results from all our tests are available by subscription. Find out more.

Do the benefits of stop-start technology outweigh the irritations?
The principle behind stop-start technology makes sense. Turn off your engine whilst it is not needed, for instance at red traffic lights, and you will save fuel and reduce emissions.
The principle behind stop-start technology makes sense. Turn off your engine whilst it is not needed, for instance at red traffic lights, and you will save fuel and reduce emissions. However, at EA we wanted to know just how much of a difference it really makes and so we mined our database of 900 real on-road tests to find out.
First we looked at the test results from a VW Golf fitted with stop-start technology, crunched the numbers and found it spent 9% of our test idling, or rather in the off-mode. For this fairly typical diesel vehicle, 0.4g of CO2 is saved per second that the engine is switched off. Extrapolate this and, as the table below shows, drivers of this model do see some benefit from having engines equipped with stop-start technology.
During the official New European Drive Cycle (NEDC) the car spends 24% of the time idle. So when we ran our Golf data through this test the resultant fuel efficiency was supposedly even greater.

Admittedly, the analysis above only considers one vehicle and it is still based on a test cycle, albeit our real on-road cycle rather than in the lab. However, earlier this year for Channel 4’s Dispatches programme, EA fitted a data logger to a real driver’s car and tracked it for a week. Data from this real-world experiment showed that this Seat Alhambra spent 8% of its time idling. Very similar to the 9% of time the Golf was in off-mode but a far cry from the 24% anticipated by the official tests.
Interestingly, our data also shows that exhaust temperature drops by about 40% when the engine switches to the off-mode. When the engine re-starts the temperature quickly rises again. However, this can often coincide with a period of acceleration as the vehicle pulls away, which may mean higher NOx emissions. Thus careful thermal management strategies need to be employed by the manufacturers to ensure their exhaust after treatments are still effective against NOxemissions, which is something EA will be studying in more detail in the future.

Stop-start technology is a particularly attractive proposition for manufacturers looking to achieve a high MPG result and low CO2 rating on the NEDC. Drivers will see some benefits, just not as much as published because the NEDC is flattering the result due to its high proportion of stationary time. So, if you can cope with the annoyance factor of having your engine switch off every time you pull up it is worth having.

Air-con on in the sun?
In the knowledge that the readership of this newsletter extends far beyond those of us expecting a traditionally wet British summer, this issue looks at air conditioning and its impact on fuel economy.
In the knowledge that the readership of this newsletter extends far beyond those of us expecting a traditionally wet British summer, this issue looks at air conditioning and its impact on fuel economy.
From our test centre in Los Angeles, where they are lucky enough to need air conditioning most of the year, we test elements of the cycle twice; once with the air conditioning switched on, and again with it switched off. We have looked at the data from over 100 passenger cars and this is what we have found.
With the air-con fully on there is a larger effect on MPG in the city (-5.4%) than in highway driving (-2.7%).
When you look at the data in more detail the effect of air-con on fully on MPG, by fuel type and cycle shows some noticeable differences:
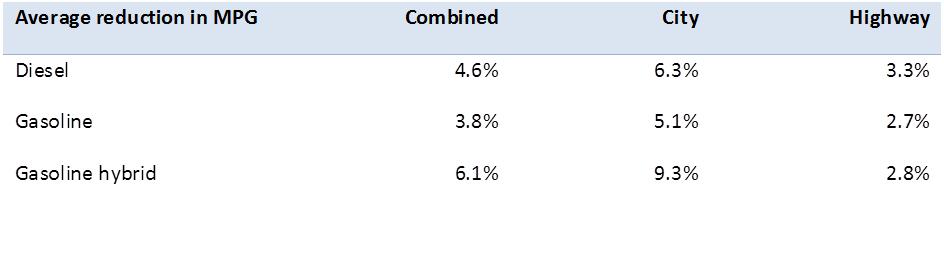
Hybrids suffer a significant reduction in fuel economy with the air-con on in cities, so if you drive one of these it is perhaps better to wind down the windows in town as the aerodynamic penalty may be less.
And when you look at the spread of values in the table below, you can see the effect of air-con differs quite a lot from vehicle to vehicle. So if you live in a hot country and are thinking of buying a car, it pays to investigate your options.

The average effect of air-con on MPG on passenger cars tested in the US is -4%, which equates to 14 g/km of CO2. The average CO2 emissions of our real-world tests in the UK is 160g/km. Thus if the air-con has the same load on a European car then the effect would be an 8% reduction in MPG. However, it’s raining as I write this so perhaps not overly worrying for us Brits!

Revealed: Annual MPG Report Card
Real-world fuel economy hardly growing
Real-world fuel economy hardly growing
Evidence from our large-scale test programme of passenger cars in Europe reveals the difference between the official fuel economy figures for new cars and their real-world results is continuing to grow.
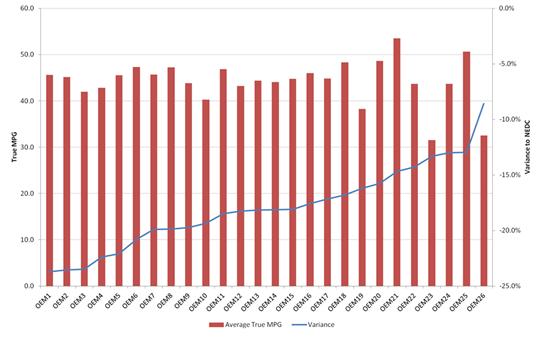
The latest examination of our data shows that the gap between the combined New European Driving Cycle figures and our real-world results has grown to 24%. This is a dramatic increase from the 16% average variance we first recorded in 2012, and shows the degree to which official figures distort the true picture of vehicle efficiency (dotted green line on graph below).
What this means is that, in real terms, the fuel economy motorists can expect from their new vehicles is hardly growing, just 2mpg over the last three years (blue line), yet the official figures show a marked improvement (red line). While it is true that vehicles went through a phase of significant efficiency improvement in the past, these new results suggest progress in this area has now stalled.

The bigger picture
As older cars are replaced by their owners with newer models, fuel consumption and CO2 outputs should fall. However, if drivers switch from larger engines to smaller vehicles this improvement tends to be counteracted. In an earlier newsletter we described how the efficiency gap is greater for smaller-engined vehicles, and particularly downsized engines in larger cars. The very smallest cars are on average 36% below their advertised MPG.
In addition, any backlash against ‘dirty diesels’ may further work against greenhouse gas reductions if consumers switch back to the higher CO2 gasoline vehicles, despite the fact that the industry narrative and public perception about diesels may be lagging reality. We are seeing that the latest Euro 6 diesels are significantly lower in NOx and particulates as discussed in last month’s newsletter.
The overall effect of these factors is potentially to constrain the UK’s ability to meet its greenhouse gas targets, and to cost the consumer more at the pump.
EA has launched a new service for tracking and benchmarking MPG performance. It provides access to our database from high-level trends to detailed results from individual tests. Find out more.
The data we collect is used to populate What Car’s True MPG consumer website. For more information on which vehicles perform best and worst visit their site.

The end of the road for dirty diesels?
We have been listening to the proposals to discourage ‘dirty diesels’ by cities across Europe, and read with interest the statement from the Society of Motor Manufacturers and Traders (SMMT), speaking up in favour of the diesel car. In our opinion, the evidence from real-on-road tests speaks for itself.
We have been listening to the proposals to discourage ‘dirty diesels’ by cities across Europe, and read with interest the statement from the Society of Motor Manufacturers and Traders (SMMT), speaking up in favour of the diesel car. In our opinion, the evidence from real-on-road tests speaks for itself.
Our research shows Euro 5 standard diesels and earlier are indeed ‘dirty’. They produce high levels of NOx which is harmful to human health. Emissions are particularly bad in urban environments because NOx emissions correlate more closely with incidences of acceleration than speed, thus the stop-start nature of city driving exacerbates air pollution. And, it is made worse by the high number of older diesel buses, taxis and delivery vehicles in the urban environment.
To help combat this problem, the legal limit for NOx emissions was reduced to 0.08g/km with the introduction of the Euro 6 standard for passenger cars, effective from September 2014. We tested a number of the earliest Euro 6 diesels on the market and found that they produced levels of NOx which were seven times above the legislated limits. You can read more about it in the ICCT’s 2014 report, to which EA contributed data.
However, our latest tests show that many newer Euro 6 diesels are showing marked improvements, with NOx levels averaging 2.5 times above the legislated limit. In addition, great strides have been made to clean up new buses and the NOx emissions are now very low from many of these vehicles. Another concern with diesels is the emissions of particulates which are linked to heart and lung disease. However, this issue was addressed with the Euro 5 standard which saw the addition of diesel particulate filters to the exhaust system, which has significantly reduced this problem.
Automotive manufacturers have been investing in NOx abatement technologies and strategies in anticipation of the forth-coming legislative changes which will require an element of real on-road testing, known as Real Driving Emissions. In future it will no longer be sufficient to simply pass the test, manufacturers will also have to demonstrate that their vehicles also comply when driven in the real world.
This can only be to the benefit of urban air quality and thus we agree with the SMMT in that a simplistic ‘demonisation’ of new diesels is not correct. In fact, careful attention needs to be paid to other technologies creating emissions increases, such as direct injection gasoline engines. Nevertheless, there are issues with diesels that are not captured by the regulations, for example the proportion of NOx that is emitted as NO2, the more harmful component. Our research shows that this proportion can be as high as 90% in urban driving, much higher than generally acknowledged.
Emissions Analytics has been leading research in these areas, for example with Imperial College London through the Air Pollution Research in London group, to ensure that the clean-up of diesel engines continues to translate into reality.

Weighing the cost of a new van
EA is in the business of improving the quality and availability of data in the automotive sector and so we will soon be introducing on-road testing for light commercial vehicles in the UK, helping consumers make informed decisions about which vehicle to buy with an easy to use miles per gallon calculator.
EA is in the business of improving the quality and availability of data in the automotive sector and so we will soon be introducing on-road testing for light commercial vehicles in the UK, helping consumers make informed decisions about which vehicle to buy with an easy to use miles per gallon calculator.
A major contributing factor to fuel economy for vans and pickup trucks is the load on board. So, in addition to our standard fuel economy test, we will include repeat cycles with the vehicle fully laden at its maximum payload. This will enable the buyer to consider how they expect to use the vehicle and find out what effect this will have on their fuel consumption.
In a 2014 report, the RAC Foundation found that the carriage of equipment, and delivery and collection of goods accounted for 79% of the mileage of light commercial vehicles in the UK. However, this is unquantified in the official tests.
The regulators would argue that testing vans and trucks unladen provides a level playing field, allowing for comparisons between vehicles. Yet in this sector of the market, carrying capacity varies within a CO2 class. The fully laden Ford Transit Courier can carry 112kg (247lb) more than the Vauxhall Corsavan but both record CO2 of 103g/km. In theory they should give the same fuel economy – but only if driven empty!
USA perspective
Although the EPA’s five-cycle test regime produces official figures which, on average, more closely match real-world performance than in Europe, the test still does not account for a fully-loaded vehicle.
Thus the question facing the consumer, who is purchasing a vehicle for its intended purpose, to carry stuff, is the same on both sides of the Atlantic – how much will it really cost to run?
We have been addressing this issue from our Motor Trend test centre in Los Angeles, looking into the impact of variable payload. For example, when we packed the Nissan NV200 with bags of cement increasing its payload to 1132lb (513kg) – its maximum is 1470lb (667kg), and drove it on our 88-mile (142km) city and highway test route, we saw a reduction in fuel economy from 25mpg to 22mpg (US gallons). Read more. Based on the average distance driven of 15,000 miles, that equates to an additional 82 gallons (310l) of fuel per year, which multiplied by the 8 million or so new commercial vehicles registered each year is a lot of extra gas.

Vans and pickups are an increasingly important sector for UK and US drivers, so this data will help us understand their real-world performance. Watch this space for trends and observations as UK testing gets underway in March 2015.

Ploughing ahead with tractor testing
Working with Emissions Analytics, engineering researchers at Harper Adams University have developed a new method to accurately measure the exhaust emissions of agricultural machinery.
Working with Emissions Analytics, engineering researchers at Harper Adams University have developed a new method to accurately measure the exhaust emissions of agricultural machinery.
Traditionally, machines such as tractors are tested in controlled environments such as a soil hall, not taking into account the many variables from real-life scenarios, which result in transient engine loads.
With support from CLAAS and EA, the postgraduate students used PEMS equipment quite literally in the field. Two engine exhaust after treatment systems commonly used by tractors to reduce emissions were tested; a CLAAS Axion 830 with a selective catalytic reduction system and a CLAAS Arion 650 using exhaust gas recirculation combined with a diesel particulate filter.
Both tractors were trialled in three conditions – using a dynamometer to add a variable load to the PTO shaft; road testing at high speed with a fully laden trailer; and in a field with a subsoiler and power harrow. As with road vehicles the CO, CO2, NOx and THC data was combined with vehicle data such as GPS position, engine load and speed.
The project was designed to investigate the differences between theoretical CO2 conversion factors and real-world factors for non-road mobile machinery; and to demonstrate the feasibility of using PEMS equipment for such a task. The results, analysed by Miles Metcalfe with supervision from PhD student Rob Fillingham, were written up for his MEng Agricultual Engineering dissertation for which he was awarded a first class.
Metcalfe demonstrated that the assumed linear relationship between engine load and CO2 conversion factor was in fact better suited to an exponential curve, and that by using the traditional conversion factors supplied by DEFRA, CO2 is in fact being over estimated as there is a significant difference of p<0.001 between the DEFRA value and the PEMS result.
Observations made, such as an increase in CO2 conversion factors whilst the tractor was turning at lower engine speeds or loads at the field’s headlands, show that this innovative collaboration between Emissions Analytics and the agricultural sector has the potential to allow farmers to not only save fuel but reduce damaging emissions by using data gathered from real agricultural practices. And, as regulations change for N-RMM, the power of PEMS to measure compliance is evident.

Real Driving Emissions – are you ready?
Emissions Analytics was recently asked to write an article for Automotive World’s Megatrends magazine. This month’s newsletter is a summary of that article which considers the potential impact of the proposed changes to the New European Drive Cycle.
Emissions Analytics was recently asked to write an article for Automotive World’s Megatrends magazine. This month’s newsletter is a summary of that article which considers the potential impact of the proposed changes to the New European Drive Cycle.
Emissions Analytics’ data resource, from tests on more than 800 vehicles, is transforming the economics of obtaining emissions data for OEMs who are tasked with understanding and acting upon the proposed legislative changes concerning Real Driving Emissions (RDE) and the move towards the World Harmonised Light Test Cycle and Procedures (WLTC/P).
The new testing system, developed by global representatives for the United Nations Economic Commission for Europe is due to be finalised in the spring of 2015. This test cycle is more representative of real-world driving and the test procedures should be more robust than those associated with the New European Drive Cycle (NEDC).
One of the reasons for the proposed change is the growing gap between the number of miles per gallon certified during the NEDC test and the fuel economy achievable by real drivers on the road which can be seen clearly below.
Using Emissions Analytics’ real-world data, the blue line on the graph below illustrates how this gap is growing, at about two percentage points per year, and is likely to continue to expand if left unchecked. With the introduction of the WLTC/P in 2017, we predict the gap will close by between half and two-thirds (shown below in green), depending on how stringent the final protocol is.
Although this will bring the European divergence closer it will not equal the USA variance, where the more stringent five-cycle system is in operation.

Bold line: EA data
Dashed line (historical): Other sources of data
Dashed line (future): Model based prediction by EA
The European Parliament and European Commission have proposed this new test be introduced in 2017, although there are challenges and opposition from some parts of the automotive industry that would like longer to adapt to the changes.
One of the challenges facing OEMs is the profile of the NEDC replacement, the WLTC. The International Council on Clean Transportation has estimated that the effect on the EU CO2 target value will be an increase of around 5-8%. Emissions Analytics believes the increase could be higher than this. If nothing were changed in the targets, OEMs would need to deliver further efficiencies in their vehicles, and consumers in some countries could find themselves paying more vehicle tax.
There is a methodology under development for translating the existing NEDC results into WLTC, but this is still work-in-progress and has limitations. What is clear is that forewarning of how current vehicles perform on the test can bring significant benefits to the engineers developing the vehicles which will be on the road when the WLTC/P is adopted. This is why some manufacturers use Emissions Analytics’ data to ensure compliance and to stay competitive, benchmarking their own progress against that of their closest rivals.
In times when manufacturers are under increasing pressure to be open and honest about their vehicles’ true in-use performance, plus with the imminent legislative changes which will formalise this requirement, there has never been a greater need for a reliable and robust source of data which can offer the insight and intelligence needed.
Emissions Analytics will shortly be making their data available to the automotive sector directly via a new, subscription based software platform called RDEanalytics. More will follow on this in a later newsletter but for a sneak preview or to find out more email us now.

Hybrid efficiency put to the test
Despite common perception, the advantage of hybrids over frugal diesels is often illusory, if judged solely on fuel economy. Having tested over 30 hybrids in the UK and US, Emissions Analytics is able to analyse the data to understand how they really perform.
Despite common perception, the advantage of hybrids over frugal diesels is often illusory, if judged solely on fuel economy. Having tested over 30 hybrids in the UK and US, Emissions Analytics is able to analyse the data to understand how they really perform.
To illustrate the point we have taken a sample of 10 vehicles tested since 2013 – two standard hybrids versus 8 diesels – from the real-world fuel economy testing we conduct with What Car? in the UK. Each has an engines in the 1.5 to 2.2 litre range, power up to 150bhp, two-wheel drive and with hatchback, saloon or estate body style. The table shows the sample, ranked by fuel economy with the best MPG at the top:
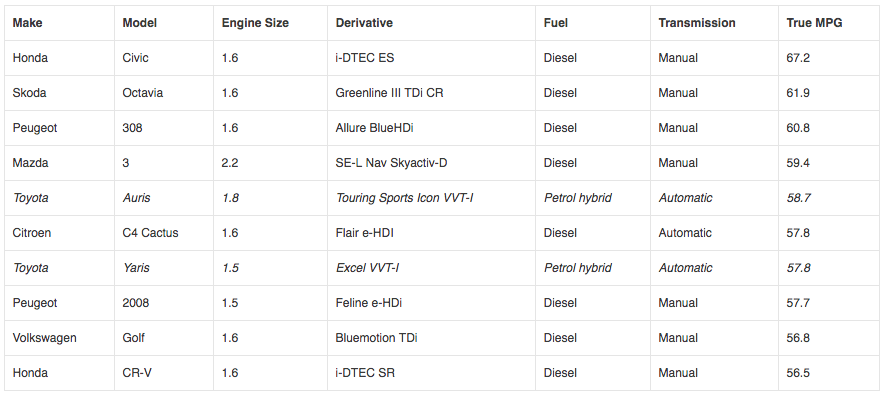
While hybrids deliver good fuel economy in real driving, they can be eclipsed by up to 10mpg by some non-hybrid diesels. And that is after having taken into account any net changes in battery charge levels, to ensure that the hybrids are not penalised over our cycle. For certain driving patterns however, hybrids may still be the better option. Over our complete dataset of more than 500 vehicles in the UK, we can quantify how average MPG changes under congestion and aggressive and fast driving.

What this data shows is that hybrids suffer much less than their ICE equivalents under congested urban driving: on average a 3% penalty compared to 7%. In contrast, by doubling the average rate of acceleration the MPG falls by more for hybrids, especially diesel hybrids.
Comparing motorway driving to town driving, all types of vehicle show better MPG on the former, but the difference between hybrids and ICE vehicles is dramatic – typically because the downsized engines found in the hybrids are less suited for high speed motorway cruising.
Even more than their tolerance of congestion, the value of hybrids may be in their pollutant emissions, as even the cleanest diesels typically exceed the regulated values of NOx. In a recent report by the International Council on Clean Transportation, which analysed data from Emissions Analytics, the average exceedance was seven times for the latest Euro 6 diesel cars.
This compares to petrols, which generally meet the regulated NOx standards, even in real-world driving. Carbon monoxide is higher for the petrols, but again within the regulated values. Therefore, petrol hybrids have the benefit over ICE diesels in their effect on air quality, made even better as a proportion of urban driving will be on battery, with zero emissions. Although not included here, plug-in hybrids can show this pattern even more strongly.
In summary, hybrids deliver good but not best-in-class fuel economy, but they are typically the cleanest, and if you are a light-footed, congested town driver, they are ideal.

Beware the danger of downsizing
The old adage that good things come in small packages is not necessarily true in the automotive sector, at least not when it comes to engine size.
The old adage that good things come in small packages is not necessarily true in the automotive sector, at least not when it comes to engine size.
Looking at the data in the table below, based on real-world tests from over 500 model variants, it can be seen that engines under one litre have the greatest variance from their official figures. As well as achieving 36% less than you expect in terms of fuel economy, you will only achieve 3mpg more than the average of all the cars we’ve tested, which includes thirsty performance cars.
For maximum fuel economy you should look for a 1-3 litre engine, as these will return around 45-46mpg. And, to avoid being too disappointed with the result, pick a 2-3 litre vehicle as it will be only 15% worse than you were told you could achieve.

To understand why these ‘eco’ engines perform so poorly on the road, it’s necessary to look at the miles per gallon penalty of accelerating.

The graph shows that the smaller the engine, the larger the penalty acceleration has on mpg. And because the NEDC test has relatively few episodes of acceleration and those that it does have are of a gentle nature, these small engines appear to perform well and receive a high mpg result. That is, until they are taken on the road and driven by real drivers when every rev suddenly burns through the fuel.
Now contrast the US data, where the EPA five test cycle contains much harsher boundaries and you can see that although there are large engines and an overall lower average mpg, the variance to the statutory figures is very small. You may not get as much from your tank – average European fuel economy is over 40% better than in the US – but at least you know how much not much is.
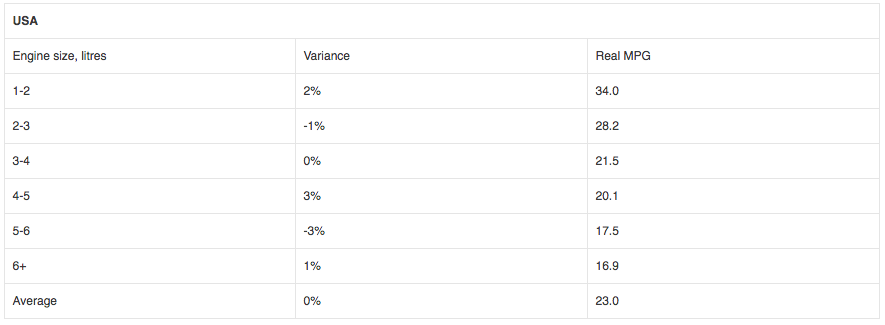
In fact, the US is at a much earlier stage in the trend towards downsizing than Europe, evidenced by the fact that so far we have tested no vehicles in category below 1 litre. Perhaps the more strenuous EPA tests will put a limit on such downsizing – or, at least, downsizing without down-weighting.

Measuring the manufacturers: The EA league table
As promised last month we are going to examine our fuel economy data in more detail, particularly looking at how different manufacturers perform.
As promised last month we are going to examine our fuel economy data in more detail, particularly looking at how different manufacturers perform.
Of the 459 vehicles included in this study, spread across 26 manufacturers, the average real-world mpg by OEM ranges from 31 to 54mpg, with a mean of 44mpg. The deficit from the official figures ranges from 7% to 23%, with the average 22% below NEDC.
The graph, which ranks manufacturers (excluding manufacturers where we have tested fewer than five of their vehicles) according to the extent of their variance from official figures, reveals some interesting observations. Three of the OEMs towards the right of the graph with lower mpg are performance-car-only manufacturers, specifically OEMs 19, 23 and 26. If we exclude these, then the range of real-world mpg shrinks to 40 to 54mpg. By comparison the NEDC figures for these vehicles range from 50 to 63mpg, almost the same spread but 20% higher.
There is then one outlier that does worse than average (OEM 10) and two that are significantly better (OEMs 21 and 25). These manufacturers may have a model range which causes this skewing effect, for instance if they have few big cars in their model mix their average mpg could appear better than other manufacturers. When these three OEMs are also removed from the analysis, the miles per gallon narrows even more from 42 to 49mpg.
So, despite the remaining 20 manufacturers representing a variety of nationalities, technology types and target audiences, their vehicles have surprisingly similar performances in the real world. However, the variance from the official figures still ranges from -13% to -24%.
Although I promised to keep this anonymous, I feel confident that the top performer won’t mind being mentioned. Therefore, I can reveal that OEM 26, which has the smallest variance from the official combined mpg, is Porsche. It also has the second lowest absolute performance, perhaps not surprising given its model line up.
Our consultancy service allows OEMs to see their vehicles in direct relation to their competitors. Contact us if you would like to find out more.

Do we still need to mind the MPG gap?
The gap between official miles per gallon and real world mpg has grown to 22%. This is up 5% since we first started testing fuel economy almost three years ago.
The gap between official miles per gallon and real world mpg has grown to 22%. This is up 5% since we first started testing fuel economy almost three years ago.
The average official combined miles per gallon of the 459 passenger cars we have tested is 57 and this is increasing by approximately 1.7 mpg per year. Real world miles per gallon (TMPG) on the other hand, which averages 44 mpg, remains flat thus causing an increase in the gap of about two percentage points each year as can be seen in the graph below.

MPG vs. Engine size
The graph below shows that broadly speaking the gap grows as the engine size reduces. If you buy a five litre car you will not get great mpg but at least it will be consistent with the salesman’s patter and most likely your expectations. However, if you are shopping for a frugal run-around you are better off looking at the one to three litre engines which give the best absolute performance as well as a lower divergence from official figures than the super minis.

Fuel economy by engine type
Our data also shows that petrol engines, as expected, have worse fuel economy than diesels but interestingly the gap to official is also larger. And, manuals return a better fuel economy than automatics but automatics have a smaller gap between official and real-world figures.

More MPG
We’ll be looking at MPG in more detail in next month’s newsletter, including an analysis of the manufacturer leader board. The published results will be anonymised but OEMs are welcome to email me if they would like to find out how they sit within the table.
* The original Transport & Environment report Mind The Gap can be found here

Do eco tyres really save you money?
Preliminary tests have shown that ratings on tyre labels are not telling the full story. At mid-range speeds, an F-rated tyre performs as well as a B-rated tyre for fuel economy.
Preliminary tests have shown that ratings on tyre labels are not telling the full story. At mid-range speeds, an F-rated tyre performs as well as a B-rated tyre for fuel economy.
We tested two contrasting sets of 175/70 R14 tyres on the road. One set was a standard tyre with B-rating for fuel economy and the other had an F-rating. The test route incorporated a range of steady-state speeds from 40mph to 70mph on tarmac in consistent ambient temperatures.
The B rated tyre was superior in the 40-70 mph range by an average of 3.8% mpg and 3.4% less CO2. There isn’t much in it at the mid-range speed but a performance gap opens up at 55mph and by the time you get to 70mph the fuel economy has improved by 12.9%.
Thus a consumer buying B rated tyres is unlikely to notice a fuel economy benefit if the journeys they customarily make are mainly urban. Whereas a consumer heading up and down the motorway each day should enjoy an improvement.
Now this was an unashamedly quick and dirty investigation but it does demonstrate that the relationship between rolling resistance and fuel economy is not linear and that to bring real improvements to the way tyres are bought and sold manufacturers need to adopt more sophisticated models.
The current tyre labelling system, made mandatory by the EU in November 2012, is not working. In a report compiled by the National Tyre Distributors Association (NTDA) and LANXESS, the manufacturers of high-tech rubber for tyres, it was found that one year on 93% of tyre retailers said customers never or only occasionally requested information on the label and only 30% knew that tyres affect fuel consumption.
We think manufacturers need better models to translate rolling resistance calculations into fuel economy effects. Improved, independently verified testing and labelling, perhaps with a monetary quantification of the typical benefit would provide a tangible benefit that the consumer would welcome.

March 2014 – Transatlantic testing
This month, in preparation for a presentation we are giving at the 24th CRC Real World Emissions Conference in San Diego, we have been making a detailed examination of the data we are collecting in America.
This month, in preparation for a presentation we are giving at the 24th CRC Real World Emissions Conference in San Diego, we have been making a detailed examination of the data we are collecting in America.
In most respects the emissions testing we perform in the USA is identical to the work we do in the UK. We use the same equipment, the same methodology (with some adjustments to account for factors such as the widespread use of air conditioning in California) and even our technicians travel between sites to ensure continuity in our processes.
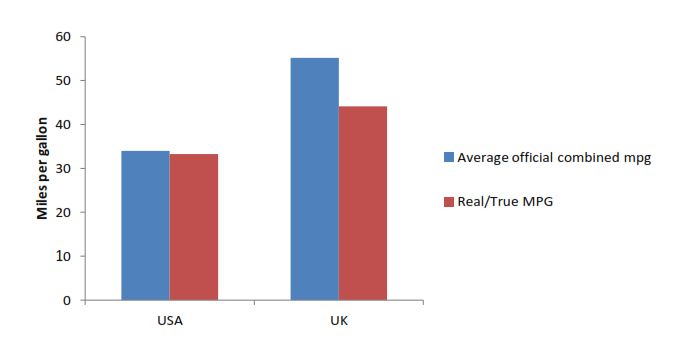
In the UK, the data is published by What Car? magazine under the brand True MPG and in the USA it is published by Motor Trend magazine as Real MPG.
However, despite consistency in the testing process there are marked differences in the results. One of the most noticeable differences between the UK and the USA is that the statutory figures provided by the Environmental Protection Agency (EPA) are a closer match to real world figures than those generated using the New European Drive Cycle (NEDC). As can be seen in this graph, Real MPG is within 1% of the EPA combined figure compared with an average of 18% below statutory in the UK.

The test cycle in the USA was improved in 2008 and now involves five tests: the city, highway, high speed (up to 80mph), hot (with air con) and cold at 20°F (-7°C). The total distance of the five tests is 43.9 miles and takes 1 hour 35 minutes to complete, compared with 6.8 miles and 19 minutes 40 seconds in the UK. In the US, 15% of new models are tested by the EPA to check the manufacturer figures, and failure to come within 3% of the published result can lead to a hefty fine.
Some more comparisons between Emissions Analytics’s data from the UK and USA can be seen in the table below.

It would appear from the test data gathered to date in the USA that the EPA figures are well calibrated to average driving, although variations in the real world can lead to divergence from this by up to 20%. We are now running at full speed in the USA and will be testing upwards of 250 passenger cars per year. It will be interesting to see if a gap between statutory and real world fuel economy starts to appear as the pressure to deliver the best fuel economy label grows.

February ’14 – NOx in the News
In the press last week was the news that the European Commission has launched legal proceedings against the UK for failing to deal with air pollution.
NOx in the news
In the press last week was the news that the European Commission has launched legal proceedings against the UK for failing to deal with air pollution. Britain was supposed to meet EU limits set out in the Air Quality Directive by 2010 but the government has said these levels will not be reached until 2020 in most areas and in London it is likely that they will not be met until 2025.
The main cause of these air-borne contaminants regulated by the EU is diesel engines, but why is Britain so far from the target?
A real-world view of NOx
Although auto manufacturers have introduced a number of modifications to meet the ever tightening controls of NOx emissions, a study conducted by Imperial College London and Emissions Analytics, on Euro 5 light-duty diesels, shows the real-world figures exceed Euro 5 standards threefold in most instances.

In the graph above you can see that all the cars in the sample failed to meet Euro standard 4 or 5 and, only three reached Euro standard 3. It can also be seen that the real-world average NOx emissions is considerably higher than the limits set out in the regulations. This is the same situation we see with fuel efficiency when we measure cars for True MPG, comparing their statutory mpg figures to performance in the real world. However, due to high levels of NOx being produced during stop-start driving, such as in traffic, the resulting gap between regulated and real-world air pollution is even more pronounced.
The reasons for Britain breaching EU regulations are many and complex; both NOx and miles per gallon standards are calculated using the New European Drive Cycle, the shortcomings of which have been widely reported and are supported by Emissions Analytics’ large volume of real-world data. Others have voiced concerns regarding the number of monitoring stations and the use of modelled data in EU Air Quality Directive compliance assessments. What it is clear is that real-world data has an important part to play in policy making.
Euro 6 and beyond…
With the introduction of Euro 6 demanding a drop in NOx of 80 per cent on the previous standard, EA and Imperial are continuing their study to see what the impact of this new ruling will be. Emissions Analytics is also developing a new traffic simulation model which will calculate the effect of speed and congestion on fuel economy, as well greenhouse gas (CO2) and air pollution (NOx and CO) components underpinned by the data from its real-world test of more than 400 models of passenger car.

Speed Demonisation
Changing speed limits on the UK’s roads is hardly out of the news at the moment. For instance, various London boroughs, including Camden and Islington, have recently announced a reduction in the speed limit from 30mph to 20mph to improve road safety. In 2011, the government briefly toyed with the idea of increasing motorway speed limits from 70mph to 80mph.
Changing speed limits on the UK’s roads is hardly out of the news at the moment. For instance, various London boroughs, including Camden and Islington, have recently announced a reduction in the speed limit from 30mph to 20mph to improve road safety. In 2011, the government briefly toyed with the idea of increasing motorway speed limits from 70mph to 80mph. Now they are looking at the possibility of reducing sections of the network to 60mph to alleviate congestion.
Although the Highways Agency politely declined our offer to provide data on the effect of speed on fuel economy and emissions for their M1 consultation, I have decided to share it with you instead as I think it makes for interesting reading.
Every car has an optimum speed for maximum fuel efficiency but what is the range between models and what difference does it make? By mining our data, gathered during tests on more than 500 passenger cars, we decided to find out.
The table below shows that the average optimum speed for the top five selling cars in the UK (2011) is 46mph over an 8mph range.
You can also see that for these same vehicles a reduction in speed from 70mph to 60mph improves fuel economy by an average of 22%, but this varies from 15% on the Ford Focus 1.6 petrol and VW Golf 1.6 diesel to 34% on the Vauxhall Corsa 1.3 diesel.

In a separate study we looked at the effect of reducing the speed limit from 30mph to 20mph and while this reduced CO2 emissions, the impact on CO2, NOx and particulates, due to changes in driving style, warrants further investigation.
While reducing speed may deliver one objective it can have a number of knock-on effects; every car has an optimum speed, 60mph is better than 70mph for fuel economy but 20mph is not necessarily better than 30mph for all tailpipe emissions. Factor in other considerations such as air quality, congestion and road safety and the picture becomes even more complex. What can be concluded however, is that robust data should be the cornerstone of any proposed changes to the rules of our roads.
Sign up here to receive this newsletter

A year of data from Emissions Analytics
Emissions Analytics specialises in the analysis and interpretation of complex data sets.
Emissions Analytics specialises in the analysis and interpretation of complex data sets. So here is a festive round-up of a few of our own numbers for the year:
True MPG results supplied to What Car? for 186 vehicles in 2013
Launch of Real MPG for Motor Trend magazine in the USA, 71 cars tested so far
16,000 miles driven on real roads in the UK and US
41,000 miles driven at the track for clients’ testing projects at home and abroad
An average of 185 grams of carbon dioxide emitted per kilometre
Largest engine tested this year was 12.9 litres
The smallest was 875cc
The average MPG was 44.5, with the worst just 20.5 and the best 71.7 (a hybrid).
Merry Christmas and a Happy New Year from the Emissions Analytics team.

DPF Regeneration Mysteries
There are two types of diesel particulate filter (DPF) regeneration which can occur without external intervention by the driver or a mechanic.
There are two types of diesel particulate filter (DPF) regeneration which can occur without external intervention by the driver or a mechanic. The first is passive regeneration which happens when high exhaust temperatures reached during intensive use (normally either long spells of motorway driving or hill climbing) automatically burn off the trapped diesel particles. The other is active regeneration of the DPF where the ECU is programmed to initiate post combustion fuel injection to increase the exhaust temperature and burn away diesel particles when the filter becomes around 45 per cent full.
If either type of regeneration occurs whilst we are conducting an on-road emissions test we have to scrap the test and start again. So, we keep a careful eye on the exhaust temperature, which we measure using our PEMS equipment, to monitor spikes which indicate regeneration. As a result of this process we have recorded the regeneration activity, in terms of both occurrences and emissions output, and the results are not what you might expect.
One thing we have noticed is that regeneration will often happen after the extra-urban phase of the test, during the urban phase. Thus the opportunity for passive regeneration has been missed and active regeneration takes place instead.
Why does this matter? Well, firstly there is the cost to the operator as active regeneration requires the engine to work harder to reach the required temperature and this reduces fuel economy by as much as 5mpg. But not only that, as can be seen from the graph below, active regeneration has a significant and negative impact on NOx emissions.
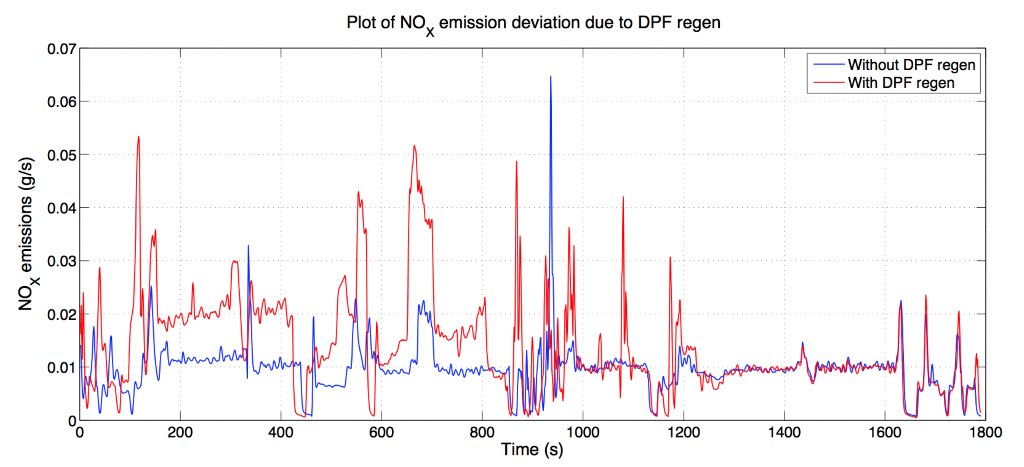
Graph by Joseph Ruxton, Imperial College London robin.north@imperial.ac.uk
NOx, a major source of air pollution, can as much as double during regeneration due to late fuel injection and increased engine temperatures. If this happens in town and city environments rather than on the motorway, it could have an even greater negative impact on human health. Although it should be noted that the negative effective of the rise in NOx is offset somewhat by the primary NO2 reduction the regeneration is designed to achieve.
Another observation on active regeneration concerns the new cars we test. Because every vehicle What Car? receives to test drive and review is passed to Emissions Analytics who then tests it to record the data which powers True MPG, many of the cars we are testing are very new, with only a few hundred miles on the clock, if that. Yet we are finding that active DPF regeneration can on occasionally take place during the course of the urban phase of our test. It is unlikely that the DPF is 45 per cent full on such a new vehicle, so what is the trigger for regeneration? We haven’t found the answer to this yet, so if you have any ideas please do get in touch.
More still needs to be understood on the impact of DFP regeneration in real-world conditions and Emissions Analytics is working with Imperial College London to provide data and analysis to investigate the subject further. What is clear is that the anomalies described above, combined with the issue of illegal removal of DPFs from older vehicles, means that it is likely that more discussion on this subject will be required in the near future.
Please feel free to use or share this information with a credit to Emissions Analytics.
Archive
- AIR Alliance 3
- Air Quality 38
- Audio 3
- Climate Change 14
- EQUA Index 21
- Electrified Vehicles 28
- Euro 7 3
- Fuel Consumption/Economy 20
- Fuels 4
- Infographic 18
- Media 4
- NRMM/Off-road 3
- Newsletter 103
- Podcast 7
- Presentation/Webinar 18
- Press Release 19
- Regulation 16
- Reports 4
- Tailpipe Emissions 49
- Tyre Consortium 2
- Tyre Emissions 26
- Vehicle Interior 6