

New Porsche Taycan Turbo S electrical vehicle testing in partnership with Motor Trend
In our quest to understand the real-world emissions and efficiency of motor vehicles, we were pleased to be able to test the new Porsche Taycan Turbo S electric vehicle (EV) in California, with our partners Motor Trend.
The recurrent scourge of technology preference
and the fallacy of zero emission
In our quest to understand the real-world emissions and efficiency of motor vehicles, we were pleased to be able to test the new Porsche Taycan Turbo S electric vehicle (EV) in California, with our partners Motor Trend www.motortrend.com
The punchline was a range, on our EQUA Real Mpg test, of 254 miles, reflecting a combined efficiency of 2.2 miles per kWh or 73.4 Mpg-equivalent (converting the electricity to a gasoline equivalent based on energy content). The test route is made up a of a combination of city and highway driving over approximately 100 miles, and includes measurement of charging losses in the efficiency calculation. So, the Taycan does not have best-in-class EV efficiency, but it exceeded its official figure by an impressive 32%, and is arguably a striking looking and beautifully made vehicle.

But does efficiency in an EV matter? Is an EV always so much better, and its carbon dioxide (CO2) commensurately so much lower, than a typical internal combustion engines (ICE), that efficiency is of secondary importance?
Considering a recent paper in Nature Sustainability from March 2020 by Florian Knobloch et al entitled ‘Net emission reductions from electric cars and heat pumps in 59 world regions over time’, a typical EV in the US emits CO2 of around 354 g/mile (over an average life of around 93,000 miles), of which approximately half is accounted for by the electricity in the usage phase. So, 177 g/mile can be put down to electricity production, distribution, consumption and attendant storage and charging losses. Let’s assume for the purposes of this document that the Taycan is similar to this average vehicle.
A near equivalent pure ICE is the Porsche Panamera 4, which has tailpipe CO2 of 407 g/mile from the US Environmental Protection Agency’s (EPA) fueleconomy.gov website. According to ‘Understanding the life cycle GHG emissions for different vehicle types and powertrain technologies’ by Ricardo from August 2018, the tank-to-wheel CO2 of a typical ICE is 65% of total lifecycle CO2 (taking the middle of the 60-70% range quoted), implying total CO2 over the life of the vehicle of 626 g/mile. Therefore, the EV emits approximately 57% less during usage and 43% less total CO2 than the ICE, based on typical emissions from electricity production.
In addition to this, the EV is undoubtedly superior to the ICE on tailpipe nitrogen oxides (NOx), carbon monoxide (CO) and particulate mass (PM) for an obvious reason. Even so, from Emissions Analytics’ testing the ICE would only emit 21 mg/mile of NOx, 2.5 g/mile of CO and typically about 0.5 g/mile of PM, well below the regulated limits.

If we then factor in non-tailpipe emissions, the picture begins to change. Of these, the large majority, perhaps up to 90%, comes from tyre wear abrasion, so we will focus on these. Brake wear should not be completely ignored due to the chemical composition of the particles, but the regenerative braking advantage of EVs will decline as hybridisation makes such braking widespread among ICEs. Previous Emissions Analytics’ newsletters on tyre wear (https://bit.ly/39UHbX4 and https://bit.ly/3c36urq) have shown that this can be a combination of coarse and ultrafine particles. According to ‘Wear and Tear of Tyres: A Stealthy Source of Microplastics in the Environment’ published in the International Journal of Environmental Research and Public Health in 2017, a large car (with a mass of around 3,300 lbs) will typically emit 26 mg/mile of PM. Further, this paper suggests that PM emissions increase proportionately with vehicle weight.
Therefore, we can deduce the total (tailpipe and non-tailpipe) PM emissions for both Porsches, as show in the table below. To this, for comparison, we have also added the Porsche Panamera 4 e-Hybrid and Tesla Model S. The basis of the calculations are described in the footnote.

It is clear that non-tailpipe PM emissions exceed those from the tailpipe, which is not surprising as tyre wear increases with the weight of the vehicle, other things being equal, and EVs are heavy. Meanwhile, tailpipe PM from ICE vehicles has fallen greatly, whether they have unfiltered gasoline or filtered diesel engines.
So, if a buyer switches from the Panamera ICE to the Taycan, the 43% reduction in CO2 emissions and zero tailpipe emissions is balanced by an 19% increase in PM emissions and a doubling in purchase price ($185,000 compared to $91,800). The hybrid occupies the intermediate position, delivering a 25% reduction in CO2 for the price of 17% higher PM and an extra $12,000 purchase price. The higher efficiency and slightly lower weight of the Tesla means that it delivers a reduction in CO2 of 60% for only a 14% rise in PM emissions and a 13% reduction in purchase price, although it concedes on maximum power and torque.
This analysis does not include the effect on particle number (PN). However, the report from the UK Government’s Air Quality Expert Group (AQEG) in July 2019 suggested that PN emissions could increase by up to 1.8% points for every 10 kg increase in the vehicle weight. That would imply that the Taycan would have 50% higher PN emissions than the Panamera ICE. If true, it would have a significant air quality impact because PN highlights the ultrafine particles that mass measurement misses, and it is ultrafines that may prove to be more problematic for human health.
The trade-off between lifecycle (LCA) CO2 and PM is shown in the chart below.

In summary, we can see a clear trade-off between climate-change-related and air pollutant emissions, and cost, which is reminiscent of the historical trade-offs between different ICEs. We also can see that there are material differences between different electrified vehicles. What this means is that discrimination between vehicles should be based on total real-world emissions and fuel economy, rather than asserting blanket technology preferences. The coming battle between EVs will be on the basis of energy efficiency, vehicle weight and tyre quality, which, in combination, will allow shifts towards Pareto superior combinations of CO2 and pollutant emissions. We accept that this is only a snapshot, but chosen to illustrate what we believe is a much wider pattern.
Emissions Analytics has been considering all these different elements to give a rounded view on environmental footprint. The first point to make is that the result differs materially between different models, so working at the level of generic groups can be hazardous. Second, many of the areas suffer from limited available data, either through scarcity or it being proprietary to manufacturers or suppliers. Specifically, we are conducting more testing to quantify both the PM and PN emissions – tailpipe and non – from a range of vehicles of different weights in real-world conditions.
If the first modern internal combustion engine spluttered into a smoky existence in 1876 (Nikolaus Otto), equally it is true that the first lithium ion batteries only made it to a commercially viable form in 1991, following intensive investment by Japan’s Sony corporation over ten years, under the leadership of 2019 Nobel Laureate Dr Akira Yoshino.
The rapid rise of electric vehicles, whether battery or hydrogen fuel cell, is indisputably the most important technology change occurring since the advent of the car over a century ago, and amounts to no less than its reinvention for the coming century.
Yet the revolution remains youthful and the technologies are comparatively new in any meaningful sense (we take account of pioneering EVs over one century ago – but they were not pursued as Ford got going and liquid fuels prevailed). Exxon developed fully scaled electric cars in the 1970s in response to the oil price shock, but they never took off. This is worth remembering in 2020.
The Exxon battery programme was led by M. Stanley Whittingham (also a 2019 Nobel Laureate), but the batteries proved unstable. However, what killed the programme off wasn’t just vehicle fires but the oil price, which fell after its calamitous rise earlier in the decade.
In light of the very recent oil price collapse, governments and car makers alike are about to be tested as never before for their commitment to electrification, a timely reminder that young and comparatively expensive technologies do not succeed in a bubble protected by virtue but have to fight for their existence against incumbent technologies that are proven and comparatively cheap.
Against that, the few moving parts of EVs and the existing experience of fleet operators point to exceptionally low maintenance costs and enhanced longevity.

What makes a great car is a question that has been blown wide open with competing technologies, but you can rest assured that Emissions Analytics is committed to technology neutrality, real-world testing of the many variables that define overall vehicle performance and dispassionate assessment for consumers and industry alike. The rapidly developing EV landscape is a source of intense interest to us and we welcome it. But, please, let us once and for all agree: there is no such thing as a zero emission vehicle.
*Footnote
The calculation of LCA CO2 emissions for the Panamera ICE and the Taycan are described in the main text. The value for the Panamera hybrid is approximated by calculating an average of the construction/battery phase of the Panamera ICE and the Taycan, weighted 85%/15% reflecting the relative battery size of the hybrid compared to the EV. In other words, the hybrid is considered a mixture of ICE and EV. To this, the EPA tailpipe CO2 value is added. The LCA CO2 of the Model S is calculated by adjusting the usage phase of the Taycan according to the greater efficiency of the Model S, with unchanged construction/battery phase. The calculation of the non-tailpipe PM is also covered in the main text. The values for the four vehicles are calculated as linear and proportionate extrapolations from the benchmark 3,300 lb large car with 26 mg/mile tyre wear emissions.

Fueling the Future podcast: Tires Not Tailpipe
Our Founder & CEO Nick Molden was delighted to be invited onto the Fueling The Future podcast to take part in a discussion with Tammy Klein of Future Fuel Strategies about non-exhaust emissions in vehicles.

Our Founder & CEO Nick Molden was delighted to be invited onto the Fueling The Future podcast to take part in a discussion with Tammy Klein of Future Fuel Strategies about non-exhaust emissions in vehicles.
Click below to hear the podcast:
You can also subscribe to the Fueling The Future podcast on iTunes by clicking here.
Construction: the neglected source of urban emissions?
Emissions data on construction equipment is scarce, often out-of-date and gathered in unrealistic conditions. These machines fall within the generic category of non-road mobile machinery (NRMM), or ‘off-road’.
Real-world emissions test results from building sites
Emissions data on construction equipment is scarce, often out-of-date and gathered in unrealistic conditions. These machines fall within the generic category of non-road mobile machinery (NRMM), or ‘off-road’.
This segment of machinery is often overlooked in preference for passenger cars or heavy goods vehicles, but, like non-exhaust emissions, it is a source of growing importance to urban emissions. As wider exhaust emissions are brought down, so the share from construction sites may well rise as a proportion of the whole. Regulations in this area have lagged behind heavy-duty goods vehicles, while there remain many older engines in service – 25% of the registered London fleet in 2019.

To understand the situation better, Emissions Analytics, together with Kings College London, conducted an extensive real-world field test on 30 different construction machines, including nine different types ranging from static generators to telehandlers and excavators.
The 2016 London atmospheric emissions inventory estimates that the construction sector contributes 34% of the total PM10 (including fugitive dust), 15% of PM2.5 and 7% of the total nitrogen oxides (NOx) – the largest, third largest and fifth largest sources, respectively.
It can be seen immediately that construction sites are an important part of any regulatory effort to improve urban air quality.
The purpose of our field test mirrored the approach we have taken with other classes of vehicle, namely to compare regulatory standards with real-world emissions, premised on the possibility that real-world emissions are typically higher than their laboratory counterparts.
The results of our extensive field test can be summarised as follows:
Absolute improvements are clear from construction equipment certified to the latest regulatory stage, resulting mostly from deployment of better engine management and after-treatment technology.
Exceedances of certification values were observed, although were not as widespread as with light-duty vehicles before the introduction of Real Driving Emissions testing.
Significant variability exists between machines.
Emissions are sensitive to engine load.
Across the board we found that the highest NOx emissions were from older construction machines, typically Stage III-A and III-B, but which reduced in the newer Stage IV engines owing to more advanced engine management systems and exhaust after-treatment, as shown in the left-hand chart below. Average Stage VI emissions are down 78% on the prior stage.

However, we also found that Selective Catalytic Reduction (SCR) systems could be better. They perform poorly when an engine is left to idle for longer than ten minutes, whereupon the exhaust temperature falls below 200 degrees Celsius, which explains many of the high conformity factors among Stage IV machines shown in the right-hand chart above. However, it should be emphasised that a conformity factor above 1.0 does not necessarily entail any non-compliance as these tests were undertaken on machines performing routine work rather than according to the mandated test cycle for certification.

The issue of falling exhaust temperature can be seen in this example of a 129kW excavator operating with regular 15-minute idling periods. The instantaneous NOx emissions and exhaust temperature are shown in the graph below. During idling, the exhaust temperature falls and then on resumption of work there is a large spike in NOx emissions. Overall, the exhaust temperature is below 200 degrees Celsius for 42% of the time. This demonstrates the importance of careful thermal management of after-treatment systems to ensure low real-world emissions.

Another aspect concerns generators, which typically being ‘static’ are overlooked as NRMM. In fact they comprise 5% of the London fleet of NRMM and have a fundamental role to play on almost every construction site. While in London they only needed to be type-approved to Euro Stage III-A historically, with no exhaust after-treatment to control for NOx or particle emissions, approval to the new Stage V is required from 2020.
We also found that numerous generators exceeded their regulated limits for NOx emissions. The 80, 200, 320 and 500 kVA generators were 1.25, 1.08, 1.58 and 1.46 times their respective EU Stage III-A NOx emission standards. The 320 and 500 kVA generators emitted above their standards at all loads, while the others showed the worst performance at low and high loads.
On a positive note, the generator we tested that had been retrofitted with SCR yielded an 85% reduction in NOx emissions. While this wasn’t good enough to comply with Stage V emissions, it represented a strong reduction in emissions at all engine loads: on the ISO 8178 test cycle they fell from 6.03 g/kWh to 0.95 g/kWh. We found that the introduction of an exhaust filter reduced particle number by two orders of magnitude and to within the future Stage V particle number limit of 1 x 10¹² # per kWh.
By the nature of the ISO 8178 test, it is possible to plot the NOx emissions against the load demand on the generator, as shown in the chart below.

In all cases, there is a characteristic U-shaped relationship, with the lowest emissions per unit of work done occurring between 25% and 50% of maximum load. The lowest emissions on average were seen on the mid-size, 200kVA, generator, although it obviously had power limits at the top end. These results illustrate the benefit in choosing the best sized generator for a given task: too small and the emissions are higher as well as the lack of top-end power; too large are the emissions are also higher.

In summary, there are some echoes, but less extreme, of the issues of NOx exceedances for passenger cars in this test work on construction equipment and generators. Overly-downsized engines and poor after-treatment calibration in both cases can lead to elevated emissions. However, these results show significant progress in NOx reduction at Stage IV, and early evidence is showing further improvements at Stage V. The focus here has been on NOx as our results show few exceedances on particle emissions – again similar to passenger cars since the Euro 5 regulatory stage.
Putting this in the wider context of greenhouse gas emissions, although there are no CO2 standards for non-road machinery, cities are likely to be conscious of any trade-offs between better air quality and climate change effects. Indeed, our tests show a 9% increase in CO2 emissions from Stage III-B to Stage IV, although that comes after a 40% reduction from Stage III-A to III-B. This shows that the perennial tension and trade-offs in controlling different pollutants, and will continue to provide policy dilemmas that can only be resolved by use of real-world testing.

Press Release: Pollution From Tyre Wear 1,000 Times Worse Than Exhaust Emissions
Pollution from tyre wear can be 1,000 times worse than what comes out of a car’s exhaust, Emissions Analytics has found.

Tight regulation of exhaust emissions by the EU has meant that new cars emit very little particle pollution
But tyre wear pollution is unregulated and can be 1,000 times worse, finds independent real-world testing experts Emissions Analytics
Increased popularity of SUVs, larger and heavier than standard vehicles, exacerbates this problem – as does growing sales of heavy EVs and widespread use of budget tyres
Fitting only high-quality tyres and lowering vehicle weight are routes to reducing these ‘non-exhaust emissions’
Oxford, 6th March 2020: Pollution from tyre wear can be 1,000 times worse than what comes out of a car’s exhaust, Emissions Analytics has found.
Harmful particle matter from tyres – and also brakes – is a very serious and growing environmental problem, one that is being exacerbated by the increasing popularity of large, heavy vehicles such as SUVs, and growing demand for electric vehicles, which are heavier than standard cars because of their batteries.
What’s more, vehicle tyre wear pollution is completely unregulated, unlike exhaust emissions which have been rapidly reduced by car makers thanks to the pressure placed on them by European emissions standards. New cars now emit very little in the way of particulate matter but there is growing concern around ‘non-exhaust emissions’.
Non-exhaust emissions (NEE) are particles released into the air from brake wear, tyre wear, road surface wear and resuspension of road dust during on-road vehicle usage. No legislation is in place to limit or reduce NEE, but they cause a great deal of concern for air quality.
NEEs are currently believed to constitute the majority of primary particulate matter from road transport, 60 percent of PM2.5 and 73 percent of PM10 – and in its 2019 report ‘Non-Exhaust Emissions from Road Traffic’ by the UK Government’s Air Quality Expert Group (AQEG), it recommended that NEE are immediately recognised as a source of ambient concentrations of airborne particulate matter, even for vehicles with zero exhaust emissions of particles – such as EVs.
To understand the scale of the problem, Emissions Analytics – the leading independent global testing and data specialist for the scientific measurement of realworld emissions – performed some initial tyre wear testing. Using a popular family hatchback running on brand new, correctly inflated tyres, we found that the car emitted 5.8 grams per kilometer of particles.
Compared with regulated exhaust emission limits of 4.5 milligrams per kilometer, the completely unregulated tyre wear emission is higher by a factor of over 1,000. Emissions Analytics notes that this could be even higher if the vehicle had tyres which were underinflated, or the road surfaces used for the test were rougher, or the tyres used were from a budget range – all very recognisable scenarios in ‘real world’ motoring.
Richard Lofthouse, Senior Researcher at Emissions Analytics said: “It’s time to consider not just what comes out of a car’s exhaust pipe but particle pollution from tyre and brake wear. Our initial tests reveal that there can be a shocking amount of particle pollution from tyres – 1,000 times worse than emissions from a car’s exhaust.
“What is even more frightening is that while exhaust emissions have been tightly regulated for many years, tyre wear is totally unregulated – and with the increasing growth in sales of heavier SUVs and battery-powered electric cars, non-exhaust emissions (NEE) are a very serious problem.”
Nick Molden, CEO of Emissions Analytics said: “The challenge to the industry and regulators is an almost complete black hole of consumer information, undone by frankly out of date regulations still preoccupied with exhaust emissions. In the short term, fitting higher quality tyres is one way to reduce these NEEs and to always have tyres inflated to the correct level.
“Ultimately, though, the car industry may have to find ways to reduce vehicle weight too. What is without doubt on the horizon is much-needed regulation to combat this problem. Whether that leads to specific types of low emission, harder wearing tyres is not for us to say – but change has to come.”
ENDS
Media contact
For all media inquiries please contact Sam Hardy on +44 (0)7815 863968, or via media@emissionsanalytics.com
About Emissions Analytics
Emissions Analytics is the leading independent global testing and data specialist for the scientific measurement of real-world emissions and fuel efficiency for passenger and commercial vehicles and non-road mobile machinery. Emissions Analytics seeks to bring transparency to a confused market sector. It publishes the EQUA Index of real-world driving emissions, and works with clients around the world to establish accurate emissions measurement and data requirements.

Low Emission Bus Trial in the Republic of Ireland
One of the big contributors to poor urban quality, both for nitrogen oxides (NOx) and particulates has historically been bus fleets.

One of the big contributors to poor urban quality, both for nitrogen oxides (NOx) and particulates has historically been bus fleets. However, Emissions Analytics’ experience across multiple types of vehicle, from light- to heavy-duty, has been that performance can differ markedly from model to model of seemingly similar technologies, and also between official figures and the reality of performance on the road.
To improve urban quality, Ireland’s National Development Plan committed the country to stop purchasing diesel-only buses for the urban public fleet by July 2019. To ensure that it make the best purchasing decisions in order to achieve that objective in the most effective way, the Irish Department for Transport, Tourism and Sport (DTTAS) commissioned Emissions Analytics to test eleven different types of bus in realistic conditions in Dublin and Cork. Emissions Analytics’ independence ensured that unbiased, real-world data could be gathered, rather than relying on existing third-party information.
The test equipment proposed by Emissions Analytics, largely relied on a Portable Emissions Measurement System (PEMS) from Sensors, Inc of the USA. The unit was certified to the standards required when used for official certification in Europe, even though these tests were not regulatory tests. The equipment passively measures both the flow of gas and pollutant concentrations from the bus tailpipe.
The buses tested ranged from existing diesels on the fleet such as the 2008 and 2013 Volvo B9TL, and the 2018 Mercedes-Benz Citaro BlueTEC 6, through to a new diesel Wrightbus Streetdeck Hybrid and a new Scanio Enviro 400 CBG powered by natural gas. Also covered were retrofits to these existing Volvos to understand the effectiveness of the after-market installations of Selective Catalytic Reduction (SCR) systems aimed at reducing NOx emissions.
Together with DTTAS and consultants Byrne Ó’Cléirigh (BOC), Emissions Analytics designed test cycles on the road of Dublin and Cork, based closely on existing bus routes. As the buses were tested when not in public operation with passengers, it was necessary to mimic the behaviour around regular bus stops to ensure that the average speeds and dynamicity of the cycles mirrored as closely as possible the reality of typical live operation. Taking this one step further, results were gathered for ‘cold start’ operation, where emissions are typically higher as the bus is warming up from cold, and also during regeneration of the diesel particulate filter, which similar leads to heightened emissions.
While the focus was on reducing pollution from NOx and particle emissions, the test programme covered a wider range of measurements to give a more holistic view. Other pollutants measured were carbon monoxide and, where relevant, total hydrocarbons. Relevant to the greenhouse gas agenda, carbon dioxide was measured, from which, using the carbon balance methods, the fuel consumption was derived. In this way, a rounded view on pollution and operation cost was formed, thereby ensuring that decisions around reduction of certain pollutants did not lead to unintended other consequences.
The final report detailing the findings from the trial has now been published.
Tyres Not Tailpipe
Why low tailpipe particle emissions may now be dominated by tyre wear.
Why low tailpipe particle emissions may now be dominated by tyre wear.
When you think of vehicle emissions, you naturally think of the exhaust pipe. Think again.
The newest internal combustion engine vehicles are achieving pollutant emission levels so low they are hard to measure. Yes, significant carbon dioxide still comes from the exhaust, but this does not affect urban air quality.
Arguably the biggest source of pollutant emissions from new vehicles now comes from non-exhaust sources, especially brake and tyre wear. This newsletter concentrates on the latter, as tyres are likely to be a large and growing source as consumers switch to bigger and heavier cars. Research shows they contribute to microplastic marine pollution, as well as air pollution from finer particles.
And this source of pollution is currently unregulated.

The 2019 report Non-Exhaust Emissions from Road Traffic by the UK Government’s Air Quality Expert Group (AQEG) recommends “…as an immediate priority that non-exhaust emissions (NEEs) are recognised as a source of ambient concentrations of airborne PM, even for vehicles with zero exhaust emissions of particles.”
Non-exhaust emissions include physical road wear particles from vehicles eroding the surface, the re-suspension of existing particles lying on the carriageway, brake wear particles and tyre wear particles. Greater adoption of regenerative braking means that brake wear emissions may decrease. However, thanks to the high weight and poor aerodynamics of sport utility vehicles (SUVs) as well as the high weight and torque drive characteristics of battery electric cars (BEVs), tyre emissions are expected to increase. In the light of this, we have begun a broad tyre testing programme at Emissions Analytics.
Complementing this is our traditional expertise in exhaust emissions, which for the purpose of this newsletter will focus on diesel exhaust particulates and some further reflections on the particle emissions of gasoline engines.
Declining tailpipe emissions from diesels
If we tackle diesel vehicles first, the truth is that they have emitted very few particles, at least in relative terms, since the broad introduction of diesel particulate filters a decade ago. So long as this filter has not malfunctioned or been tampered with, emissions are low over typical driving cycles, even taking into account the significantly elevated levels during the periodic ‘regeneration’ of the filter where the accumulated particles are burned off.
Filters are so good that we have measured that in certain circumstances, when the ambient air is already polluted, a diesel car will tend to extract more particles from the air than it emits. Emissions Analytics worked with the leading European automotive publisher, Auto Motor und Sport, to test four recent models of diesel cars.
Considering one of the vehicles, a canister of high intensity particles was opened in front of the air intake on four occasions across 60 minutes while the car idled. Upon the canister being opened, the particle number soared tenfold in the ambient air, but the corresponding exhaust count remained largely flat throughout the hour, with even a slightly declining trend.
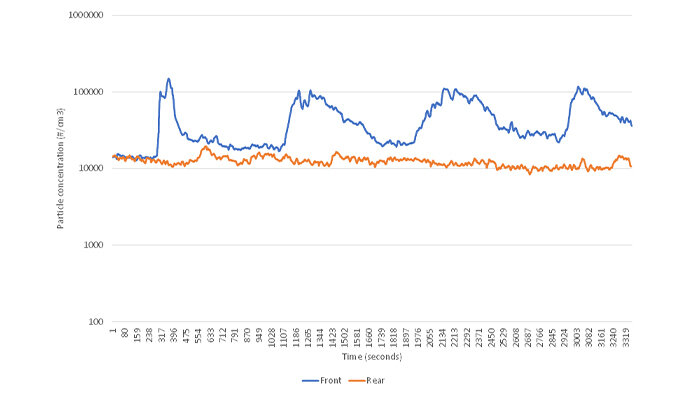
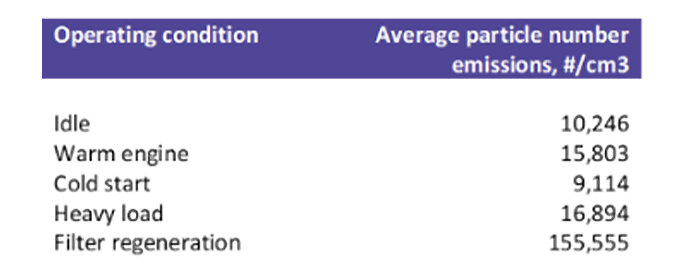
Then we ran on-road tests across the four vehicles, measuring exhaust particles from cold start, at neutral idle, with a warmed-up engine, under heavy load and finally during the filter-regeneration process. The test data was then analysed into illustrative trips of 300, 30 and 3 kilometres to simulate highway, commuting and local errand duty cycles:
Long Distance: 300km, average 60km/h, idling 10%, warm engine 70%, cold start 5%, heavy load 10%, filter regeneration 5%
Middle Distance: 30km, idling 10%, warm engine 40%, cold start 20%, heavy load 10%, filter regeneration 20%
Short Drive: 3km, cold start 100%.
The average per-second tailpipe emissions in the various operating modes across the four vehicles were:
The standout result, which we did not anticipate, is that the net contribution of each car to particle pollution rests primarily on the ambient air, reflecting the dynamic way in which a car ingests air as well as exhausts it.
On a polluted day where ambient concentrations of particles are already high at 50,000 #/cm3, the vehicles remove on average 27,984 particles per second of operation. Conversely, on a clean air day when ambient concentrations are 10,000 #/cm3, all four vehicles are net polluters but at low levels in relative terms, averaging emissions of 12,016 particles per second of operation. This was across the 300km drive cycle.
During the 30km, middle-distance test with filter regeneration, all four cars are net polluters except on the dirtiest days for two of the vehicles. The latter detail is an important measure of the still relatively low absolute levels of particle emissions, albeit higher by a factor of 10 compared to normal operation.
For the ‘short errand’ 3km drive, the filters work exceptionally well. A completely cold particle filter is not inhibited, unlike SCR systems, which are highly sensitive to operating temperatures. On the ‘short errand’ route two of the vehicles were ‘net cleaners’ even on a ‘clean air’ day.

Note: negative figures indicate net cleaning of the air, and are marked in green.
Note that we are here making no comment about nitrogen oxides (and other gaseous) emissions from diesel vehicles, or the stark reality in many cities of a considerable stock of older, non-filtered diesels that are often very high particle emitters.
Recognising therefore that we have only tested one element of the overall diesel equation, nonetheless these tests raise important questions for the industry at a pivotal moment in drivetrains. To broaden the analysis, we must also consider gasoline particulate emissions, which have risen steeply as port-injection engines have been replaced by direct injection engines in an attempt to reduce CO2 emissions. This technology, which has been around since at least 2007, has become the norm rather than the exception.
Gasoline particulate emissions
In contrast to Port Fuel Injection (PFI) engines, Gasoline Direct Injection (GDI) engines have higher compression ratios and lower charge temperatures, delivering various efficiencies including lower fuel consumption. However, they are also responsible for increased fine and ultrafine particle emissions1. From our testing, the average PN emissions from GDI engines are more than five times higher than PFI engines: 1.3 x 10¹¹ #/km compared to 0.3 x 10¹¹ #/km respectively, both under warm start.
This matters hugely, given that in the four years that have followed the start of the VW ‘Dieselgate’ scandal in September 2015, diesel registrations across Europe have fallen from a peak market share of 51% in 2015 to below 30% by the end of the third quarter of 2019, according to the European Car Makers Association, ACEA. Simultaneously, there has been a shift in the complexion of gasoline engines towards GDIs, which now make up approximately half of the market.
While the balance of non-diesel sales has fallen to alternative fuel, hybrid and electric vehicles, and gasoline cars, 3rd Quarter sales in Europe in 2019 showed gasoline cars still outselling full battery electric cars by 29:1. Gasoline now accounts for 59.5% of the European market, while all the other alternative, non-diesel categories (electric, hybrid, mild hybrid and natural gas) only amount to 11.3% 2 .

The subject of gasoline exhaust emissions is a complex one, and under Euro 5b (since September 2011) the European limit of 4.5 mg/km PM (mass) and 6.0 x 10¹¹ #/km PN (number) has resulted in some but not all gasoline models being fitted with particulate filters. We should note that the nature of particles emitted by diesel vehicles and gasoline vehicles is slightly different. In general particles from GDI engines, while high in number are really quite small – and indeed it’s looking likely that EU legislation will move from 23nm diameter to 10nm to take this into account. Diesel particles are of the order of 100nm. These sizes are still tiny compared to the more familiar PM2.5 and PM10, which refers to micrometre values. PM10 represents the coarser particles around one-tenth the width of a human hair – 10 micrometres is equal to 10,000nm. Even the often referred to “fine particles” of PM2.5 can be up to 2,500nm in size.
If we are correct about this, there has been a sharp increase in potentially dangerous ultrafine particles as a consequence of the widespread adoption of direct injection gasoline engines plus a market swing back to gasoline. This increase in ultrafines has only recently been policed with the introduction of the Real Driving Emissions regulation.
Comparison to tyre wear emissions
While this has been going on, tyres have not been regulated at all for their emissions, and are believed to have become a leading source of non-exhaust emissions and of broad concern whether considered as an airborne source of pollution or as a watershed microplastic. Non-exhaust emissions are believed to constitute today the majority source of primary PM from road transport, 60% of PM2.5 and 73% of PM10 [DEFRA, 2019].
How to explain these figures, which seem inexplicably high?
In our initial tyre testing we began with a basic mass loss approach, hypothesising that an average tyre might shed an estimated 1.5kgs over a 30,000km life. In respect of the 200-mile (320km) test we conducted, this equates 16g in mass loss over that distance. Quadrupling the figure to account for four tyres, and dividing by 320 gives a theoretical per km mass loss of 0.2g (200 milligrams), already 44 times more mass loss per kilometre than is permitted in the current exhaust regulation (4.5 mg/km).
To our surprise, in real-world testing we found that tyre wear can be much, much higher than our starting hypothesis – as shown in our previous newsletter. As we were originally concerned that the mass loss levels would be too small to measure, we stacked the decks by choosing the cheapest tyres, ballasted the car heavily, chose a track with average surface quality and designed a test cycle with high speeds and much cornering.

Driving a 2011 VW Golf 320kms at high road speeds on the track resulted in a mass loss of 1,844g which equates 5.8g per km. This was 29 times worse than our hypothesis, and partly explained by our deliberate quest for a ‘worst case scenario’. It should be noted that the driving and vehicle payload would be aggressive but legal if conducted on the public highway.
Nevertheless, it is a very high figure: 5,760mg/km of completely unregulated tyre wear emission versus regulated exhaust emission limits of 4.5mg/km – a factor of over 1,000. And while we sought a worst-case scenario it could have been worse still. As safety organisations repeatedly note the real ‘real world’ is one in which tyres are routinely underinflated, increasing wear, whereas ours were inflated exactly to their correct levels; rough surfaces abound in many countries; speed limits are broken and budget tyres have flooded the market for years.
One objection to this may be that this lost tyre mass is mostly large particles which fall rapidly to the ground, whereas the tailpipe emissions are mostly ultrafines that hang in the air. It is true that most of the tyre mass was at the top end of the measured size range (PM10 or up to 10,000nm), and the tailpipe particles are mostly below 100nm. However, the tyre wear emissions also included a high number of particles down to 10nm, as a result of volatilisation of the tyre material due to heat in the tyres. Therefore, tyres shed material that both leads to microplastics in the watercourse, and ultrafines that compromise air quality.
Future trends
As the UK’s AQEG notes, that while regenerative braking is expected to reduce brake wear emissions, the increased weight and inefficiency of SUVs and battery electric vehicles will likely be associated with increased tyre wear, road wear and resuspension. The AQEG also goes further in speculating that a possible technological mitigation method for reducing tyre emissions would be ‘mandating formulation of low-wear/low-emission tyres, brake pads and road surfaces.’
We think it will go much further than that. New problems prompt new solutions, some of which are already at hand. There is a world of difference between high quality tyres and low quality tyres, for one thing; and the persistent bias of the industry currently towards aggressively-tyred high performance BEVs is partly an effort to market them to a still sceptical public, a trend that will moderate as BEVs become more accepted and efficiency rises to the surface. Driver style and the extent to which power electronics can moderate torque delivery is another evolving dynamic.
The challenge to the industry and regulators is an almost complete black hole of consumer information undone by frankly out of date regulations still preoccupied with exhaust emissions.
This flies in the face of current trends towards heavy SUV-bodied BEVs sporting traditionally wide, low profile tyres, compared to a much tinier subsection of BEVs in the marketplace that prize efficiency and refinement over looks and ultimate performance.
For now, tyre emissions are a wholly unregulated aspect of motoring, but we greatly doubt that this will remain the case. If tyres are shedding even a fraction of 5.8 g/km we have measured, and more than 1,000 times tailpipe emissions, this subject must be taken seriously.
1 Raza, Mohsin, Longfei Chen, Felix Leach and Shiting Ding. A Review of Particulate Number (PN) Emissions from Gasoline Direct Injection (GDI) Engines and Their Control Techniques. Energies 2018, 11, 1417: p1.
2 2,120,988 gasoline cars were sold across Europe in the third quarter of 2019, compared to 73,137 battery electric vehicles – 29x more. Figures from ACEA.

Emissions Analytics Speaking at the International Vienna Motor Symposium
James Hobday will present ‘Managing Reputation and Emissions Compliance through Independent Testing’ at the International Vienna Motor Symposium in April.

James Hobday will present ‘Managing Reputation and Emissions Compliance through Independent Testing’ at the International Vienna Motor Symposium in April.
Now in its forty-first year, the event will bring together more that 1,000 decision-makers from the most important enterprises of the world’s automotive engineering industry.
Speaking at 11.45am on 24th April, James Hobday will look at how - using Emissions Analytics’ database of over 2,000 vehicle tests – emissions stakeholders can calculate risk ratings, identify weaknesses and benchmark between vehicles.
An increasing number of sources of compliance risk: homologation, conformity of production and in-service surveillance under Real Driving Emissions
Reputational and policy risk: media, consumer and political perception
How it’s not sufficient to hide behind flawed regulations (such as WLTP)
The need for a holistic view of pollutant emissions, carbon dioxide and fuel efficiency
The Emissions Analytics independent testing programme - covering hundreds of vehicles across three continents each year
How this data is analysed and available in a unique database that is accessed by a governments, industry and others
How EQUA Index helps manage these risks using the Emissions Analytics’ database of over 2000 vehicle tests, covering passenger cars, light commercial, heavy commercial and off-road
Calculating risk ratings, identifying weaknesses and benchmarking between vehicles
Registration for this event is open here.
If you’d like to discuss any of the above topics in more detail, then email James Hobday to book a meeting or call James on + 44 (0)207 193 0489.

Emissions Analytics Addresses Oxford Air Quality Meeting
Our Chief Executive, Nick Molden, is speaking at Keble College Oxford this Friday, 10th January 2020, at the Oxford Air Quality Meeting.

Our Chief Executive, Nick Molden, is speaking at Keble College Oxford this Friday, 10th January 2020, at the Oxford Air Quality Meeting.
The event has been established to draw together experts in vehicle emissions, air quality measurement, public health, and policy and features a key note speech from UK clean air champion, Professor Martin Williams of King’s College London.
Speaking at 11.30 am, Nick Molden will look at solving poor air quality quickly and fairly and how the consequences of ‘Dieselgate’ continue to cause market confusion at government, industry and customer levels.
The aim of the event is to facilitate interactions and discussions across a wide range of stake holders in the air quality field. Recent advances in real driving emissions measurement mean that greater understanding of roadside vehicle emissions is being developed. In addition, low cost air quality sensing and an increasing insight into how various pollutants effect humans mean that the evidence base is growing rapidly.
The Oxford Air Quality Meeting will bring together all of these groups, alongside policy makers to enable future improvements in air quality.
Those wishing to attend can register here

The Self-Poisoning Car
What is the capacity of a car interior to emit volatile organic compounds (VOCs) over the life of the vehicle?

Real-time emissions of volatile organic compounds in the cabin
Unlike tailpipe emissions, Vehicle Interior Air Quality (VIAQ) is lightly regulated. In the broad area there are existing ISO and SAE standards, and an active United Nations Economic Commission for Europe (UNECE) working group. Some countries have national standards, in particular Japan, Korea, China and Russia. There are 97 VOCs listed as hazardous air pollutants in Title III of the Clean Air Act Amendments of 1990. Overall, the arc of regulation is at an early stage, covers a limited number of pollutants, and has much lower priority and profile compared to the exhaust pipe post-Dieselgate. Nevertheless, the total health exposure of drivers is significant and under-measured.
VIAQ breaks down into three broad areas. The first concerns ingress of pollution into the cabin, especially particles. The second looks at the build-up of pollutants from human occupants, including carbon dioxide from respiration. The CEN standardisation workshop #103 in Europe1, initiated by the AIR Alliance and building on initial test work by Emissions Analytics, is considering these first two elements. The third area, and the subject of this newsletter is the car interior itself and its capacity to emit volatile organic compounds (VOCs) over the life of the vehicle.

What might be colloquially and informally referred to as ‘new car smell’ has typically been ignored, partly because it has been difficult to measure. Recent advances in instrumentation now allow the measurement of not only total, time-weighted average VOCs, but it can now distinguish between different species of VOCs in real time.
Emissions Analytics and Cambridge, UK-based Anatune have worked together to test this ‘new car smell’. The subject has a particular resonance in Asia. 11.2 per cent of buyers in China complained about the odours they found in their new cars, according to the 2019 JD Power China Initial Quality Study.
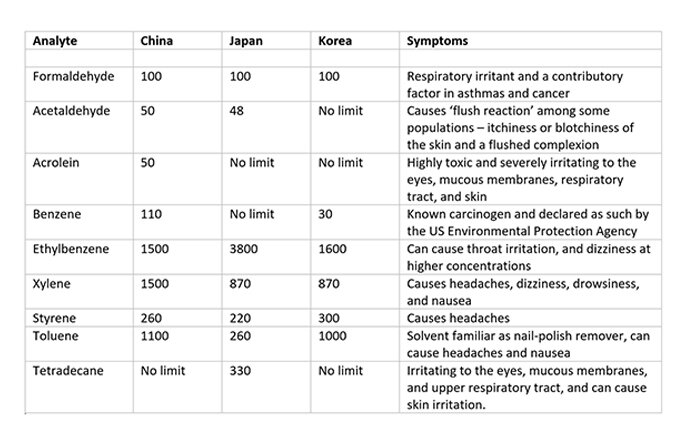
Car interiors, comprising dozens of separate materials ranging from natural textiles to synthetic polymers and adhesives, emit a wide range of VOCs, among them acetaldehyde. Symptoms that customers have cited range from sore eyes to nausea and headaches, and aggravated respiratory conditions.
Acetaldehyde is especially problematic, owing to the fact that many Asians possess a less functional acetaldehyde dehydrogenase enzyme, responsible for breaking it down. This regional genetic characteristic is one reason why the strictest regulation of VOCs exists in the key Asian markets China, Japan and Korea, and why manufacturers typically observe these regulations for cars that will be sold globally.
However, acetaldehyde is merely one of dozens of VOCs that a car produces. The sources are typically:
Residual compounds from the manufacturing process and material treatment of different interior components and textiles
Adhesives and carrier solvents that will de-gas – as much as 2kg of adhesive can be found in a modern car, much higher than in the past where mechanical riveting and bolting was more common
Degradation of cabin materials over the longer term as a result of oxidation, ultra-violet light and heat.
The following table sets out the regulated limits in key Asian countries, in micrograms per metre cubed, and the potential human symptoms from exposure.
In this testing, not only did we manage to isolate different VOCs, but we quantified their mass using SIFT-MS, a type of direct mass spectrometry that uses precisely controlled soft ionisation to enable real-time, quantitative analysis of VOCs in air, typically at detection limits of parts-per-trillion level by volume (pptv).
Anatune provides chromatography and mass spectrometry-related analytical solutions, in particular the deployment of SIFT-MS, which stands for Selected Ion Flow Tube Mass Spectrometry and is built by the Christ Church, New Zealand-based company Syft Technologies. One of the main advantages over existing instrumentation is that SIFT-MS measures multiple analytes in real time, akin to a rolling video compared to the ‘snap shot’ of traditional chromatography.
As with any technology, there is a trade-off with the more traditional technique of thermal desorption/gas chromatography (TD/GC) analysis, where VOCs are collected on sorbent tubes on an integrated basis. The SIFT-MS approach cannot distinguish every analyte, and the most effective way to operate the instrument requires ‘telling it’ what you are looking for in advance.
In an initial test of a one-year-old gasoline Hyundai i10, Anatune deployed the Syft Technologies’ Voice 200ultra.
The car was tested every 15 minutes for 60 seconds over five hours on an early summer’s day, where temperatures rose to 20 degrees Celsius (68 degrees Fahrenheit). The measured concentrations were expressed as the mean across the 60-second duration of the sample. For the final 15-minute vent cycle, the car windows were opened, the car started and the air conditioning run at full power. The SIFT-MS then sampled continuously using the above conditions for the full 15 minutes.
The two principle outcomes of the test concern the steady accumulations of ten VOCs as temperatures rose; and the unexpected dynamic of emissions during the final fifteen minutes.
Most noticeably, the common solvents methanol and acetone rose from very low base points (18 and 12 micrograms per cubic metre) to 935 and 576 μg/m3 respectively. The 52-fold rise in methanol is noteworthy. While it is a very common solvent and not directly regulated, it is toxic and could be an irritant at these levels.

The only exception to these across-the-board rises was benzene, which fell from 17 to 15 μg/m3. However, this is where the final fifteen minutes revealed unexpected results.
Despite windows being open and the air conditioning turned on, some VOCs such as acetaldehyde rose steeply during the fourth to sixth minutes. During this phase acetaldehyde concentrations rose from an initial base of approximately 50 to 550 μg/m3, more than ten times the regulated limit in China and Japan.

Anatune Senior Application Chemist and SIFT-MS Specialist Dr Mark Perkins hypothesises that the car’s Heating and Ventilation system (HVAC) may form a type of ‘sink’ for some VOCs. When the venting or AC are activated, the sink is flushed out into the cabin causing a pronounced spike. Three other analytes that rose in the same time frame included styrene, toluene and benzene.
From a vehicle testing perspective, the ability to detect and speciate different analytes in real time opens up the possibility for more extensive research of exposure and the potential for regulation to reduce detrimental health exposures. It could also assist driver education in respect of ‘VOC build-up’ when a vehicle is parked in hot weather.
Overall what this shows is that a four-hour, time-weighted average of total VOCs – the basis of existing regulatory testing – could be improved. Future regulations will need to cover individual materials in isolation as well as ‘whole car testing’, by which we mean the actual, real-world way in which the many materials comprising a car interior act dynamically with each other and within the HVAC system.
With so many new entrants into the global car manufacturing sector, and at a time of drivetrain and material changes often connected with light-weighting, there has never been a more critical juncture at which to take seriously chemical emissions that can harm vehicle occupants and are already the source of a high volume of complaints.
Regulations should reflect where there is market failure, in particular where a consumer does not realise or cannot do anything about the health exposure. ‘New car smell’ may be unpleasant to certain consumers, but there is little understanding of the health detriment. Acetaldehyde is one of the better understood VOCs in the cabin so far, which was prominent on the vehicle tested, and which should be considered for early intervention.
1 CEN Workshop 103 held its first meeting on 4 November 2019, chaired by not-for-profit organisation the AIR Alliance, whose co-founder is Emissions Analytics' founder and CEO Nick Molden.
Burning Issue: Tyres And Air Quality
Are tyres replacing tailpipe as the policy priority?
Are tyres replacing tailpipe as the policy priority?
Tyres are rapidly emerging as a new source of environmental concern and this will affect the car industry.
In a recently aired BBC radio documentary, it was claimed that the world will discard 3 billion tyres in 2019, enough to fill a large football stadium 130 times1. Beyond this broad issue of resource use and material waste, tyres also sit uniquely at the intersection of air quality and microplastics.
This newsletter sketches the problem in its current form and considers certain automotive developments in its light.
As a car drives by, you cannot see its tyres wearing and therefore ‘tyre wear’ in this sense remains imperceptible except in deliberately extreme use such as branches of motor sport such as drag racing and drifting.
Yet over a lifetime of between 20-50,000kms, a tyre will shed approximately 10-30% of its tread rubber into the environment, at least 1-2kgs2. The wear factor (defined as the total amount of material lost per kilometre) varies enormously depending on tyre characteristics such as size – radius/width/depth – tread depth, construction, pressure and temperature. In one recent Emissions Analytics’ test, conducted under real-world rather than lab conditions, the four tyres on a standard hatchback lost 1.8kg over just 200 miles of fast road speeds, far in excess of what had been anticipated by the testers.

A tyre abraids owing to the friction between its contact patch and the road surface. It ‘emits’ particles across a broad size spectrum, from coarse to fine to ultrafine to nanoscale. It may also emit other forms of aromatics such as benzopyrene and benzofluorene, the result of the incomplete combustion of organic matter resulting in evaporation of the volatile content of the tyres, which the EU has regulated to a degree3.
Coarse particles typically fall rapidly to the ground. At the fine level and smaller, they are airborne for a certain duration, either being blown away from the carriageway before settling on the ground, or falling to the carriageway where re-suspension may take place as other vehicles pass.
Particle dispersion and deposition eventually occurs, but that is not the end of the story. The particles typically pass into the watershed through street drainage and are estimated to be a primary source of as much as 28% of microplastics found in the marine environment4.
The recent re-characterisation of tyre wear emissions as ‘microplastic pollution’ corrects the broadly misleading public idea, out of date a hundred years and counting, that tyres are composed principally of natural rubber. Instead, tyres are a close derivative of crude oil and their wholesale pricing typically tracks it.
A typical car tyre comprises 45% oil-derived synthetic rubber (polymer), 40% oil-derived carbon-black (filler, 40%), and 15% various additives to aid production processes, some of which typically contain heavy metals and some of which are also oil-derived.
Some tyres contain natural rubber, but to all intents and purposes we live in the age of the plastic tyre.

For not unrelated reasons, we also live in the age of the disposable tyre. From being an expensive product derived in large part from natural rubber, tyres have fallen in cost as globalisation has catapulted numerous new entrant tyre-makers into what is today a $240bn a year industry.
If we now turn to the automotive world, tyres are more important than ever to vehicle attractiveness and performance, but for many different reasons:
An emphasis on vehicle and tyre performance is often at the price of tyre longevity, particularly where higher diameter wheel rim sizes are combined with wide tyres, whether to convey power or sportiness
Tyres have become more disposable as their price has fallen in real terms, replacing an older tradition of re-treading carcasses for extended life
New entrant tyre-makers in Asia, South Asia and Eastern Europe have led to the advent of the ‘budget tyre’
Electric vehicles offer instant torque and higher kerb weights, implying higher tyre wear rates, even while regenerative braking is expected to reduce brake wear emissions
Electrification leads to a completely new appraisal of the tyre in respect of durability and noise
In-cabin tyre noise becomes a high-concern consumer issue as drivetrain noise is reduced or eliminated.
From a regulatory viewpoint, tyres in Europe are labelled according to three criteria, (the so-called ‘performance triangle’): rolling resistance, wet grip and noise – but that may change as tyre environmental impact rises up the political agenda.
From our perspective, Emissions Analytics has been conducting in-depth real-world tests on tyres. Two immediate insights can be shared:
Budget tyres wear rapidly and have high emissions
New instrumentation capable of measuring emissions down to the nanoscale shows that at the ultrafine level and smaller, the particle mass becomes far less instructive than the particle number, which is much more significant, and yet current regulations only measure mass
The size distribution has potential implications for the epidemiology (health) concern around very fine particulate matter and how it may affect human health.
In one recent test, Emissions Analytics used a Dekati ELPI+ (Dekati® ELPI®+ Unit standard with 14 size fractions from 6nm up to 10um for PN/PM concentration at 1Hz/10Hz sampling rate) to measure both particle mass and number. The first chart below shows the resulting mass distribution.
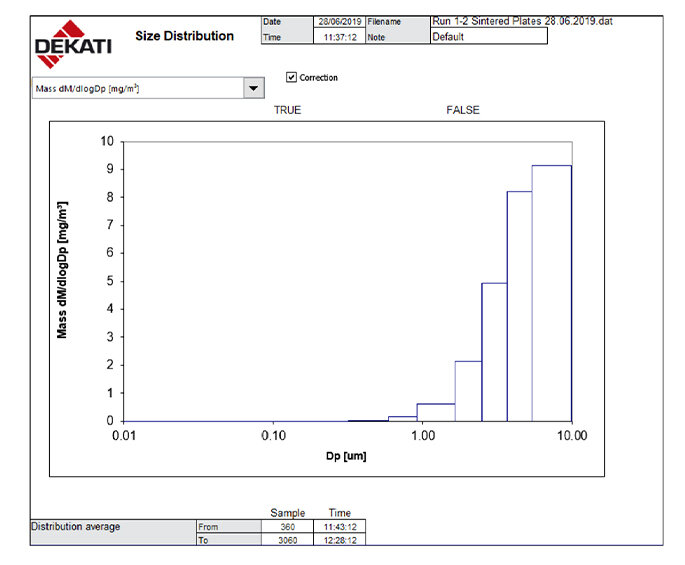
We regard this as a valuable piece of data even though it only corroborates what is broadly known, that a comparatively small number of coarser particles (up to and including the 10 micrometre size shown in the far right column, familiar as PM10) account for most of the recorded mass.
Then consider however the contrast when particle number is accounted for rather than mass: you get a mirror of the first graph, with a tiny amount of mass expressed as a very high number of nanoscale particles right down to the 10-nanometre level expressed in the first column (0.01 micro-metre).
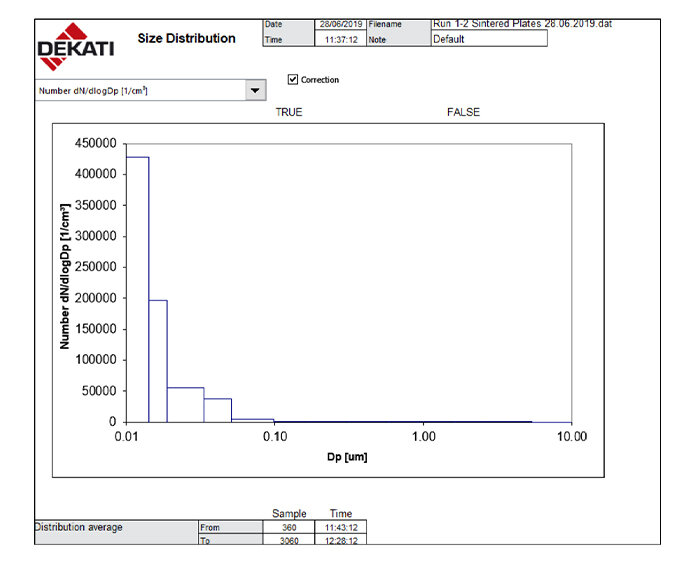
This is a potentially valuable insight because until now this high particle number count has typically either not been measurable or not been measured, owing to a regulatory preoccupation with mass and a lack of suitably sensitive real-time measurement instrumentation.
The ability to count particles down to 10 nanometres relies on the quality of the impactor chosen for this test, which is considered to be the best currently available on a commercial basis.
Regarding public health, there is a tentative emerging consensus among epidemiologists and other medical researchers that ultra-fine particles are potentially more injurious to human health than coarse particles, owing to their ability to translocate to the bloodstream through the lungs5.
Particles will need to continue to be measured both for their mass and their number. In respect of mass they are emitted in a large size range by tyres. In respect of number they emitted in high volumes.
We highlight the UK government’s recent report Non-Exhaust Emissions from Road Traffic, authored by the UK Government’s Air Quality Expert Group (AQEG). It recommends “as an immediate priority that non-exhaust emissions (NEEs) are recognised as a source of ambient concentrations of airborne PM, even for vehicles with zero exhaust emissions of particles.”
Quite apart from the broader point here that so-called ‘zero emission vehicles’ are in fact significant sources of non-exhaust emissions, the quantity of such emissions is set to rise.
The same UK government report notes that non-exhaust emissions are believed to constitute today the majority source of primary particulate matter from road transport, 60% of PM2.5 and 73% of PM10. While regenerative braking is expected to reduce brake wear emissions, the increased weight and torque characteristics of alternative drivetrains such as EVs will likely be associated with increased tyre wear.
In the same report it is suggested that a 10kg increase in vehicle mass accounts for a 0.8-1.8% increase in nanoparticle emissions from tyres. This is particularly relevant as a whole generation of new EVs is hitting the roads with considerably larger and heavier battery packs than in the past.
For small to medium cars, where modest range is acceptable for city use or where the glider (bare chassis) has been deliberately lightweighted to offset batteries (as per the BMW i3), the weight gain may be marginal. Indeed, a switch to narrow tyres may neutralise or even reduce tyre wear.
But a Tesla Model S or Model X, Mercedes EQC, Audi e-tron or Jaguar i-Pace, EVs with larger ranges and battery packs in the range of 60-100 kWh, weigh 2.3-2.6 tonnes. The 600kg battery pack in the Mercedes EQC would on the AQEG/DEFRA model potentially increase nanoparticle emissions from tyres by 48-108%, compared to a conventional vehicle weighing 600kg less.
The same argument can be extended to internal combustion engine vehicles. A heavier vehicle increases tyre wear, whereas lightweighting mitigates it. This has implications for the broader market trend towards SUVs, where often particularly large rim tyre sizes are adopted.
On this basis we think tyres are set to be scrutinised and regulated more, and perhaps also reinvented for electric cars to perform well in durability and noise. There will be opportunities and threats that arise from these changes.
We anticipate the need to place a value on low emission tyres, so that they are desired and consumers are willing to pay for them, in other words using a tax policy that internalises the externality to the benefit both of society and the environment.

1 Costing the Earth: Tread Lightly. BBC Radio 4, March 13th, 2019.
2 Grigoratos & Martini, 2014.
3 Since 2010 the EU has required the discontinuation of the use of extender oils which contain more than 1 mg kg−1 Benzo(a)pyrene, or more than 10 mg kg−1 of the sum of all listed polycyclic aromatic hydrocarbons in the manufacture procedure due to increased health concerns related to PAHs (European Commission, 2005).
4 Microplastics are considered to be all plastic particles in the range of 0.1–5,000 µm. A secondary source is when a larger plastic object breaks down once already in a marine environment. The figure of 28.3% was originally cited in Julien Boucher, Damien Friot, Primary Microplastics in the Oceans: a Global Evaluation of Sources, International Union for Conservation of Nature and Natural Resources, 2017, p21.
5 Newby, David: ‘Air Pollution and Cardiovascular Disease - A Mills and Boon Classic’ (2019).
Plug-In Hybrids Without Behavioural Compliance Risk Failure
Tensions between official EU emissions policy and member states.
Tensions between official EU emissions policy and member states.
When the Worldwide Harmonised Light Vehicle Test Procedure (WLTP) commenced in September 2017, it replaced the New European Driving Cycle (NEDC) with a more realistic, ‘real-world’ approach to emissions testing. Following this switch, several models of plug-in hybrid car (PHEV) were withdrawn from sale in Europe as their emissions ‘rose’ sharply under the new test, disallowing them from various subsidies and benefits. Yet interestingly a wide range of new PHEVs are now being launched, two years later.
The new crop of PHEVs are likely to have been optimised to the WLTP emissions test, and come with larger batteries in the range of 10-30kWh instead of previously 3-6kWh. This ensures that they achieve super-credit status, or sub-50g CO2/km emissions ratings, which initially allows them to be counted twice in the fleet average CO2 calculation. This is vital for manufacturers who have to meet impending fleet average emissions targets of 95g/km from 2020 or face large fines in Europe.

This strong incentive from the EU level directly clashes with some member state policies: national governments that have cancelled generous subsidies for all PHEVs. This group of policy makers are suspicious of PHEVs.
The Dutch government, followed by the British, in late 2018, withdrew previously generous PHEV subsidies. They cited evidence suggesting that many owners, attracted by a subsidy, rarely plugged in their PHEVs.
So what is going on and who is right? If a PHEV is not plugged in, it typically drives around on a smaller than optimal internal combustion engine and achieves poor real-world results.
Of all PHEVs tested by Emissions Analytics, which includes petrol and diesel versions, the average performance in this condition is 37.2 mpg (7.6 l/100km) and CO2 emissions of 193.3g/km, which is 62.5% worse than the official NEDC results.
By no stretch of the imagination are these compelling figures if, as EU policy makers would claim, the purpose is to reduce real greenhouse gases as quickly as possible.
That is not to say that PHEVs have no claim to virtue. Their primary strength is offering electrification without range anxiety, since an internal combustion engine remains present, whether as a part of the drivetrain or as a ‘range-extending’ battery generator.
However, one of the challenges for PHEVs is that by the nature of the technology, their performance cannot be properly encapsulated and articulated by the standard, cycle-based rating. Rather, the real-world performance of PHEVs rests to an unusually large degree on user behaviour and journey length, rather than instantaneous combustion performance.
Research studies have shown that some duty cycles – for example commuting to and from work every day but charging overnight and avoiding long distances – can result in virtually no use of the ICE. The consumer has in this case had an EV ‘on the cheap’, without the weight and cost of a large battery pack. This is a PHEV at its best.1
At the other end of the spectrum, a PHEV might be deployed on long journeys and never plugged in. This results in a significant disbenefit, the vehicle typically offering worse fuel consumption and emissions than a conventional ICE-only drivetrain. This is a PHEV at its worst.
While we can recognise that many current or potential PHEV owners understand that the electric driving share of a PHEV, expressed as its utility factor (UF), is the key to its fuel economy rating and emissions, nonetheless the Dutch data, based on fuel card usage, included a significant business user fleet where there was evidently no fiscal incentive to save fuel. These owners were hardly plugging in.2
In the study referenced in footnote 1, based on 1831 Chevrolet Volts in the US, the authors found generally excellent utility factors, the average being 78%. In the Dutch data, which included smaller-battery PHEVs and owners who typically didn’t bother to plug in, the average utility factor was 24%.
If we take this spread, 24-78%, as the real range of utility factor, and return to the Emissions Analytics average PHEV performance of 193g/km CO2, it can be re-expressed as spanning 151g/km CO2 (24% UF), to 46g/km CO2 (78% UF).
The effect of the WLTP has been to force model overhauls, leading to larger internal combustion engines, and larger batteries to achieve longer electric range.
This is precisely what happened with the Mitsubishi Outlander PHEV, at different times and places the leading PHEV in Europe. To achieve a sub-50g/km result under WLTP the manufacturer fitted a 2.4 litre petrol engine, replacing a 2.0 litre unit, and increased battery size from 12kWh to 13.8kWh. EV range fell from 33 miles under the NEDC to 28 miles under the WLTP, but crucially it allowed the SUV to retain a sub-50g rating (46g/km) as a category 2 Ultra Low Emission Vehicle.
The warning to policy makers is that current and future PHEVs offer most of the same strengths and weaknesses of previous models, and that car makers are optimising their products to achieve the sub-50g result under WLTP but without guaranteeing any actual reduction in emissions.
In a very recent instance one OEM, Peugeot, boasted of an SUV featuring 4WD and 300hp yet 29g/km CO2, premised on an electric range of 36 miles and a 13.2kWh battery. The 3008 SUV GT Hybrid4 qualifies in the UK for the lowest Benefit in Kind (BIK) tax rating of 10%, re-attracting a subsidy.
In another 2019 product launch, the Volvo XC40 T5 Twin Engine claims 262hp and a preliminary WLTP rating of 38g/km. In this instance some but not all variants of this model offer a ‘hybrid’ setting that tries to optimise overall efficiency, except that whether it is deployed or not sits with the owner. Such an innovation is likely to confuse regulators and consumers alike, even if it may also work well in practice.

Our position is that on reasonable assumptions PHEVs will deliver less and less certain reductions in CO2 than non-plug-in hybrids. In other words, that they are ineffective without behavioural compliance, and that such compliance is politically infeasible in most democracies where it would be considered an intrusion on privacy.
The case for future PHEVs may lie principally in the light to medium commercial fleet, where the advent of zero-emission city centres may force dual-drivetrain approaches, the pure electric drive share being saved for last mile delivery and the ICE (diesel as well as petrol) permitting long highway distances, refrigeration units and so forth.
Geo-fencing is also strongly foreshadowed in current fleet management, from public bus fleets to Uber’s app, and suggests a straightforward way to ‘enforce’ the correct use of a PHEV, thus compelling fleet operators to plug them in.
This would go a long way to addressing the ongoing weakness of the PHEV, its drivetrain sleight-of-hand that courts generous tax-payer subsidy but delivers poor real-world performance.
In the realm of private passenger cars, however, we have shown in a previous newsletter how by comparison non-plug-in, full hybrids offer much faster and more certain emissions reductions of up to 30%. Given the importance of reducing CO2 emissions agressively and quickly, the lower risk option may be preferable.
1 Patrick Plotz, Simon Arpad Funke, Patrick Jochem. ‘The impact of daily and annual driving on fuel economy and CO2 emissions of plug-in hybrid electric vehicles’ in Transportation Research Part A, 118 (2018) 331-340.
2 Ligterink, N.E., Eijk, A.R.A, 2014. ‘Update Analysis of real-world fuel consumption of business passenger cars based on Travelcard Nederland fuelpass data’, TNO Report TNO 2014 R11063.

The Promise Of Life Cycle Assessment And Its Limits
Approaches to comparative rating of vehicles.
Approaches to comparative rating of vehicles.
Life Cycle Assessment (LCA) is the principal way to achieve clarity over the environmental credentials of varying drivetrains, and may become the basis of primary legislation in Europe and beyond over the next decade.
The purpose of this newsletter is to consider how LCA can work in practice, bringing clarity to the automotive sector both as an efficient market, the producer of environmentally sensitive products and in respect of consumer choice, i.e. how vehicles might be rated and ranked for their ‘greenness’.

LCA has existed as a concept since the 1970s and is by now a well-established field of academic inquiry. Contrary to common perception in 2019, LCA is not necessarily about CO2 emissions and the climate ‘friendliness’ of one car over another, say diesel versus electric. LCA can equally apply to other impact categories such as social justice or supply chain efficiency, and indeed ‘non-climate’ environmental impact categories such as water use. It is a method for considering the total lifespan of a product, but the chosen theme and system boundaries can be many, and they can be divergent. It can be applied to any product and not just cars. Owing to their material and commercial complexity, cars are among the most challenging products to apply LCA to.
A useful historical note is to remember that a precursor of LCA was Technology Assessment (TA) in the US in the 1960s. The aim of this nascent philosophy was to brief Congress on the likely impact on society and economy of new technologies, to inform intelligent policy decisions.
LCA offers a not dissimilar service today. Conventionally, it relies on a modelling of a vehicle’s impact in four areas: fuel (from source to distribution); vehicle production, vehicle use and end-of-life.
Until recently the greatest emphasis was on the fuel because the use-phase of an internal combustion engine vehicle (ICEV) is the dominant source of emissions. With electrification, the emphasis has swung to vehicle production (batteries) and end-of-life (batteries), both about which there remains a lack of usable data. There is no utility scale automotive battery recycling, but it takes place on a small scale. Meanwhile, the estimate of embedded emissions from manufacture as a proportion of total emissions are 15-20% for a gasoline car, but 20-60% for a battery electric car. Recent studies have emphasised the larger figure in that wide range, citing not just the batteries but supporting, high emission components such as aluminium. Meanwhile the fuel question is displaced to the energy grid and looms large in any credible assessment of the environmental claims of EVs.
LCA also casts doubt on the industry’s claim that diesel is better than gasoline in climate terms. In fact a diesel car’s embedded emissions are higher than a gasoline car’s (the range of estimates is 20-30% versus 15-20%, respectively) thanks to the heavier engine block and typically greater emissions controls. Like an electric car it then has to ‘break even’ over its lifetime by offering lower in-use CO2 emissions.
It is worth noting that the academic field of LCA has already moved somewhat beyond these basic LCA applications even though they remain in their infancy and are not typically understood or applied by policy makers, consumers or even parts of the car industry. Current LCA trends are to move beyond product life cycles to consider user patterns and behavioural dimensions.
Rebound effects suffice here as a cautionary note. If a consumer saves fuel costs by buying an electric car, but spends the proceeds on a long-haul flight to the Caribbean, that’s a negative environmental rebound effect. Such whole system thinking demonstrates that beyond the application of LCA to cars there remain wider considerations, including the very desirability of private car ownership given projected global urbanisation rates, resource scarcity and the political imperative towards liveable cities.

Despite all such concerns, the advent of variously electrified drivetrains makes an LCA approach essential, in our view, for the achievement of basic consumer clarity around product claims as well as policy maker insight.
One central objective, echoing previous Emissions Analytics newsletters, is achieving the greatest reduction of CO2 emissions in the shortest possible time, in the real world and not just on paper, so as to achieve the promise of the Paris climate accord and the stated goals of the IPCC in containing climate change.
Unfortunately, almost all existing vehicle regulation in OECD countries is out of sync with this climate objective, having arisen in an era in which the internal combustion engine was overwhelmingly dominant. Existing regulation concerns fuel economy and tailpipe emissions. Because EVs have tank-to-wheel emissions of zero, they have caught the policy-makers’ ear for being ‘zero emission’. Partly as a result, numerous countries have now declared their intention to halt the sale of ICE drivetrain vehicles in coming decades.
Our view of this development is one of caution, partly because of the insight afforded by the application of LCA.
In short, countries such as the UK, India, France and China are moving towards outright bans on internal combustion engines before regulators have established even rudimentary frameworks for lifecycle carbon emissions of vehicles.
It is not widely understood in the West that China’s push into rapid electrification is primarily to address poor air quality rather than combat climate change. In LCA terms its electric cars are at best roughly on par with their ICEV equivalents, with small gains predicted by 2020.[1]
This helps to explain why one of the themes of 2019 has been a series of reports identifying the high upfront embedded emissions in electric cars and the perils of grids not yet weaned off coal and lignite.
Bloomberg NEF, with Berylls Strategy Advisors, recently claimed that by 2021, ‘capacity will exist to build batteries for more than 10 million cars running on 60 kilowatt-hour packs’, with ‘…most supply … from places like China, Thailand, Germany and Poland that rely on non-renewable sources like coal for electricity.’[2]
Modelling the climate emissions of the manufacture of these batteries led the analysts to claim that the 500kg + battery pack for an SUV emits up to 74 percent more CO2 than producing an efficient conventional car if it’s made in a factory powered by fossil fuels in a place like Germany.
Several other similar reports in 2019 have pinpointed the environmental achilles heel of electric cars – their batteries – some pointing out not just their manufacturing emissions but to other impact categories relating to the mining of battery materials at scale. In some of these reports the claim is that electric cars can be dirtier than diesel cars on an LCA basis, under certain scenarios.
At the opposite end of the spectrum, critics of these reports have been up front in admitting that fulfilling the promise of clean transportation rests on decarbonising the wider energy grid, both in respect of EV manufacturing and EV use-phase. The true potential of electric cars therefore lies in the future.[3]
[1] ‘Life cycle greenhouse gas emission reduction potential of battery electric vehicle’. Zhixin Wu, Michael Wang, Jihu Zheng, Xin Sun, Mingnan Zhao, Xue Wang. Journal of Cleaner Production 190 (2018) p462-470.
[2] www-bloomberg-com.cdn.ampproject.org/c/s/www.bloomberg.com/amp/news/articles/ 2018-10-16/the-dirt-on-clean-electric-cars; Berylls Strategy Advisors, www.berylls.com.
[3] ‘The Underestimated Potential of Battery Electric Vehicles to Reduce Emissions.’ Auke Hoekstra, Joule 3, 1404-1414, June 19, 2019.

Broadly expressed, we acknowledge elements from both sides of this debate and incorporate them in the preparation of individual vehicle assessment. The lowest GHG emission is from hydropower and on this basis an EV in Sweden, as early as 2010, emitted just 6g CO2/km in use; the highest GHG is from lignite and produces an equivalent figure of 353g CO2/km.[1] The authors of this respected academic paper consider that with the current EU grid mix, the emissions of BEVs are between 197 and 206g CO2-equivalent/km, depending on battery chemistry.
At this juncture it is important to emphasise the very promising middle ground occupying the space between ICEV and BEV, the land of the hybrid and plug-in hybrid. In many situations a part-electrified drivetrain can outperform both ICE and BEV owing to the very high embedded emissions in the BEV and its underperformance in cold weather and/or when fuelled from a fossil heavy grid.
In this observation we have in mind one particular paper breaking down drivetrain performance by US regions. The ICE drivetrain had the worst GHG emissions in almost all scenarios, demonstrating the imperative of electrification for climate mitigation in a broad sense; but where cold weather and part-coal grids came into play (typically in parts of the Midwest) the worst performer overall was a BEV, while in all regions the best performing drivetrains were hybrids and plug-in hybrids, partly owing to their ability to scavenge waste heat from an ICE to operate the HVAC system in low temperatures.[2]
As such our default position is technology neutrality respecting acknowledged unknowns. Whereas some reports have claimed that in-use battery degradation could add as much as 29% to the real emissions of a medium size BEV over its life, other studies have noted that the existing durability of batteries in some hybrids suggest that the industry assumption of a lifetime of 150,000km or 8 years (the ‘functional unit’ in LCA language), is excessively cautious, with some early hybrids achieving multiples of this. The truth is that we don’t know because there is not yet enough real-world data to draw on for real-world results.
Where Emissions Analytics will contribute is by modelling an LCA approach premised on the use-phase emissions attained through real-world testing, allowing for a rising scale of other inputs that permit worst-through-best scenarios instead of being captive to a particular model or paradigm.
As things stand there is an emergent consensus view that BEVs can potentially be 30-50% better in GHG emissions, in a whole life LCA perspective, with extensive renewables at manufacturing and in-use, but this is certainly not invariably so.[3] For now, deeming EVs as the cleanest simply by virtue of what they are is misleading.
It’s equally important to note in passing that while climate considerations have become imperative, electrification is something of a devil’s bargain owing to other environmental impact categories that remain far worse than for ICEVs no matter how far projected into a golden future – these include terrestrial acidification; freshwater eutrophication; human toxicity and non-exhaust particulate emissions.[4]
Discrimination by battery origin and market of operation will quickly become an important consideration, and forms the underlying basis of Emissions Analytics’ approach to a ratings model for vehicles.
The other emerging theme is the importance of the duty cycle. The emissions ‘breakeven’ potential of an EV rests on its mileage. It may well be that a small hybrid car remains in LCA terms much more efficient for the occasional or low mileage driver than a full EV.
These and other themes will emerge rapidly as an LCA approach comes to dominate thinking and the regulatory environment. Communicating ratings to car buyers in a comprehensible way will remain Emissions Analytics' mission.
[1] ‘Environmental life cycle assessment of electric vehicles in Poland and the Czech Republic.’ Dorota Burchart-Korol, Simona Jursova, Piotr Folega, Jerzy Korol, Pavlina Pustejovska, Agata Blaut. Journal of Cleaner Production 202 (2018) 476-487, p485.
[2] ‘Effect of regional grid mix, driving patterns and climate on the comparative carbon footprint of gasoline and plug-in electric vehicles in the United States.’ Tugce Yuksel, Mili-Ann M Tamayao, Chris Hendrickson, Inêz M L Azevedo and Jeremy J Michalek, Environ. Res. Lett. 11 (2016) 044007, p8.
[3] This was the finding of BMW in its LCA for the BMW i3 BEV, conducted according to ISO 14040/44 and independently certified in October 2013. The 30% figure assumed the EU-27 grid mix, while the 50% figure assumed 100% renewables. In this study almost 60% of the vehicle’s GHG footprint resulted from manufacturing despite enormous efforts of the company to source renewable energy for production, including all carbon fibre production and the use of re-cycled aluminium.
[4] ‘Environmental life cycle assessment of electric vehicles in Poland and the Czech Republic.’ Dorota Burchart-Korol, Simona Jursova, Piotr Folega, Jerzy Korol, Pavlina Pustejovska, Agata Blaut. Journal of Cleaner Production 202 (2018) 476-487. See Table 9 on p484.

Hybrids are 14 times better than battery electric vehicles at reducing real-world carbon dioxide emissions
Why a multi-pronged approach to electrification is needed
Battery production capacity for motor vehicles is currently scarce, expensive and suffering supply lags and challenges.
Why a multi-pronged approach to electrification is needed
Battery production capacity for motor vehicles is currently scarce, expensive and suffering supply lags and challenges. This may change over time, but for some period securing an economic supply of battery production capacity will be pivotal to the successful commercialisation of electrified vehicles, and to the relative fortunes of individual auto makers. At the same time, electrification is a proven route to tailpipe carbon dioxide (CO2) reduction, or elimination. Therefore, the efficient deployment of available battery capacity between competing applications is critical to maximising fleet CO2 reduction.

So long as this scarcity remains, a major concern is that the push to pure battery electric vehicles (BEVs) will crowd out a more effective programme of mass hybridisation. Put another way, given the urgency of the need to reduce CO2, paradoxically BEVs may not be the best way to achieve it with their supply chain, production capacity, infrastructure and customer acceptance challenges. The assertion that BEVs are required to solve air quality problems is confusing the argument – cities in Europe can be brought into compliance with conventional internal combustion engines, with technology on the market today. Electrification is first and foremost a CO2 reduction technology, but what strategy mix represents the correct path?
This newsletter is inspired by recent insightful articles by Kevin Brown: https://bit.ly/30j50Ed and https://bit.ly/30oC1yM. His insights on the efficiency of carbon reduction can be put together with the Emissions Analytics’ database of real-world testing over almost 100 hybrids vehicles to see in more detail the most efficient options for electrification and CO2 reduction.
As with tailpipe pollutant reduction, CO2 reduction comes down to how to achieve it as cost-efficiently and quickly as possible. Emissions fell during the financial crisis, but at the significant price of sharply reduced economic activity – not desirable. So, how best to deliver road transportation’s part in meeting the Paris climate change targets? The apparent consensus is to transition to pure electric vehicles as rapidly as possible. But is this singular focus better than a combined strategy employing a wide variety of hybrid electric vehicles?
The problem with the pure electric vehicle approach is that the transition will be slow, BEVs need disproportionately large batteries to give acceptable consumer utility, just as battery capacity is currently a scarce resource. As cumulative CO2 emissions are important for climate change – due to the long life of the gas in the atmosphere – a smaller reduction per vehicle now, but across many more hybrid vehicles, would eliminate a far greater volume of CO2 than applying the scarce battery resource to a smaller number of BEVs. This approach also helps mitigate naturally slow fleet turnover, with the average age of cars on the road being over twelve years.
So, what does the real-world performance data of hybrids look like?
The following analysis takes the mild, full and plug-in hybrid vehicles tested by Emissions Analytics in both Europe and the United States. Each hybrid is paired with its nearest equivalent internal-combustion-engine-only vehicle, often the same make and model with a similar engine size. The difference in average CO2 emissions over Emissions Analytics’ standard on-road cycle between the hybrid and its conventional-engined pair is then calculated.
The first table focuses on mild and full hybrids, excluding plug-ins, and shows the average tailpipe CO2 reductions that are achievable with models that are currently on the market, or that have been sold over the last seven years since Emissions Analytics started its test programme.
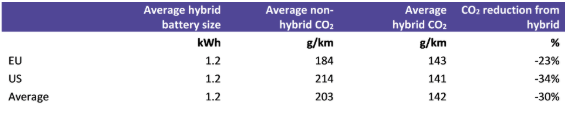
The average US reduction is larger than in Europe due to the typically higher CO2 emissions starting point of US vehicles, and often the latest hybrid technology is launched in the US market earlier. Of these 95 hybrids, five are diesels.
To put this 30% reduction in context, the EU’s post-2021 CO2 reduction target for passenger cars is 37.5% by 2030. Therefore, widespread non-plug-in hybridisation with currently available technology would achieve over three-quarters of that target. Moreover, with fourth generation hybrids now entering the market, the benefits of hybrids will improve further, as illustrated at https://bit.ly/2KhDlhh. Together with plug-in hybridisation and other design innovations, it is plausible that the target could be met without the need for full electric vehicles.
The results from the first table are then combined with results from plug-in hybrids and a representative BEV, with the difference in CO2 being divided by the battery size of the electrified vehicle. The result measures the efficiency of CO2 reduction in return for the deployment of the scarce battery resource. The results are shown below, with three different illustrative scenarios for plug-ins depending on varying battery utilisation.

* Typical battery size across models currently on the market. The CO2 reduction from BEVs is based on switching from an average internal combustion engine emissions to a zero-emissions BEV.
The table above shows that mild hybrids are clearly the most efficient method of CO2 reduction, followed by full hybrids, given scarce battery production capacity. Plug-in hybrids are the next most effective after that, but only if they are operated entirely on battery, which is hard to enforce in practice. BEVs have the lowest efficiency, primarily due to requiring disproportionately large batteries to accommodate relatively infrequent, extreme usage cases where the driver will otherwise suffer range anxiety.
This analysis ignores the upstream CO2 in fuel extraction, refining and transportation, as well as in the production and distribution of electricity. Some studies suggest the upstream CO2 of the electricity is greater than for gasoline, but the relative efficiency calculations here implicitly assume they are equal.
Showing the distribution of performance by individual model, the chart below relates the efficiency of CO2 reduction by battery size. Mild and full hybrids are the most efficient on average, but there is significant variation within the class – demonstrating that individual vehicle selection remains at least as important as generic powertrain. The same chart also demonstrates the advantage in CO2 reduction that the US currently holds.

In terms of the trajectory to total CO2 reduction, a transition from gasoline internal combustion engine to full gasoline hybrid can reduce emissions by 34%. As it will take time to increase the supply of full hybrids, there are two routes to short-term CO2 reduction that are viable more quickly. First, a switch from gasoline to diesel internal combustion engine in practice reduces CO2 emissions by 11% at the tailpipe. A second step then to a diesel mild hybrid delivers a further 6% reduction. The final swap to full hybrid delivers another 16%, making 34% in total. Alternatively, a direct switch from gasoline to gasoline mild hybrid can deliver 11%, followed by a further 23% in moving to full hybrid. Therefore, there are immediate-term options for significant CO2 reduction, involving both gasoline and diesel powertrains – the former more suitable in the European market, the latter in the US due to the current mix of fuel utilisation.
It is at any regulatory stages beyond the 37.5% fleet reduction that fuller electrification would be required, as there are limits to the total CO2 reduction that hybrids can deliver. However, by 2030 the EU and US would have had more time to develop expanded, cleaner electricity generation capacity, enhanced distribution grid, and addressed the supply chain issues around the scarce materials in batteries. Not neglecting also that consumer education and acceptance are required to remove barriers to adoption. An alternative scenario by 2030 is that the availability and price of renewable electricity may have fallen to a level at which hydrogen fuel cell vehicles become economic viable, which avoid some of the environmental and geopolitical issues created by largescale battery production.
In summary, this data strongly suggests that policy unilaterally favouring one technology solution may be deeply inefficient and perhaps even the wrong eventual solution. A better approach would be to use real-world data to allow competing technologies to flourish as they can evidence genuine CO2 reductions, delivered as soon as possible.
The WLTP enigma
Is there something strange happening with WLTP?
The Worldwide Harmonised Light Vehicle Test Procedure (WLTP) is the new laboratory certification test for light duty vehicles in Europe. In particular, it is used for the fuel economy labelling of vehicles and the carbon dioxide (CO2) results will be used in labelling and manufacturer fleet average CO2 calculations. Missing the fleet average targets could trigger significant fines for manufacturers.

WLTP includes a more dynamic test cycle compared to the old New European Driving Cycle (NEDC), although it remains entirely in the laboratory. There is also a new legal framework, which removes some the loopholes and grey areas previously present, which were believed to contribute to the large gaps between certification values and the real world. Therefore, through the combination of the more dynamic cycle and fewer loopholes, the expectation was that WLTP results would see smaller discrepancies with real-world performance.
All cars sold from September 2018 must be WLTP certified, but the fleet average targets are still judged relative to NEDC values. Therefore, a translation mechanism has been created to derive NEDC-equivalent values from the WLTP test. The Joint Research Centre of the EU expressed concern about manipulation of this mechanism in 2018, and tightened the system as a result.
Is WLTP now functioning as intended? How do we judge?
Fortunately, Emissions Analytics has been conducting the consistent, standard EQUA Index test since 2011, bridging both systems. Over 1200 vehicles have been tested so far in this way. Using this data, we are able to compare the old NEDC figures, new NEDC figures and WLTP values to this consistent reference point to understand what has been happening.
There is a vital need to bring clarity, as the WLTP system is complex. Even if data is made freely available, it is hard to understand and analyse. Often, however, the CO2 data is not easily and comprehensively available. The following analysis relies on data quoted by manufacturers in their vehicle registration documents, except where it is demonstrably inaccurate.
The table below show NEDC values derived under the old system (NEDCNEDC), NEDC values under the new system (NEDCWLTP) and EQUA Index results for vehicles certified under NEDC and WLTP respectively (EQUANEDC and EQUAWLTP). NEDCWLTP results are primarily derived by processing the data from the WLTP test through a software package (CO2MPAS) provided by the EU. The process is complex and, in fact, the NEDCWLTPvalues could be modelled using CO2MPAS, manufacturer declared values or from actual dynamometer tests – therefore, the determination of NEDC-equivalent values under the new system is potentially open to manipulation as its complexity does not assist transparency.
The table summarises the average CO2 emissions for all pre- and post-WLTP vehicles tested up to 3 litres in size. In total, 25 WLTP cars have been tested so far that have a full set of publicly-available data.
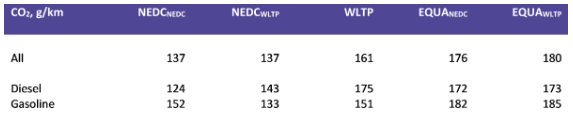
To start, it is worth noting that the real-world emissions on the EQUA Index sit well above the current 130 g/km fleet average CO2 target, let alone the 2021 95 g/km 2021 target. But most striking are the differences in trends between diesel and gasoline vehicles, as shown in the table below.

Across all the Euro 6 cars tested prior to the introduction of WLTP, the average CO2 gap was 32%. Cars certified to WLTP over the last one-and-half years show a smaller gap of 13%, as expected. However, below these intuitive headlines are some perplexing trends. For example, the gap between the EQUA Index and the NEDC for diesels has shrunk, while it has expanded for gasoline vehicles – to the point that there is no systematic gap between the EQUA Index and WLTP for diesels, but there is a 24% gap for gasoline.
To verify that this is not an artefact of the vehicles tested, comparing the average CO2 for EQUA results under the NEDC compared to EQUA Index results under the WLTP showed a difference of just 2%. Furthermore, the average engine sizes of the two cohorts were considered, and were broadly similar:

Therefore, it is clear that there has been a significant change in the relative certification values of diesels and gasoline, despite no change in the real-world performance as measured by the EQUA Index.
So, what can we conclude about the health of the WLTP system?
The table below summarises the findings. The comparison of WLTP to NEDCWLTP results is intuitive and in line with EU forecasts. The health of the translation system is primarily being policed by looking at this difference because of the concern that OEMs were simultaneously inflating WLTP values and suppressing NEDC values, to create the biggest gap, so that future WLTP-based fleet average CO2 reductions were based off an inflated start point. The results below suggest this issue is not occurring on a significant scale.
The difference between NEDCWLTP and NEDCNEDC should be positive, as the new type approval framework removes loopholes – but there is a significant negative gap for gasoline vehicles. In other words, CO2 values have fallen despite the test getting tougher. Comparing WLTP to the average NEDC values on under the old regime shows a big rise in CO2 for diesels, but virtually no change for gasoline vehicles.

A potential explanation for these movements is that focus and expertise have been put into optimising gasoline vehicles on the new WLTP cycle, driving the official CO2 down despite this not translating into better real-world performance. The increase in official diesel CO2emissions may be partly explained by the larger average engine size of engines so far tested.
If this turns out to be true, it would give further credence to the argument for including on-road testing in the official CO2 certification process, to limit the ability to optimise to the test. In the meantime, the use of WLTP results for fuel economy labelling will be hardly more useful to consumers that the old, discredited NEDC system it replaced.
European Court annuls Real Driving Emissions limits: the potential consequences
The General Court of the European Union overturned the emissions compliance levels under the new Real Driving Emissions (RDE) regulation in a verdict announced on 13 December. On the surface of it, this may look like a victory for cities wanting to be tougher on emissions of nitrogen oxides (NOx) from passenger cars and vans.

The General Court of the European Union overturned the emissions compliance levels under the new Real Driving Emissions (RDE) regulation in a verdict announced on 13 December. On the surface of it, this may look like a victory for cities wanting to be tougher on emissions of nitrogen oxides (NOx) from passenger cars and vans. In reality, it has the potential to further complicate the Euro 6 regulatory stage and thereby create the unintended consequence of making it even less usable for urban vehicle policy.
While the European Commission did not seek to increase the headline 80 mg/km emissions limit for diesel vehicles, which must still be adhered to in the laboratory test, they granted “Conformity Factors” that in effect did increase the limits for the harder, on-road part of the test. As a result, all diesels vehicles only had to meet 168 mg/km by September 2019, falling to 114 mg/km by January 2021. This was in practice a large increase in the permissible emissions limit.
The Court verdict suggests that vehicles already certified under Real Driving Emissions (that starts with the stage known as “Euro 6d-temp”) will remain compliant, as will vehicles certified for up to 14 further months in the future, depending on whether the Commission appeals and the speed with which replacement legislation is brought forward.
But what is this likely to mean in practice?
Let us assume that there is no appeal and no new legislation, meaning vehicles must meet 80 mg/km on the RDE test. Taking a sample of 30 RDE-certified diesel cars tested by Emissions Analytics on its independent EQUA Index test, we conclude that up to 90% of the vehicles would still be compliant. Although the test does not include cold start in its ratings, overall it remains a good proxy for RDE compliance. Furthermore, the average NOx on a combined cycle of these still-compliant vehicles is just 50 mg/km, well below the certification standard. Of the remaining 10%, they all come from the same OEM, Honda, which would in this scenario need to make changes.
This suggests the impact would be low. However, RDE does not become mandatory for all vehicles sold until September 2019. Therefore, it is likely that this conclusion is flattered due to a self-selecting sample of the best performing cars. If we look at the wider population of pre-RDE Euro 6 diesel cars, we may have a proxy for the challenge to each manufacturer of no Conformity Factors.
The table below shows the proportion of pre-RDE Euro 6 diesels from a range of manufacturer groups that meet various emissions levels, on our real-world scale. For example, 33% of all BMW/Mini Euro 6 diesel vehicles tested by Emissions Analytics achieve a rating of ‘A’.
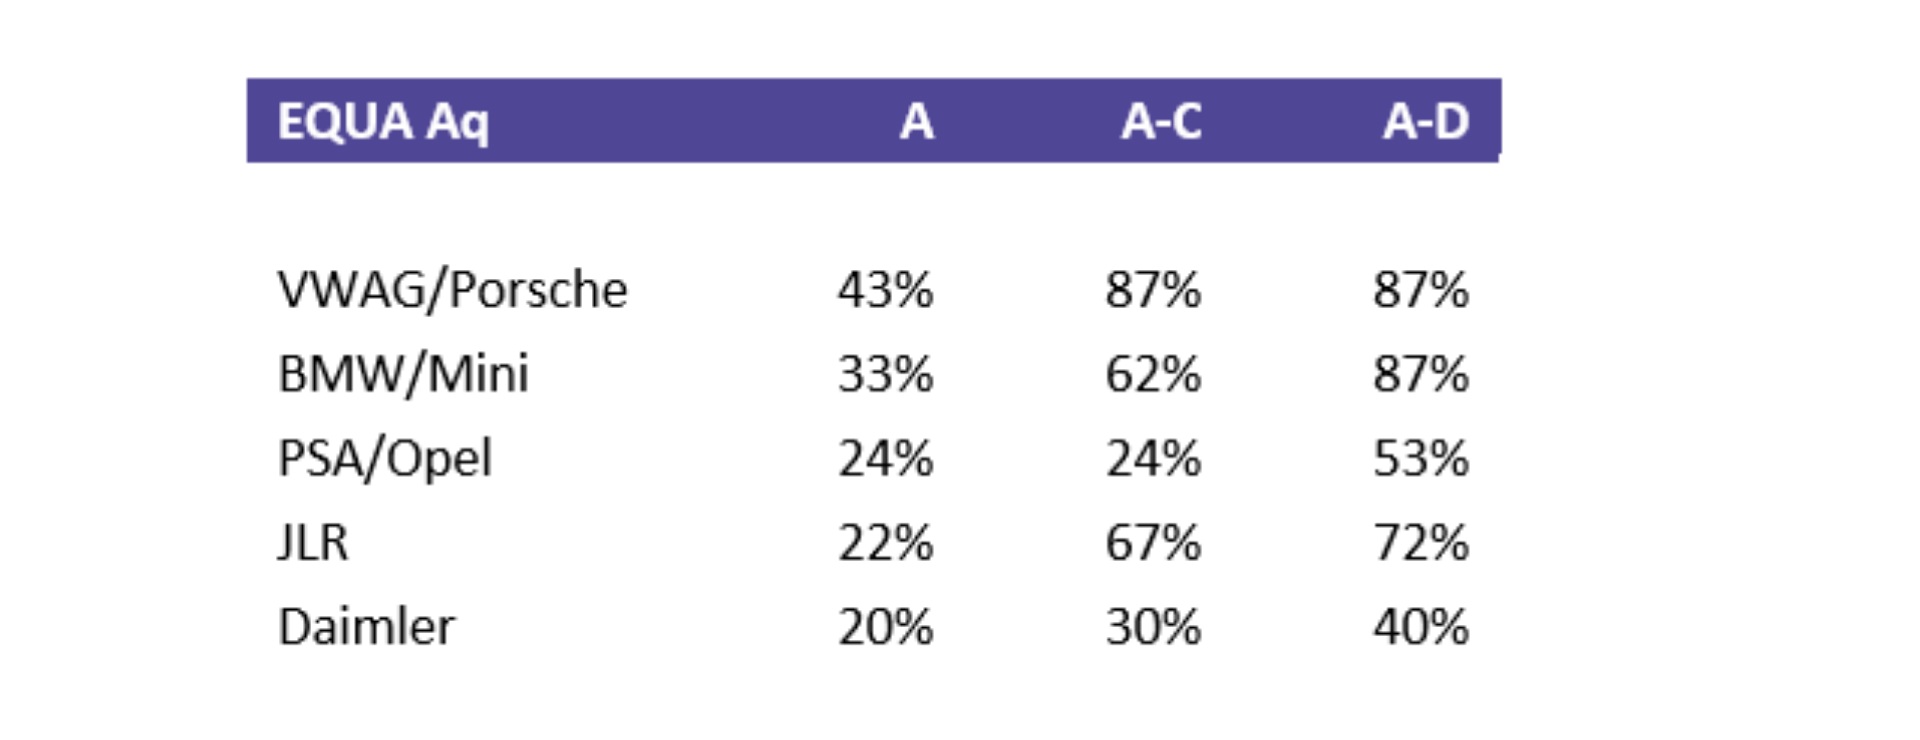
The ‘A’ rating is equivalent to 80 mg/km; ‘A’ to ‘C’ is equivalent to 180 mg/km (the Euro 5 level, close to the 2.1 Conformity Factor level); ‘A’ to ‘D’ is equivalent to 250 mg/km (Euro 4).
Approximately, the Conformity Factors allowed ratings of up to ‘C’, but with this annulled, ‘A’ ratings would need to be achieved. The table lists the five manufacturer groups that would be best placed to meet this requirement – assuming their pre-RDE performance is a proxy indicator of how close they are to achieving 80 mg/km across their whole range. VW Group, therefore, is best placed overall; Jaguar Land Rover has made the most rapid advances in the last year.
The final column of the table indicates the proportion that meet ‘A’ to ‘D’. This is relevant to the 270 mg/km maximum limit proposed in an agreement between the German government and cities, to be judged in real-world conditions. The ‘D’ rating is a near equivalent to this level. While the 270 mg/km limit is currently only proposed to apply to Euro 4 and 5 diesels, in time it could be extended to Euro 6 vehicles. If this were to happen, the table shows what proportion of these manufacturers' vehicles may be restricted from the 14 German cities cited. Therefore, VW, BMW and JLR would be the least affected of all. In addition, this is before the benefit of the fixes and retrofits that have been, or may be, actioned, which would further reduce the restrictions. In contrast, there are manufacturers that could face having all their Euro 6 diesels restricted.
Overall, this may give reassurance to some, but there is a wider risk. The annulment of these Conformity Factors further confuses what “Euro 6” means as a label of performance. RDE was meant to be a discontinuity with the past, failed regulation. It had two levels already – two Conformity Factors – but the effect of the Court judgement could lead a change in the gradations or, potentially, more gradations. The Euro 6 label has limited informational content already, but the effect may be to cloud what RDE means, causing further consumer confusion, which would not be to the advantage of the car market.
The Court judgement is witness to the growing power of cities in determining vehicle emissions policy, even if they sometimes demonstrate an unresolved tension between whether air quality improvement or greenhouse gas emissions reduction is the higher priority. What the Court judgement may do is bring into starker relief the difference between the best and worst performing vehicles, which would pave the way for more efficient solutions to the urban air quality challenge.
Real Driving Emissions is a tough regulation, but also a risky one
Aggressive driving on average increases pollutant emissions by 35% in rural driving and by around five times on the motorway, according to testing of the latest passenger cars by Emissions Analytics on its EQUA Index programme.

Aggressive driving on average increases pollutant emissions by 35% in rural driving and by around five times on the motorway, according to testing of the latest passenger cars by Emissions Analytics on its EQUA Index programme. Even higher “hotspots” have also been identified, where emissions at high speed can peak at more than ten times typical levels of nitrogen oxides (NOx) – the pollutant gas that was at the centre of the #dieselgate scandal.
The need to identify hotspots is becoming vital with the new Real Driving Emissions (RDE) regulations, which is a much tougher regulation of driving in normal conditions. The consequence of this will be that a greater proportion of total emissions may be concentrated in a small number of more unusual or extreme events. Unless those are well understood, the effect of the new regulations may be blunted.
The in-use surveillance requirements set out in the fourth package of RDE are aimed at monitoring vehicle compliance in all normal driving conditions, not just the cycle on which the vehicle was certified. Broadly, a vehicle should pass any RDE test within its useful life, whenever and whoever conducts the test. This is both a significant challenge for manufacturers, and brings with it risk as it is impossible a priori to guarantee compliance on all possible RDE tests.
To help quantify this risk, Emissions Analytics is launching a new evaluation programme that will quantify the risk of excessive emissions for each vehicle tested. Currently, EQUA Index ratings (www.equaindex.com) are published to allow the performance of different vehicles to be compared on a standard, normal cycle. This new programme leaves that rating unchanged, but puts the vehicle through an extended test designed to measure performance in more extreme and unusual driving conditions. The variance between that, the standard EQUA Index and the regulated level will yield a rating for the risk of exceeding the regulated level.
The main factors considered are:
Higher speeds
Higher and lower rates of acceleration
Cold start emissions
Emissions under regeneration of the diesel particulate filter.
Considering eight diesel cars certified to the new RDE standard (Euro 6d-temp), the effect of driving at speeds up to 160 kph can be shown in the chart below.

In all cases the NOx emissions on the standard cycle – with maximum speeds up to 110 kph – are within the regulated limit of 80 mg/km plus 2.1 times conformity factor, even though certification does not apply this to the motorway section separately. In fact, many of the vehicles are comfortably below this limit. Allowing the maximum speed to rise to 160 kph shows significant proportionate increases on all but one vehicle, with the average percentage increase across all eight vehicles being 552%. All but two of the vehicles remain below the limit despite the increases; however, the worst two vehicles emitted around 650 mg/km.
For reference, under the RDE regulation, the vehicle’s velocity can be driven between 145 and 160 kph for up to 3% of the total motorway driving time. The risk of compliance therefore comes from a vehicle that has a significant emissions uplift at 160 kph and is relatively close to the limit at more moderate speeds.
Under cold start, vehicles 7 and 8 also showed an average increase in emissions of 160% compared to an average of 110% across the other vehicles.
Putting this data together with performance in other parts of the test cycle, it is possible to derive ratings of the risk of excessive emissions on RDE and on RDE-like cycles but with more relaxed boundaries, as shown in the table below.
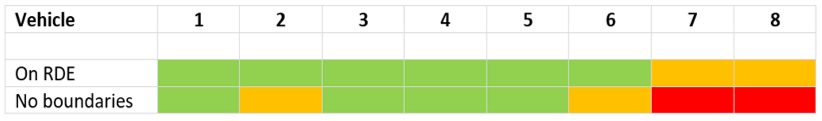
It is important to note that a red rating does not necessarily imply non-compliance but, rather, it identifies elevated risk of non-compliance using results from the Emissions Analytics’ test, which runs a cycle similar to RDE but that is not strictly compliant.
Considering Euro 6 diesels, whether RDE or prior, the effect of cold start is that NOx emissions are 2.8 times higher on average during the cold start phase compared to the whole warm start cycle. During regeneration of the diesel particulate filter NOx emissions are on average 3.3 times higher than in mixed driving with no regeneration. Therefore, the frequency and geographical location of these events can be critical to the overall real-world vehicle emissions.
These results are important for cities, manufacturers and regulators. For cities, it is vital to know that the latest vehicles do not have emissions hotspots that could undermine their air quality targets. For manufacturers, facing third-party RDE testing to check compliance, it is important to quantify the risk of high emissions being found in unusual driving conditions, where every scenario cannot practically be tested. For regulators, it is important that RDE is seen to function well in order to draw a line under the failed regulation of the past.
Emissions Analytics will continue to test a wide range of the latest vehicles to publish comparable ratings between vehicles, but now with the added quantification of the risk of elevated emissions around the boundaries of normal driving.
Discrepancies between best and worst diesel cars reaches record high
The first diesel vehicle that met the regulated Euro 6 limit for nitrogen oxides (NOx) on our real-world EQUA Index (www.equaindex.com) test using a Portable Emissions Measurement System (PEMS) was in May 2013.
The first diesel vehicle that met the regulated Euro 6 limit for nitrogen oxides (NOx) on our real-world EQUA Index (www.equaindex.com) test using a Portable Emissions Measurement System (PEMS) was in May 2013. Of the vehicles we tested in that year, the cleanest 10% of diesels emitted 265 mg/km and the dirtiest 10% emitted 1777 mg/km – a ratio of 7 to 1. In 2017, the cleanest 10% achieved an impressive 32 mg/km, but the dirtiest 10% were 1020 mg/km, a ratio of 32 to 1.
On average, progress has certainly been made, with average diesel NOx emissions having fallen from 812 mg/km to 364 mg/km from Euro 5 to Euro 6, or a 55% reduction, driven by the prospect of the new Real Driving Emissions (RDE) regulations together with the aftermath of dieselgate. The very worst vehicles have now disappeared from the new car market. It is also true that in around 10 years’ time, the majority of diesels on the road are likely to be of the cleaner variety, through natural turnover of the fleet.
We have now tested six of the latest RDE-compliant diesel vehicles, also known as 'Euro 6d-temp'. Their average NOx emissions were 48 mg/km, 40% below the regulated limit itself, and 71% below the effective limit once the Conformity Factor of 2.1 is taken into account. (As ever, it should be noted that while the EQUA Index test is broadly similar to an RDE test, it is not strictly compliant.) However, it should be noted that there are many cleaner diesels even before RDE, with 30 prior models achieving real-world emissions of 80 mg/km or less.
While this sounds like good news, the elongated transition to RDE, and growing spread from the best to the worst, are creating a growing policy and consumer choice problem in the meantime. A vehicle in the highest-emitting decile today will likely be a significant contributor to urban NO2 pollution. Yet, the cleanest diesels are getting close to the average NOx emissions from new gasoline vehicles, which is 36 mg/km. Without the contemporary data to show this, policy makers would be forgiven for simply banning all diesels from urban locations.
The lowest NOx emission recorded so far this year is the 2017 model year Mercedes CLS, with selective catalytic reduction after-treatment and type-approved for 6d-temp, which recorded 15 mg of NOx per km.

New Real Driving Emissions regulation increases pressure on annual inspection and maintenance testing system
The European Union Roadworthiness Directive came into force on 20 May 2018 and will play a role in enforcing type approval emissions limits, subtly but powerfully changing its role and previous focus on safety, to the benefit of air quality.
The European Union Roadworthiness Directive came into force on 20 May 2018 and will play a role in enforcing type approval emissions limits, subtly but powerfully changing its role and previous focus on safety, to the benefit of air quality.
In the new inspection and maintenance test, known for example as the MOT test in the UK, a ‘major’ defect and automatic fail arises from any visible smoke being emitted by any car equipped with a diesel particulate filter (DPF), meaning in practice the majority of vehicles since late 2009 (Euro 5 onwards).
The definition of ‘visible smoke’ has only tightened up for vehicles registered after 1 January 2014, meaning late Euro 5 and all Euro 6. Permitted smoke for these cars has more than halved from 1.5m-1 to 0.7m-1. This measurement is familiar to any MOT tester and denotes opacity, where 0.0 m-1 is totally clear and 10.00 m-1 is totally black. In practice, less than 0.7m-1 is judged to be invisible and more than 0.7m-1 will be visible.
For vehicles from 1 July 2008 to 31 December 2013, the standard is 1.5m-1, while the smoke standard for older cars remains unchanged, at 2.5m-1 (non-turbo) 3.0m-1 (turbo).
Air quality campaigners have been quick to note the perversity of a tougher test that only applies to newer cars. However, it has long been politically unfeasible to apply new standards to old cars, which would see the wholesale removal of vehicles that met their type approval at the time of their manufacture.
The revised smoke test for vehicles since 2014 is likely to catch out cars where the DPF is absent or defective. Particulate emissions rise by orders of magnitude when the DPF is missing or blocked. In the UK, 1800 cars have been caught without a DPF since 2014, but the true figure is believed to be much higher because it is notoriously difficult for testers to identify DPF removal in the small amount of time taken to perform the MOT.
In an exercise Emissions Analytics conducted in 2017 with BBC 5 live Investigates, a car with its DPF removed still passed its MOT at three (out of three) different garages. Mechanics failed to spot the filter had been taken out on each occasion, and the car was not failed for opacity.
To quantify the difference between having a DPF and not having a DPF, Emissions Analytics technicians tested a 9.0 litre commercial diesel engine before and after the installation of a DPF retrofit. The particle number (PN) and particle mass (PM) afterwards were close to zero, so the reduction was over 99%. Therefore, tampering would increase the emissions by orders of magnitude.

As this problem of DPF removal detection has not been eliminated, it is believed that the tougher smoke test will most likely identify missing filters, although we think a greater degree of tester training and adherence to test processes is also required.
A weakness of the new test is that is does virtually nothing to enforce emissions limits for nitrogen dioxide (NOx). Emissions control equipment is only subject to a visual check for its presence, including the oxygen sensor, NOx sensor and exhaust gas recirculation valve.
Should any of these items be ‘missing, obviously modified or obviously defective’, the car fails the test. However, the new (UK) MOT Manual skimps over this area by suggesting in section 8.2.2.1 (Exhaust emission control equipment for diesel engines), telling testers, “You only need to check components that are visible and identifiable, such as diesel oxidation catalysts, diesel particulate filters, exhaust gas recirculation valves and selective catalytic reduction valves.” We suspect that in numerous cases this requirement will be neglected owing to the continued difficulty of determining the presence of some of these items, or because of commercial pressures to complete tests quickly.
Almost all Euro 5 diesel cars had no NOx after-treatment, just exhaust gas recirculation (EGR), while their Euro 6 successors typically received the addition of either a Lean NOx Trap (LNT) or a Selective Catalytic Reduction (SCR) system. Therefore, as a rough equivalence, a Euro 6 car with failed after-treatment may emit at a level more akin to an equivalent Euro 5 vehicle.
Emissions Analytics has tested numerous Euro 5 and 6 cars on its on-road EQUA Index (www.equaindex.com) route. For example, a Euro 5 VW Golf 1.6 litre diesel emitted 0.557 g/km of NOx, while its LNT-equipped Euro 6 successor emitted 0.161 g/km, a reduction of 71%.
Then take the larger Mercedes C-Class 2.1 litre diesel. In Euro 5 guise it emitted 1.226 g/km of NOx; and with SCR fitted to the Euro 6 version the same engine emitted 0.396 g/km, a reduction of 68%.
From these results it is clear that to disable these treatments (with an “emulator” or similar) or where they have malfunctioned, NOx could increase by a factor of over 3.
However, the dilemma in setting an in-service NOx standard is that the performance of vehicles when brand new varies from around 20 mg/km to over 1500 mg/km – the issue uncovered as a result of the dieselgate scandal. A vehicle normally producing 20 mg/km that is malfunctioning might produce 800 mg/km, whereas a different model may produce 800 mg/km when in a fully functioning condition. Therefore, a real-world reference number is required to judge the in-service performance. The EQUA Index rating, which is a standardised test on the vehicle when new, could act as this reference value to increase the accuracy of identifying malfunctioning vehicles.
One unmistakable outcome is that what was once mainly a test for roadworthiness has now become a more complex enforcement of type approval emissions, at the very moment when those limits are tightening up within WLTP/RDE.
The inspection and maintenance system has in this sense risen in importance as a tool for policing emissions, because non-compliant vehicles will display vastly increased emissions, by orders of magnitude. However, the failure to test properly for NOx misses one of the major problems that Europe faces, in the wake of its dieselisation, while the ultrafine particles produced by downsized, direct injection petrol engines are also missed. It feels as though the new test is distinctly lacking in these crucial areas, leaving much more work to be done.
Rethinking Scrappage For Addressing Vehicle Emissions
Scrappage schemes are controversial. In a 2011 academic paper* reviewing 26 studies assessing the outcomes of 18 scrappage schemes implemented around the world in 2008-11, the authors concluded that the emission effects of the schemes were ‘modest and occur within the short term.’ They also concluded that the cost-effectiveness of such schemes ‘is often quite poor.’
Scrappage schemes are controversial. In a 2011 academic paper* reviewing 26 studies assessing the outcomes of 18 scrappage schemes implemented around the world in 2008-11, the authors concluded that the emission effects of the schemes were ‘modest and occur within the short term.’ They also concluded that the cost-effectiveness of such schemes ‘is often quite poor.’
The reality of the 2008-9 scrappage schemes, however, was that governments in Europe, the US and Japan were tackling a liquidity gap by stimulating consumption and bolstering an ailing car industry. The mooted environmental benefits of accelerated fleet renewal were talked up by politicians but were not the main objective. This helps to explain why the efficiency of the schemes in mitigating Greenhouse Gas (GHG) emissions - CO2 dominating discussion at the time - was found to be poor value for the taxpayer and of marginal consequence to overall path reductions towards a low carbon economy.
Since 2008-9, the policy climate has changed significantly, with air quality emerging as a major concern. Several national governments have been sued by environmental groups for illegal levels of NOx in cities, and what was once a transport policy issue has become a matter of public health. With diesel bans looming in city centres, plus the advent of clean air zones, it’s no stunt to reimagine scrappage according to an emission-reduction imperative.
Data availability upon which to base an intelligent scrappage scheme has also improved. Since 2011 Emissions Analytics has compiled the world’s largest database (the EQUA Index) of standardised real-world emissions tests, of over 2000 cars. The EQUA Index test measures not just CO2 emissions but nitrogen dioxide (NO2) and carbon monoxide (CO), as well as fuel efficiency.
Reimagining scrappage in light of air quality first requires accepting that the now discredited New European Driving Cycle (NEDC) test regime has produced counterintuitive outcomes, to the point where some of the newest cars are by no means the cleanest. This means that a poorly designed scrappage scheme could produce a worse outcome, measured in air quality, than doing nothing at all.
The EQUA Index results show that:
Dirtiest Euro 6 diesels are 6-7 times worse than cleanest Euro 5
Dirtiest Euro 6 diesels are up to 3 times worse than cleanest Euro 3/4
Some 20-year-old cars are cleaner than some brand new cars
How one weights GHG emissions against NOx emissions is a matter of policy debate and public acceptance, but a plausible objective would be Pareto optimality, or the idea that addressing air quality should not be at the expense of GHG such as CO2. While research points towards life cycle or ‘well to wheel’ analysis of CO2 emissions, this is difficult to measure and for the sake of a near-term scrappage scheme probably lies in the future.
Beyond the well-observed conflict between efficiency, where diesel scores well compared to gasoline, and the point-of-use emissions, where gasoline is consistently cleaner with respect to certain emissions such as nitrogen dioxide, the point to make is that it is possible to target and scrap dirty cars without increasing CO2.
The EQUA Index test recently revealed that 11 Euro 6 diesel cars from four manufacturers merited an A+ rating, equivalent to 0.06 g/km NOx in the EQUA Index test, which compares with a limit 180% higher (0.168 g/km NOx) for the new RDE requirement that will prevail until January 2021. Such cars can be said to be genuinely clean by today’s standards, but were greatly outnumbered by highly polluting diesel models, 38 of which scored F, G or H, meaning that they exceeded the Euro 6 limit in respect of NOx by 6-15 times. By comparison, 105 gasoline and hybrid Euro 6 cars achieved the A+ rating, and only one gasoline model fell into the D category, the rest being C or higher.

In the graph above, the arrow labelled ‘Bad Trade’ travels from a Euro 4, 1.9-litre diesel Skoda Octavia, model year 2009, that scored E in the EQUA Index test, towards a Euro 6, 1.6 litre diesel Nissan Qashqai, model year 2016, that scored H in the EQUA Index test. The Skoda is cleaner than the Nissan in real-world testing, yet a scrappage scheme designed around vehicle age alone could result in the cleaner Skoda being scrapped for purchase of an equivalent, dirtier Nissan Qashqai. This would result in tailpipe emissions higher by a factor of more than five and therefore worse air quality. It would be a waste of tax payer money.
Conversely the ‘Good Trade’ arrow highlights that dirty older (and conceivably newer) vehicles could be scrapped for genuinely cleaner new vehicles. Currently, 87% of Euro 6 diesel cars are over the Euro 6 limit, as are all Euro 5 cars. If all these cars were replaced by Euro 6 cars actually performing to the Euro 6 diesel standard in real-world conditions, the net tailpipe emissions improvement measured in NOx would be around 88% from the Euro 5/6 fleet. If real-world performance were only brought down to the Euro 5 diesel standard, the reduction in emissions would be 74%. Even if performance were reduced to just Euro 3 levels, there would still be a 38% reduction.
Put another way, as most Euro 5 and 6 diesels emit over the limit, a large number of vehicles need to be “fixed” to address the air quality problem. This inherently makes any scrappage scheme highly costly. Therefore, a more stratified approach may be optimal, as shown in the chart above. Emerging passenger car retrofit technology may deliver a 25% or more reduction in NOx; those vehicles with moderately high emissions could be tackled in that way. A scrappage scheme could then be targeted on the dirtiest diesels (perhaps worse than the Euro 3 level in real-world).
A further potential ‘Bad Trade’ may be switching from a diesel car to a non-hybridised gasoline car. The same vehicles viewed through the lens of CO2 emissions show that on average, gasoline vehicles are, like-for-like, a ratings class worse than diesels for absolute CO2 emissions. They also exhibit a greater disparity between NEDC measurements and actual emissions. For example, the 2017 Audi Q2 diesel, achieves A+ for air quality and C2 for CO2. The same power output gasoline equivalent model from the same year also achieves A+ for air quality, but a lower D4 for CO2. C means 150-175g/km CO2; D means 175-200 g/km, but the numbers 2 and 4 respectively show that the gasoline engine model is at greater variance from the officially claimed figures. This example highlights an element of the trade-off involved if tackling air quality results in a more gasoline-dominant fleet.
In summary, the right scrappage and retrofit schemes could incentivise consumers towards vehicles that are genuinely clean and genuinely efficient, taking into account not just NOx emissions, but also CO2 and particulates. This would contrast with the UK’s 2009 scheme that merely required customers to scrap their old car for any new vehicle. A stratified and discriminating scheme would require a more focussed replacement, resulting in better results both for air quality and climate change.
* Bert Van Wee, Gerard De Jong & Hans Nijland (2011) ‘Accelerating Car Scrappage: A Review of Research into the Environmental Impacts’, Transport Reviews, 31:5, 549-569, DOI: 10.1080/01441647.2011.564331
Cutting pollution and improving public health
Pollution is a major contributor to chronic human sickness, not just environmental damage, according to the 2017 annual report of England’s Chief Medical Officer, Professor Dame Sally Davies, released on 2 March 2018: https://www.gov.uk/government/publications/chief-medical-officer-annual-report-2017-health-impacts-of-all-pollution-what-do-we-know. The report made 22 policy recommendations, many of which related to monitoring and ameliorating pollutant emissions.
Pollution is a major contributor to chronic human sickness, not just environmental damage, according to the 2017 annual report of England’s Chief Medical Officer, Professor Dame Sally Davies, released on 2 March 2018: https://www.gov.uk/government/publications/chief-medical-officer-annual-report-2017-health-impacts-of-all-pollution-what-do-we-know. The report made 22 policy recommendations, many of which related to monitoring and ameliorating pollutant emissions.
Emissions Analytics is pleased to have had its EQUA Index real-world emissions rating system (www.equaindex.com) cited in the report. With the failure of the previous EU vehicles emissions regulatory regime, having led to around 40 million high-NOx-emitting diesels on European roads, the need to base policy on real-world emissions has grown, as illustrated in the chart below. Each point represents a vehicle we have tested, and the horizontal line shows the regulated limits.

It is clear that at each Euro stage the cleanest vehicles have been getting cleaner, while the dirtiest vehicles have not. Therefore, any system of discriminating between vehicles based only on Euro stage will be highly inefficient as it will involve permitting some vehicles with high real-world emissions. The particularly problematic Euro stages are 5 and 6, within which there are significant spreads from the best to the worst. For example, the dirtiest Euro 6 diesels are six to seven times higher emitting than the cleanest Euro 5. More striking still, the dirtiest Euro 6 diesels are around three times worse than the cleanest Euro 3/4 vehicles, last of which were type-approved in 2009.
In summary, using the EQUA Indices would allow governments and cities to target only those vehicles which are high emitting in practice, minimising the private and public cost. Any system based only on official Euro standards would be costlier and less efficient. Estimates of the benefit suggest that 54% of Euro 6 diesels would have to be restricted from urban areas to achieve an 87% reduction in nitrogen oxide emissions.
Many of the Chief Medical Officer’s recommendations revolve around the need for evidence-based action. This has been dramatically lacking in emissions policy, due to the difficult choices it would present.
One recommendation specifically calls on local government and public health professionals to implement concrete solutions. The Mayor of London’s publishing of the EQUA Aq ratings for NOx on its official website (www.london.gov.uk/cleaner-vehicle-checker/) is an example of proven action that could be applied in any city across Europe. Another recommendation talks about providing toolkits to assist local authorities. With the challenges of Clean Air Zones, the priority is to link up the existing empirical evidence with policy action on the ground.
An example of this is when regulating against particulate number emissions: current certification of particle number (PN) emissions is down to 23 nanometres in size. However, ambient pollution laws still focus on PM2.5, or 2500 nanometres in size. The concern about ultrafine particles has been growing, as the penetration of direct injection gasoline engines has increased.
Latest test data from Emissions Analytics also suggests than certain diesels are now lower in CO2, carbon monoxide (CO) and PN emissions that many gasoline cars, and equivalent levels of NOx. This should be carefully borne in mind as policy increasingly slants away from all diesels.
The Chief Medical Officer’s report also recommends a standardised approach to pollution surveillance and road charging to give vehicle drivers a simple and consistent system. While the new Real Driving Emissions (RDE) regulation is robust, it is not simple and consistent, which will limit its effect in rebuilding consumer trust. In particular, previously launched cars will not be systematically retested on RDE and therefore there will be no comparability with new cars.
Finally, the current lack of trust in car manufacturers is not to the benefit of them, consumers, the market or society. A further recommendation calls for transparency on the part of industry as to the polluting effect of their activities. Emissions Analytics believes this is a necessary first step to rebuilding that trust.
Emissions Analytics hopes the simple, independent and free-access nature of the EQUA Index is a good place to start to reassert evidence-based policy and the health of the automotive industry.
Archive
- AIR Alliance 3
- Air Quality 38
- Audio 3
- Climate Change 14
- EQUA Index 21
- Electrified Vehicles 28
- Euro 7 3
- Fuel Consumption/Economy 20
- Fuels 4
- Infographic 18
- Media 4
- NRMM/Off-road 3
- Newsletter 103
- Podcast 7
- Presentation/Webinar 18
- Press Release 19
- Regulation 16
- Reports 4
- Tailpipe Emissions 49
- Tyre Consortium 2
- Tyre Emissions 26
- Vehicle Interior 6