


New EQUA Index reveals true pollutant emissions for car buyers
With Mitsubishi Motors the latest manufacturer to admit to impropriety in its testing procedures, the need for impartial real-world data has never been greater.
With Mitsubishi Motors the latest manufacturer to admit to impropriety in its testing procedures, the need for impartial real-world data has never been greater. Today Emissions Analytics is launching the new EQUA Index rating scheme to help bring transparency in the first instance to the issue of air quality.
The EQUA Air Quality Index is based on the level of emissions of nitrogen oxides (NOx) in grams per kilometre emitted during our real-world tests. The Index aligns the boundaries between ratings values as much as possible with recognisable points. See below:

The EQUA Air Quality Index is intended to complement the forthcoming regulations for new vehicle certification, by monitoring vehicle performance when driven normally on roads; in effect keeping a watchful eye on the effectiveness of the new regulations.The problems with the existing test system, the NEDC, which have been the cause of so many of the issues covered by the media recently, are already being addressed by regulators in Europe. From 2017 the World Harmonised Light Duty Test Protocol (WLTP) will change the way CO2 is measured and Real Driving Emissions will address problems with NOx measurement.

The other great benefit of the EQUA Air Quality Index is to help car buyers. Designed to be clear and concise, the simple A to H rating allows manufacturers and retailers to show how different models compare in the showroom, whether diesel, petrol or hybrid. It is also ideal for car reviewers and publishers to include as new cars are reviewed. And because the scheme is independently financed and researched, consumers, companies and the wider automotive industry can have confidence in the impartiality of the data.
The EQUA Air Quality Index has been developed by Emissions Analytics in conjunction with a group of experts to guide, review the test and rating methodology, monitor the regulatory context, and provide input into the wider development of the index. The group includes:
Professor Helen ApSimon – Air Pollution Studies, Imperial College London, UK
Dr Adam Boies – Department of Engineering, The University of Cambridge, UK
John German – Senior Fellow, The International Council on Clean Transportation, USA
Dr Marc Stettler – Centre for Transport Studies, Imperial College London, UK
Professor Martin Williams – Air Quality Scientist, King’s College London, UK
There are almost 450 vehicles on the EQUA Air Quality Index now, so why not have a look?

Snapshot #9: Class matters when it comes to MPG
We looked at our data on over 750 EU cars tested, to see how much of an influence vehicle class was on variance between the NEDC-derived official MPG and our cycle
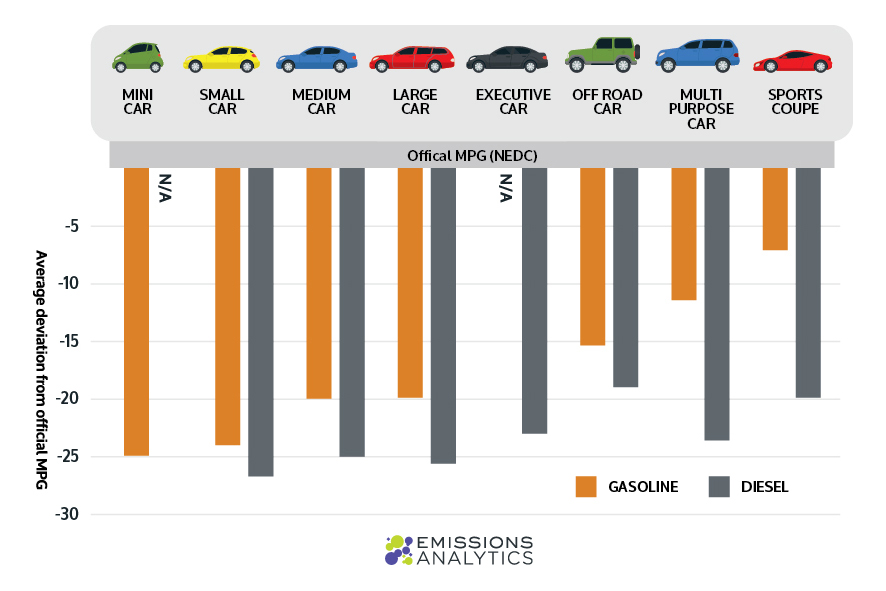
We looked at our data on over 750 EU cars tested, to see how much of an influence vehicle class was on variance between the NEDC-derived official MPG and our cycle and found:
Petrol sports cars come closest to their official figures
The MPG gap is worse for small cars, whatever the fuel
Overall the gap is almost always bigger for diesel engines.

Do a PhD with King’s College London and Emissions Analytics
Characterising non-road mobile machinery emissions through portable emissions testing and emissions inventory development
Characterising non-road mobile machinery emissions through portable emissions testing and emissions inventory development
An exciting opportunity exists to investigate the emissions from vehicles and generators on construction sites working with academic, industry and government partners to deliver a scientifically ground breaking and policy relevant PhD. Current emissions inventories estimate that Non-Road Mobile Machinery (NRMM) contributes approximately 10% of the NOX and PM10 emissions within London. However, there is a large uncertainty in this estimate as very few real-world emission measurements have been made of these sources, instead relying on engine test beds and activity estimates have been based on simplified assessments of construction activity. This project aims to address both of these aspects by undertaking state-of-the-art Portable Emissions Measurement System (PEMS) tests on NRMM machinery and utilising the latest information available through London’s NRMM register to assess the fleet activity. An opportunity also exists to test innovative emissions abatement solutions to provide policy-relevant scenario testing for emissions abatement.
For full details about the project, please visit http://www.kcl.ac.uk/health/study/studentships/div-studentships/aes/green.aspx

Has fuel economy started to fall?
Average fuel economy has fallen for the first time since Emissions Analytics began its real-world test programme in 2011.
Average fuel economy has fallen for the first time since Emissions Analytics began its real-world test programme in 2011. Not only that but the ‘gap’ between official figures and our results did not widen last year. The reason for this appears to be intrinsically linked to the introduction of the Euro 6 emissions standards. This newsletter looks to explain what our data is showing and what this means for fuel economy and CO2 targets in the future.
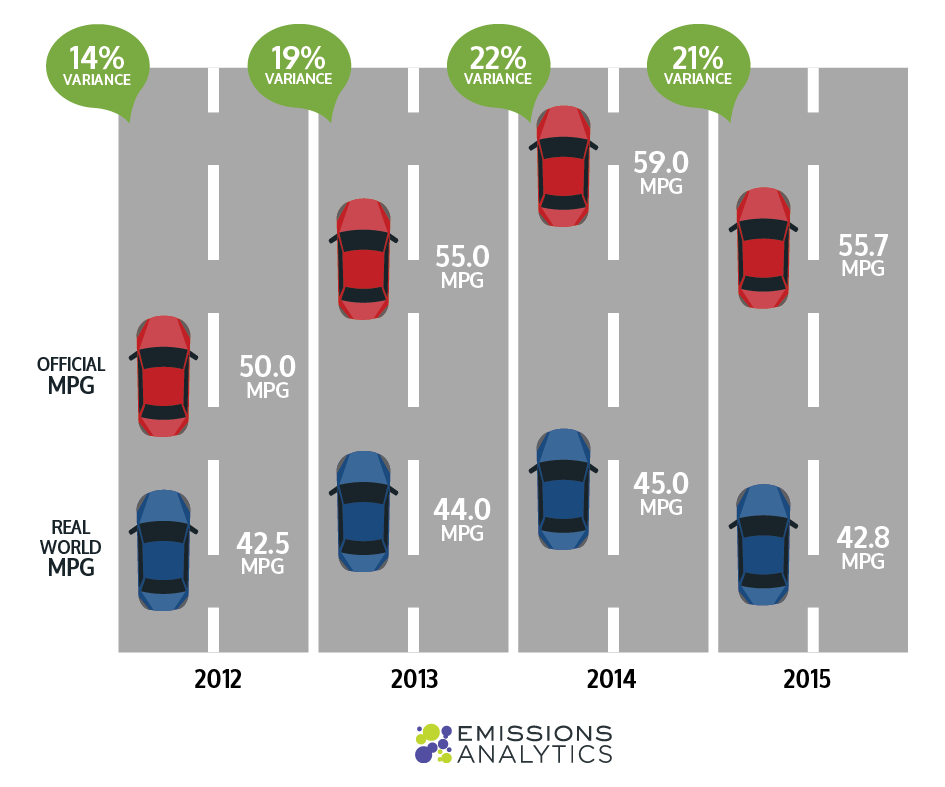
Evident in our recently published infographic, pictured above, fuel economy has dropped by 3.3 mpg in 2015 and the ‘gap’ has shrunk slightly from 21.5% in 2014 to 21.3% in 2015.
The explanation for this change is due to two main factors, around the mix of vehicles tested and the typical performance of the latest diesel engines. As Emissions Analytics tests vehicles around the time they are launched, there is inevitable fluctuation in the types tested, and hence the mix. This was made more notable with the introduction of the Euro 6 emissions regulations for all new vehicles sold from September 2015.
In the run-up to this deadline, the last of the Euro 5 vehicles had a strong bias towards larger, more powerful vehicles, with lower fuel economy. Perhaps manufacturers were concentrating on releasing the Euro 6 versions of their high volume models first, leaving compliance for the lower-selling or harder-to-comply models until the end of the Euro 5 window.
At the same time as this mix effect, 2015 also saw a reduction in the average fuel economy of the Euro 6 diesel cars tested. These were on average 5.4% less fuel efficient than the Euro 6 diesels tested in 2014. This is likely to be due to some combination of the mix of makes and models launched and in many cases the additional fuel requirement of the NOx abatement systems. In contrast, Euro 6 petrol vehicles tested in 2015 saw a 5.8% improvement in fuel economy compared to those tested in 2014 – these vehicles did not have extra NOx after-treatment systems.
This led us to look at whether the conformity factor (ratio of emissions in real-world driving to the regulated emissions level) for Euro 6 NOx was improving over time and what we found was:
Year Conformity Factor
2013 6.7
2014 2.7
2015 3.5
In 2013 we tested just five Euro 6 models, all early adopters of the new technology, which had showed a high average NOx conformity factor, and also a wide spread. In 2014, it appears that well-placed manufacturers brought mainstream Euro 6 models to market with low conformity factors averaging just 2.7. By 1 September 2015, all models had to be Euro 6 compliant, so included model less well optimised after-treatment systems, perhaps driving the average conformity factor back up.
What can also be seen, however, is that the recently upheld Real Driving Emissions NOx Conformity Factor of 2.1 from 2017 is readily achievable for many, with 29% of models already meeting this level in real-world driving, according to Emissions Analytics’ database.

Round up of average fuel economy for 2015
Round up of average fuel economy for 2015 - Infographic


Motor Trend: The world’s two most efficient internal combustion cars
Real-world testing of hybrids in California read more

CarAdvice: Opel alleged to be secretly fixing cars with illegal NOx emissions
One of Belgium’s national TV networks is claiming that Opel is secretly performing upgrades on some of its diesel-powered vehicles, to reduce harmful emissions. Read more.

Cargo weighs heavily for some LCVs
You may remember back in February we announced we were going to extend our test programme to include light commercial vehicles.
You may remember back in February we announced we were going to extend our test programme to include light commercial vehicles. Well, testing has been underway for the last few months and we have found that fuel economy and nitrogen oxide (NOx) emissions vary considerably depending on whether or not vehicles are fully laden. Our sample is currently small, but we wanted to share some early results.
A van used for work is rarely empty so unlike the official tests, our cycle is repeated twice, first empty and then again at 100% payload. We have tested a number of the most popular Euro 5 vans on the road today and the average impact on fuel economy and NOx by manufacturer when driven fully laden can be seen on the graph below.

Across all vans we have tested, NOx levels are 5.9 times the Euro 5 limit of 180 mg/km when tested empty on our real-world route. Fill these vehicles to 100% of their individual payloads and this ‘exceedance factor’ increases to 12.2 times the legislated limit. However, the impact of load varies from vehicle to vehicle. For instance, Volkswagen produces the cleanest van for NOxwhen empty and despite a 225% increase when full, this vehicle is still the cleanest we have seen. The Ford vans, on the other hand, are higher than the Volkswagen unladen (7.1 times the limit) but this barely increases when full (to 7.6 times), leaving them only marginally more emitting than the Volkswagen.
Fuel economy

Like passenger cars, vans deliver a worse fuel economy on the road than during the official NEDC cycle. The average for the vans we have tested is 14% below official MPG figures when tested empty. Fill them up and the average MPG drops to 27% below the NEDC figures. Just like NOx , there is variability between different models. So far, the Renault gets closest of all the vans tested to its official MPG result (2% below), but suffers badly when laden, dropping a further 13%, whereas load has the smallest impact on the Citroen with a 5% penalty.
It is also interesting to note that there is very little variance between urban and extra-urban driving, for example at 50% load. Typically, unladen, extra-urban MPG would be higher than urban, but the increase in rolling resistance means than on average we found MPG at the higher speeds was 2% lower than in urban driving.
Our programme of van testing is on-going and will grow in 2016. The data so far shows – potentially even more so than for cars – that it is vital to match the right van to the right usage. There are very different characteristic performances between the vans tested so far, making the best purchase decision highly dependent on whether it will be used mainly for urban delivery driving, long distance trunking or carrying heaving loads.

CO2 variance from official results by country
O2 variance from official results by country - Infographic


Real Driving Emissions – How REAL is it?
With the recent Volkswagen scandal focussing the world’s attention on the air quality problems associated with diesel cars, campaigners for clean air have expressed dismay over the EU’s decision not to impose stricter rules for testing new cars on the road.
With the recent Volkswagen scandal focussing the world’s attention on the air quality problems associated with diesel cars, campaigners for clean air have expressed dismay over the EU’s decision not to impose stricter rules for testing new cars on the road. However, Emissions Analytics data shows that full compliance with the Euro 6 limits on oxides of nitrogen (NOx) is already being achieved by some vehicles, and thinks that the industry is on course to clean up dirty diesels.
What is interesting to note from the graph below is that of the 400+ vehicles tested by Emissions Analytics, only one Euro 5 car met the Euro 5 NOx limit, whereas four Euro 6 vehicles have already met the more challenging 0.08g/km Euro 6 regulation. The spread of NOx levels has also reduced in absolute terms with Euro 6, although proportionately the spread is similar to the Euro 5s before them. It is also abundantly clear that the majority of cars we have tested have failed to meet the regulations in real-world driving, with the average NOx levels four times more than they were certified as emitting.

The introduction of a Real Driving Emissions test (RDE) is set to reduce this divergence between laboratory results and real-world driving. Yet the announcement of the Conformity Factors last week, which set the levels of NOx vehicles are permitted to achieve during RDE, have been criticised by many as being too lenient. Our data shows that 36% of Euro 6 diesels have already met the 0.168g/km implied by the 0.08g/km limit plus the Conformity Factor of 2.1 that will come in from 2017 onwards and apply until 2020/1. However, taking into account the test-to-test variability with portable testing, which the Joint Research Centre of the EU recently estimated at up to 30%, manufacturers will need aim for emissions below the 0.168g/km to avoid being caught out during the RDE test. Using that variability number would suggest manufacturers will need to target 0.129g/km. This means that the 0.08g/km limit will be exceeded by around 60% on average in real-world driving. Of the Euro 6 diesels we have tested, 29% already meet this limit, as well as all gasoline cars.
Finally, all models will not need to comply until September 2019, and therefore we conclude that the new regulations as currently proposed will prove easier to achieve than might have been expected, even though some manufacturers and models have a greater task than others. As ever, we will be monitoring the situation and will report back with an update soon.

How PEMS works
A Portable Emissions Measurement System (PEMS) is used to measure vehicle emissions on the road rather than in the laboratory. This methodology, soon to be included as part of the official test for new cars, is used by Emissions Analytics to build a detailed database of real-world emissions.
A Portable Emissions Measurement System (PEMS) is used to measure vehicle emissions on the road rather than in the laboratory. This methodology, soon to be included as part of the official test for new cars, is used by Emissions Analytics to build a detailed database of real-world emissions. Data from over 1000 real-world vehicle tests is available via subscription. Contact us for further details


The first 1000 cars we have tested grouped by manufacturer
The first 1000 cars we have tested grouped by manufacturer - Infographic


Consumers being mislead on emissions – with or without illegal acts
We set up Emissions Analytics four years ago to understand the differences in emissions and fuel economy between the laboratory test and real-world driving conditions in Europe and the United States.
We set up Emissions Analytics four years ago to understand the differences in emissions and fuel economy between the laboratory test and real-world driving conditions in Europe and the United States. Over that time, Emissions Analytics has tested over 1000 cars in Europe and the United States, including over 200 European diesel passenger cars, and makes this data commercially available to many parts of the automotive industry to help bring about a better regulatory regime and help rebuild trust between car manufacturers and consumers.
The illegal action of one manufacturer in the United States threw light, in dramatic fashion last week, on a European situation of higher than expected real-world emissions generated wholly or largely through legal activities. Even legal activity, where it gives rise to misleading results, can be enough to cast wrongful doubt on a whole industry. Having robust, independent real-world emissions data that can sort good from bad is the future, and we plan to lead this.
To summarise the facts in the European market, we have found that real-world emissions of the regulated nitrogen oxides are four times above the official level, determined in the laboratory. Real-world emissions of carbon dioxide are almost one-third above that suggested by official figures. For car buyers, this means that fuel economy on average is one quarter worse than advertised. This matters, even if no illegal activity is found. These differences may well be explained by limitations in the official system, rather than through illegality.
Emissions Analytics has been highlighting these issues for some years now, along with many partners who have analysed our results as well as similar data from other sources. In order to make our findings more accessible and useable to the market, we will be launching an independent accreditation initiative, and we invite all interested parties to participate.

Air quality…it’s hotting up
Will 2015 be recognised as a turning point in the campaign for clean air? It certainly has the potential to as there are a number of threads which, if they come together, could determine the future prospects for urban air quality in Europe.
Will 2015 be recognised as a turning point in the campaign for clean air? It certainly has the potential to as there are a number of threads which, if they come together, could determine the future prospects for urban air quality in Europe.
For instance, the second stage of the Euro 6 regulations for passenger cars will come into force from September. All new cars registered will need to meet reduced limits for NOx, albeit still measured on the artificial laboratory New European Driving Cycle (NEDC).
Also, negotiations will come to a head in the EU around the Conformity Factor for the third stage of the Euro 6 regulations. This will see the use of Portable Emissions Measurement Systems (PEMS) becoming mandatory for the first time. Emissions Analytics has argued long for such portable testing in real-world driving, so this is significant progress. However, a high Conformity Factor (the permissible exceedence of the regulated limits) for a long period could limit the effectiveness of the regulation.
Additionally, the UK government must come up with a new air quality plan after its defeat in the Supreme Court. The activist legal group, ClientEarth, accused the government of failing to meet legal limits for air pollution and the Supreme Court found in its favour, instructing the government to draw up a new plan by the end of 2015.
So, let’s take stock of what Emissions Analytics’ real-world test data is telling us on these points.
The second stage of the Euro 6 regulations is likely to reinforce the existing trend of significantly reducing NOx, but there will still be large exceedances over the regulations. Emissions from Euro 6 diesels are on average 0.340 g/km when they should be 0.08g/km, although this is a 54% reduction on the 0.736 g/km from Euro 5. The issue is much less for gasoline vehicles, which are on average 24% below the 0.06g/km limits. However, 22% of vehicles tested by Emissions Analytics did not meet the limit.
Regarding the Conformity Factor at the third stage of Euro 6, there is growing evidence that, in time, a low factor is viable. Across all Euro 5 diesels we tested, just one met the regulated level. So far for Euro 6 four have already met the limit, using a mix of selective catalytic reduction (SCR) and lean NOx trap (LNT) after-treatment systems. There is still much work to do, but the evidence shows that the limits themselves could be met.
A new version of the UK’s air quality plan is being written by the Department for Environment, Food and Rural Affairs and Secretary of State Liz Truss has announced consultation “later this year”. Crucial in our view will be the understanding and modelling of primary NO2 emissions, as this is a major contributor towards roadside pollution yet is not specifically regulated by Euro 6. Emissions Analytics has found that the variation in this fraction of NO2 in NOx between models has also grown, as a result of differences in after-treatment technologies; for Euro 6 diesels it is 17%-80%, where previously is was 27%-70% in Euro 5 models.
To assist the industry in making a success of Euro 6, Emissions Analytics recently launched an online database of its results, which will be updated in real-time as it continues its rolling test programme. We don’t know yet how these important developments will impact urban air quality but we will be tracking it closely.


The impact of cold starts on NOx emissions
The impact of cold starts on NOx emissions - Infographic


Average fuel economy is a reflection of the cars we drive
Average fuel economy is a reflection of the cars we drive - Infographic

Archive
- AIR Alliance 3
- Air Quality 38
- Audio 3
- Climate Change 14
- EQUA Index 21
- Electrified Vehicles 28
- Euro 7 3
- Fuel Consumption/Economy 20
- Fuels 4
- Infographic 18
- Media 4
- NRMM/Off-road 3
- Newsletter 103
- Podcast 7
- Presentation/Webinar 18
- Press Release 19
- Regulation 16
- Reports 4
- Tailpipe Emissions 49
- Tyre Consortium 2
- Tyre Emissions 26
- Vehicle Interior 6