

Do the benefits of stop-start technology outweigh the irritations?
The principle behind stop-start technology makes sense. Turn off your engine whilst it is not needed, for instance at red traffic lights, and you will save fuel and reduce emissions.
The principle behind stop-start technology makes sense. Turn off your engine whilst it is not needed, for instance at red traffic lights, and you will save fuel and reduce emissions. However, at EA we wanted to know just how much of a difference it really makes and so we mined our database of 900 real on-road tests to find out.
First we looked at the test results from a VW Golf fitted with stop-start technology, crunched the numbers and found it spent 9% of our test idling, or rather in the off-mode. For this fairly typical diesel vehicle, 0.4g of CO2 is saved per second that the engine is switched off. Extrapolate this and, as the table below shows, drivers of this model do see some benefit from having engines equipped with stop-start technology.
During the official New European Drive Cycle (NEDC) the car spends 24% of the time idle. So when we ran our Golf data through this test the resultant fuel efficiency was supposedly even greater.

Admittedly, the analysis above only considers one vehicle and it is still based on a test cycle, albeit our real on-road cycle rather than in the lab. However, earlier this year for Channel 4’s Dispatches programme, EA fitted a data logger to a real driver’s car and tracked it for a week. Data from this real-world experiment showed that this Seat Alhambra spent 8% of its time idling. Very similar to the 9% of time the Golf was in off-mode but a far cry from the 24% anticipated by the official tests.
Interestingly, our data also shows that exhaust temperature drops by about 40% when the engine switches to the off-mode. When the engine re-starts the temperature quickly rises again. However, this can often coincide with a period of acceleration as the vehicle pulls away, which may mean higher NOx emissions. Thus careful thermal management strategies need to be employed by the manufacturers to ensure their exhaust after treatments are still effective against NOxemissions, which is something EA will be studying in more detail in the future.

Stop-start technology is a particularly attractive proposition for manufacturers looking to achieve a high MPG result and low CO2 rating on the NEDC. Drivers will see some benefits, just not as much as published because the NEDC is flattering the result due to its high proportion of stationary time. So, if you can cope with the annoyance factor of having your engine switch off every time you pull up it is worth having.

Growth in the MPG gap since EA started measuring real on-road performance
Growth in the MPG gap since EA started measuring real on-road performance - Inforgraphic


The end of the road for dirty diesels?
We have been listening to the proposals to discourage ‘dirty diesels’ by cities across Europe, and read with interest the statement from the Society of Motor Manufacturers and Traders (SMMT), speaking up in favour of the diesel car. In our opinion, the evidence from real-on-road tests speaks for itself.
We have been listening to the proposals to discourage ‘dirty diesels’ by cities across Europe, and read with interest the statement from the Society of Motor Manufacturers and Traders (SMMT), speaking up in favour of the diesel car. In our opinion, the evidence from real-on-road tests speaks for itself.
Our research shows Euro 5 standard diesels and earlier are indeed ‘dirty’. They produce high levels of NOx which is harmful to human health. Emissions are particularly bad in urban environments because NOx emissions correlate more closely with incidences of acceleration than speed, thus the stop-start nature of city driving exacerbates air pollution. And, it is made worse by the high number of older diesel buses, taxis and delivery vehicles in the urban environment.
To help combat this problem, the legal limit for NOx emissions was reduced to 0.08g/km with the introduction of the Euro 6 standard for passenger cars, effective from September 2014. We tested a number of the earliest Euro 6 diesels on the market and found that they produced levels of NOx which were seven times above the legislated limits. You can read more about it in the ICCT’s 2014 report, to which EA contributed data.
However, our latest tests show that many newer Euro 6 diesels are showing marked improvements, with NOx levels averaging 2.5 times above the legislated limit. In addition, great strides have been made to clean up new buses and the NOx emissions are now very low from many of these vehicles. Another concern with diesels is the emissions of particulates which are linked to heart and lung disease. However, this issue was addressed with the Euro 5 standard which saw the addition of diesel particulate filters to the exhaust system, which has significantly reduced this problem.
Automotive manufacturers have been investing in NOx abatement technologies and strategies in anticipation of the forth-coming legislative changes which will require an element of real on-road testing, known as Real Driving Emissions. In future it will no longer be sufficient to simply pass the test, manufacturers will also have to demonstrate that their vehicles also comply when driven in the real world.
This can only be to the benefit of urban air quality and thus we agree with the SMMT in that a simplistic ‘demonisation’ of new diesels is not correct. In fact, careful attention needs to be paid to other technologies creating emissions increases, such as direct injection gasoline engines. Nevertheless, there are issues with diesels that are not captured by the regulations, for example the proportion of NOx that is emitted as NO2, the more harmful component. Our research shows that this proportion can be as high as 90% in urban driving, much higher than generally acknowledged.
Emissions Analytics has been leading research in these areas, for example with Imperial College London through the Air Pollution Research in London group, to ensure that the clean-up of diesel engines continues to translate into reality.

Weighing the cost of a new van
EA is in the business of improving the quality and availability of data in the automotive sector and so we will soon be introducing on-road testing for light commercial vehicles in the UK, helping consumers make informed decisions about which vehicle to buy with an easy to use miles per gallon calculator.
EA is in the business of improving the quality and availability of data in the automotive sector and so we will soon be introducing on-road testing for light commercial vehicles in the UK, helping consumers make informed decisions about which vehicle to buy with an easy to use miles per gallon calculator.
A major contributing factor to fuel economy for vans and pickup trucks is the load on board. So, in addition to our standard fuel economy test, we will include repeat cycles with the vehicle fully laden at its maximum payload. This will enable the buyer to consider how they expect to use the vehicle and find out what effect this will have on their fuel consumption.
In a 2014 report, the RAC Foundation found that the carriage of equipment, and delivery and collection of goods accounted for 79% of the mileage of light commercial vehicles in the UK. However, this is unquantified in the official tests.
The regulators would argue that testing vans and trucks unladen provides a level playing field, allowing for comparisons between vehicles. Yet in this sector of the market, carrying capacity varies within a CO2 class. The fully laden Ford Transit Courier can carry 112kg (247lb) more than the Vauxhall Corsavan but both record CO2 of 103g/km. In theory they should give the same fuel economy – but only if driven empty!
USA perspective
Although the EPA’s five-cycle test regime produces official figures which, on average, more closely match real-world performance than in Europe, the test still does not account for a fully-loaded vehicle.
Thus the question facing the consumer, who is purchasing a vehicle for its intended purpose, to carry stuff, is the same on both sides of the Atlantic – how much will it really cost to run?
We have been addressing this issue from our Motor Trend test centre in Los Angeles, looking into the impact of variable payload. For example, when we packed the Nissan NV200 with bags of cement increasing its payload to 1132lb (513kg) – its maximum is 1470lb (667kg), and drove it on our 88-mile (142km) city and highway test route, we saw a reduction in fuel economy from 25mpg to 22mpg (US gallons). Read more. Based on the average distance driven of 15,000 miles, that equates to an additional 82 gallons (310l) of fuel per year, which multiplied by the 8 million or so new commercial vehicles registered each year is a lot of extra gas.

Vans and pickups are an increasingly important sector for UK and US drivers, so this data will help us understand their real-world performance. Watch this space for trends and observations as UK testing gets underway in March 2015.

Ploughing ahead with tractor testing
Working with Emissions Analytics, engineering researchers at Harper Adams University have developed a new method to accurately measure the exhaust emissions of agricultural machinery.
Working with Emissions Analytics, engineering researchers at Harper Adams University have developed a new method to accurately measure the exhaust emissions of agricultural machinery.
Traditionally, machines such as tractors are tested in controlled environments such as a soil hall, not taking into account the many variables from real-life scenarios, which result in transient engine loads.
With support from CLAAS and EA, the postgraduate students used PEMS equipment quite literally in the field. Two engine exhaust after treatment systems commonly used by tractors to reduce emissions were tested; a CLAAS Axion 830 with a selective catalytic reduction system and a CLAAS Arion 650 using exhaust gas recirculation combined with a diesel particulate filter.
Both tractors were trialled in three conditions – using a dynamometer to add a variable load to the PTO shaft; road testing at high speed with a fully laden trailer; and in a field with a subsoiler and power harrow. As with road vehicles the CO, CO2, NOx and THC data was combined with vehicle data such as GPS position, engine load and speed.
The project was designed to investigate the differences between theoretical CO2 conversion factors and real-world factors for non-road mobile machinery; and to demonstrate the feasibility of using PEMS equipment for such a task. The results, analysed by Miles Metcalfe with supervision from PhD student Rob Fillingham, were written up for his MEng Agricultual Engineering dissertation for which he was awarded a first class.
Metcalfe demonstrated that the assumed linear relationship between engine load and CO2 conversion factor was in fact better suited to an exponential curve, and that by using the traditional conversion factors supplied by DEFRA, CO2 is in fact being over estimated as there is a significant difference of p<0.001 between the DEFRA value and the PEMS result.
Observations made, such as an increase in CO2 conversion factors whilst the tractor was turning at lower engine speeds or loads at the field’s headlands, show that this innovative collaboration between Emissions Analytics and the agricultural sector has the potential to allow farmers to not only save fuel but reduce damaging emissions by using data gathered from real agricultural practices. And, as regulations change for N-RMM, the power of PEMS to measure compliance is evident.

A year of data from Emissions Analytics
Emissions Analytics specialises in the analysis and interpretation of complex data sets.
Emissions Analytics specialises in the analysis and interpretation of complex data sets. So here is a festive round-up of a few of our own numbers for the year:
True MPG results supplied to What Car? for 186 vehicles in 2013
Launch of Real MPG for Motor Trend magazine in the USA, 71 cars tested so far
16,000 miles driven on real roads in the UK and US
41,000 miles driven at the track for clients’ testing projects at home and abroad
An average of 185 grams of carbon dioxide emitted per kilometre
Largest engine tested this year was 12.9 litres
The smallest was 875cc
The average MPG was 44.5, with the worst just 20.5 and the best 71.7 (a hybrid).
Merry Christmas and a Happy New Year from the Emissions Analytics team.

DPF Regeneration Mysteries
There are two types of diesel particulate filter (DPF) regeneration which can occur without external intervention by the driver or a mechanic.
There are two types of diesel particulate filter (DPF) regeneration which can occur without external intervention by the driver or a mechanic. The first is passive regeneration which happens when high exhaust temperatures reached during intensive use (normally either long spells of motorway driving or hill climbing) automatically burn off the trapped diesel particles. The other is active regeneration of the DPF where the ECU is programmed to initiate post combustion fuel injection to increase the exhaust temperature and burn away diesel particles when the filter becomes around 45 per cent full.
If either type of regeneration occurs whilst we are conducting an on-road emissions test we have to scrap the test and start again. So, we keep a careful eye on the exhaust temperature, which we measure using our PEMS equipment, to monitor spikes which indicate regeneration. As a result of this process we have recorded the regeneration activity, in terms of both occurrences and emissions output, and the results are not what you might expect.
One thing we have noticed is that regeneration will often happen after the extra-urban phase of the test, during the urban phase. Thus the opportunity for passive regeneration has been missed and active regeneration takes place instead.
Why does this matter? Well, firstly there is the cost to the operator as active regeneration requires the engine to work harder to reach the required temperature and this reduces fuel economy by as much as 5mpg. But not only that, as can be seen from the graph below, active regeneration has a significant and negative impact on NOx emissions.
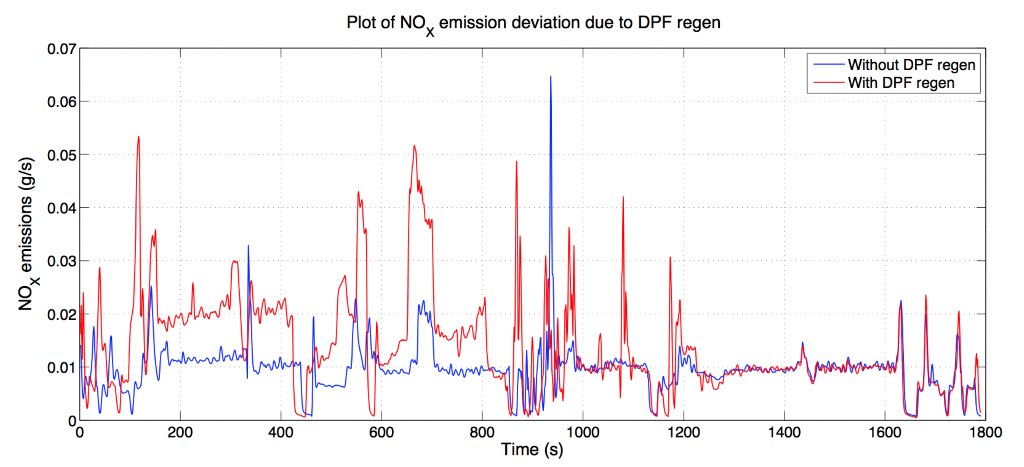
Graph by Joseph Ruxton, Imperial College London robin.north@imperial.ac.uk
NOx, a major source of air pollution, can as much as double during regeneration due to late fuel injection and increased engine temperatures. If this happens in town and city environments rather than on the motorway, it could have an even greater negative impact on human health. Although it should be noted that the negative effective of the rise in NOx is offset somewhat by the primary NO2 reduction the regeneration is designed to achieve.
Another observation on active regeneration concerns the new cars we test. Because every vehicle What Car? receives to test drive and review is passed to Emissions Analytics who then tests it to record the data which powers True MPG, many of the cars we are testing are very new, with only a few hundred miles on the clock, if that. Yet we are finding that active DPF regeneration can on occasionally take place during the course of the urban phase of our test. It is unlikely that the DPF is 45 per cent full on such a new vehicle, so what is the trigger for regeneration? We haven’t found the answer to this yet, so if you have any ideas please do get in touch.
More still needs to be understood on the impact of DFP regeneration in real-world conditions and Emissions Analytics is working with Imperial College London to provide data and analysis to investigate the subject further. What is clear is that the anomalies described above, combined with the issue of illegal removal of DPFs from older vehicles, means that it is likely that more discussion on this subject will be required in the near future.
Please feel free to use or share this information with a credit to Emissions Analytics.
Archive
- AIR Alliance 3
- Air Quality 38
- Audio 3
- Climate Change 14
- EQUA Index 21
- Electrified Vehicles 28
- Euro 7 3
- Fuel Consumption/Economy 20
- Fuels 4
- Infographic 18
- Media 4
- NRMM/Off-road 3
- Newsletter 103
- Podcast 7
- Presentation/Webinar 18
- Press Release 19
- Regulation 16
- Reports 4
- Tailpipe Emissions 49
- Tyre Consortium 2
- Tyre Emissions 26
- Vehicle Interior 6