

New Porsche Taycan Turbo S electrical vehicle testing in partnership with Motor Trend
In our quest to understand the real-world emissions and efficiency of motor vehicles, we were pleased to be able to test the new Porsche Taycan Turbo S electric vehicle (EV) in California, with our partners Motor Trend.
The recurrent scourge of technology preference
and the fallacy of zero emission
In our quest to understand the real-world emissions and efficiency of motor vehicles, we were pleased to be able to test the new Porsche Taycan Turbo S electric vehicle (EV) in California, with our partners Motor Trend www.motortrend.com
The punchline was a range, on our EQUA Real Mpg test, of 254 miles, reflecting a combined efficiency of 2.2 miles per kWh or 73.4 Mpg-equivalent (converting the electricity to a gasoline equivalent based on energy content). The test route is made up a of a combination of city and highway driving over approximately 100 miles, and includes measurement of charging losses in the efficiency calculation. So, the Taycan does not have best-in-class EV efficiency, but it exceeded its official figure by an impressive 32%, and is arguably a striking looking and beautifully made vehicle.

But does efficiency in an EV matter? Is an EV always so much better, and its carbon dioxide (CO2) commensurately so much lower, than a typical internal combustion engines (ICE), that efficiency is of secondary importance?
Considering a recent paper in Nature Sustainability from March 2020 by Florian Knobloch et al entitled ‘Net emission reductions from electric cars and heat pumps in 59 world regions over time’, a typical EV in the US emits CO2 of around 354 g/mile (over an average life of around 93,000 miles), of which approximately half is accounted for by the electricity in the usage phase. So, 177 g/mile can be put down to electricity production, distribution, consumption and attendant storage and charging losses. Let’s assume for the purposes of this document that the Taycan is similar to this average vehicle.
A near equivalent pure ICE is the Porsche Panamera 4, which has tailpipe CO2 of 407 g/mile from the US Environmental Protection Agency’s (EPA) fueleconomy.gov website. According to ‘Understanding the life cycle GHG emissions for different vehicle types and powertrain technologies’ by Ricardo from August 2018, the tank-to-wheel CO2 of a typical ICE is 65% of total lifecycle CO2 (taking the middle of the 60-70% range quoted), implying total CO2 over the life of the vehicle of 626 g/mile. Therefore, the EV emits approximately 57% less during usage and 43% less total CO2 than the ICE, based on typical emissions from electricity production.
In addition to this, the EV is undoubtedly superior to the ICE on tailpipe nitrogen oxides (NOx), carbon monoxide (CO) and particulate mass (PM) for an obvious reason. Even so, from Emissions Analytics’ testing the ICE would only emit 21 mg/mile of NOx, 2.5 g/mile of CO and typically about 0.5 g/mile of PM, well below the regulated limits.

If we then factor in non-tailpipe emissions, the picture begins to change. Of these, the large majority, perhaps up to 90%, comes from tyre wear abrasion, so we will focus on these. Brake wear should not be completely ignored due to the chemical composition of the particles, but the regenerative braking advantage of EVs will decline as hybridisation makes such braking widespread among ICEs. Previous Emissions Analytics’ newsletters on tyre wear (https://bit.ly/39UHbX4 and https://bit.ly/3c36urq) have shown that this can be a combination of coarse and ultrafine particles. According to ‘Wear and Tear of Tyres: A Stealthy Source of Microplastics in the Environment’ published in the International Journal of Environmental Research and Public Health in 2017, a large car (with a mass of around 3,300 lbs) will typically emit 26 mg/mile of PM. Further, this paper suggests that PM emissions increase proportionately with vehicle weight.
Therefore, we can deduce the total (tailpipe and non-tailpipe) PM emissions for both Porsches, as show in the table below. To this, for comparison, we have also added the Porsche Panamera 4 e-Hybrid and Tesla Model S. The basis of the calculations are described in the footnote.

It is clear that non-tailpipe PM emissions exceed those from the tailpipe, which is not surprising as tyre wear increases with the weight of the vehicle, other things being equal, and EVs are heavy. Meanwhile, tailpipe PM from ICE vehicles has fallen greatly, whether they have unfiltered gasoline or filtered diesel engines.
So, if a buyer switches from the Panamera ICE to the Taycan, the 43% reduction in CO2 emissions and zero tailpipe emissions is balanced by an 19% increase in PM emissions and a doubling in purchase price ($185,000 compared to $91,800). The hybrid occupies the intermediate position, delivering a 25% reduction in CO2 for the price of 17% higher PM and an extra $12,000 purchase price. The higher efficiency and slightly lower weight of the Tesla means that it delivers a reduction in CO2 of 60% for only a 14% rise in PM emissions and a 13% reduction in purchase price, although it concedes on maximum power and torque.
This analysis does not include the effect on particle number (PN). However, the report from the UK Government’s Air Quality Expert Group (AQEG) in July 2019 suggested that PN emissions could increase by up to 1.8% points for every 10 kg increase in the vehicle weight. That would imply that the Taycan would have 50% higher PN emissions than the Panamera ICE. If true, it would have a significant air quality impact because PN highlights the ultrafine particles that mass measurement misses, and it is ultrafines that may prove to be more problematic for human health.
The trade-off between lifecycle (LCA) CO2 and PM is shown in the chart below.

In summary, we can see a clear trade-off between climate-change-related and air pollutant emissions, and cost, which is reminiscent of the historical trade-offs between different ICEs. We also can see that there are material differences between different electrified vehicles. What this means is that discrimination between vehicles should be based on total real-world emissions and fuel economy, rather than asserting blanket technology preferences. The coming battle between EVs will be on the basis of energy efficiency, vehicle weight and tyre quality, which, in combination, will allow shifts towards Pareto superior combinations of CO2 and pollutant emissions. We accept that this is only a snapshot, but chosen to illustrate what we believe is a much wider pattern.
Emissions Analytics has been considering all these different elements to give a rounded view on environmental footprint. The first point to make is that the result differs materially between different models, so working at the level of generic groups can be hazardous. Second, many of the areas suffer from limited available data, either through scarcity or it being proprietary to manufacturers or suppliers. Specifically, we are conducting more testing to quantify both the PM and PN emissions – tailpipe and non – from a range of vehicles of different weights in real-world conditions.
If the first modern internal combustion engine spluttered into a smoky existence in 1876 (Nikolaus Otto), equally it is true that the first lithium ion batteries only made it to a commercially viable form in 1991, following intensive investment by Japan’s Sony corporation over ten years, under the leadership of 2019 Nobel Laureate Dr Akira Yoshino.
The rapid rise of electric vehicles, whether battery or hydrogen fuel cell, is indisputably the most important technology change occurring since the advent of the car over a century ago, and amounts to no less than its reinvention for the coming century.
Yet the revolution remains youthful and the technologies are comparatively new in any meaningful sense (we take account of pioneering EVs over one century ago – but they were not pursued as Ford got going and liquid fuels prevailed). Exxon developed fully scaled electric cars in the 1970s in response to the oil price shock, but they never took off. This is worth remembering in 2020.
The Exxon battery programme was led by M. Stanley Whittingham (also a 2019 Nobel Laureate), but the batteries proved unstable. However, what killed the programme off wasn’t just vehicle fires but the oil price, which fell after its calamitous rise earlier in the decade.
In light of the very recent oil price collapse, governments and car makers alike are about to be tested as never before for their commitment to electrification, a timely reminder that young and comparatively expensive technologies do not succeed in a bubble protected by virtue but have to fight for their existence against incumbent technologies that are proven and comparatively cheap.
Against that, the few moving parts of EVs and the existing experience of fleet operators point to exceptionally low maintenance costs and enhanced longevity.

What makes a great car is a question that has been blown wide open with competing technologies, but you can rest assured that Emissions Analytics is committed to technology neutrality, real-world testing of the many variables that define overall vehicle performance and dispassionate assessment for consumers and industry alike. The rapidly developing EV landscape is a source of intense interest to us and we welcome it. But, please, let us once and for all agree: there is no such thing as a zero emission vehicle.
*Footnote
The calculation of LCA CO2 emissions for the Panamera ICE and the Taycan are described in the main text. The value for the Panamera hybrid is approximated by calculating an average of the construction/battery phase of the Panamera ICE and the Taycan, weighted 85%/15% reflecting the relative battery size of the hybrid compared to the EV. In other words, the hybrid is considered a mixture of ICE and EV. To this, the EPA tailpipe CO2 value is added. The LCA CO2 of the Model S is calculated by adjusting the usage phase of the Taycan according to the greater efficiency of the Model S, with unchanged construction/battery phase. The calculation of the non-tailpipe PM is also covered in the main text. The values for the four vehicles are calculated as linear and proportionate extrapolations from the benchmark 3,300 lb large car with 26 mg/mile tyre wear emissions.
Plug-In Hybrids Without Behavioural Compliance Risk Failure
Tensions between official EU emissions policy and member states.
Tensions between official EU emissions policy and member states.
When the Worldwide Harmonised Light Vehicle Test Procedure (WLTP) commenced in September 2017, it replaced the New European Driving Cycle (NEDC) with a more realistic, ‘real-world’ approach to emissions testing. Following this switch, several models of plug-in hybrid car (PHEV) were withdrawn from sale in Europe as their emissions ‘rose’ sharply under the new test, disallowing them from various subsidies and benefits. Yet interestingly a wide range of new PHEVs are now being launched, two years later.
The new crop of PHEVs are likely to have been optimised to the WLTP emissions test, and come with larger batteries in the range of 10-30kWh instead of previously 3-6kWh. This ensures that they achieve super-credit status, or sub-50g CO2/km emissions ratings, which initially allows them to be counted twice in the fleet average CO2 calculation. This is vital for manufacturers who have to meet impending fleet average emissions targets of 95g/km from 2020 or face large fines in Europe.

This strong incentive from the EU level directly clashes with some member state policies: national governments that have cancelled generous subsidies for all PHEVs. This group of policy makers are suspicious of PHEVs.
The Dutch government, followed by the British, in late 2018, withdrew previously generous PHEV subsidies. They cited evidence suggesting that many owners, attracted by a subsidy, rarely plugged in their PHEVs.
So what is going on and who is right? If a PHEV is not plugged in, it typically drives around on a smaller than optimal internal combustion engine and achieves poor real-world results.
Of all PHEVs tested by Emissions Analytics, which includes petrol and diesel versions, the average performance in this condition is 37.2 mpg (7.6 l/100km) and CO2 emissions of 193.3g/km, which is 62.5% worse than the official NEDC results.
By no stretch of the imagination are these compelling figures if, as EU policy makers would claim, the purpose is to reduce real greenhouse gases as quickly as possible.
That is not to say that PHEVs have no claim to virtue. Their primary strength is offering electrification without range anxiety, since an internal combustion engine remains present, whether as a part of the drivetrain or as a ‘range-extending’ battery generator.
However, one of the challenges for PHEVs is that by the nature of the technology, their performance cannot be properly encapsulated and articulated by the standard, cycle-based rating. Rather, the real-world performance of PHEVs rests to an unusually large degree on user behaviour and journey length, rather than instantaneous combustion performance.
Research studies have shown that some duty cycles – for example commuting to and from work every day but charging overnight and avoiding long distances – can result in virtually no use of the ICE. The consumer has in this case had an EV ‘on the cheap’, without the weight and cost of a large battery pack. This is a PHEV at its best.1
At the other end of the spectrum, a PHEV might be deployed on long journeys and never plugged in. This results in a significant disbenefit, the vehicle typically offering worse fuel consumption and emissions than a conventional ICE-only drivetrain. This is a PHEV at its worst.
While we can recognise that many current or potential PHEV owners understand that the electric driving share of a PHEV, expressed as its utility factor (UF), is the key to its fuel economy rating and emissions, nonetheless the Dutch data, based on fuel card usage, included a significant business user fleet where there was evidently no fiscal incentive to save fuel. These owners were hardly plugging in.2
In the study referenced in footnote 1, based on 1831 Chevrolet Volts in the US, the authors found generally excellent utility factors, the average being 78%. In the Dutch data, which included smaller-battery PHEVs and owners who typically didn’t bother to plug in, the average utility factor was 24%.
If we take this spread, 24-78%, as the real range of utility factor, and return to the Emissions Analytics average PHEV performance of 193g/km CO2, it can be re-expressed as spanning 151g/km CO2 (24% UF), to 46g/km CO2 (78% UF).
The effect of the WLTP has been to force model overhauls, leading to larger internal combustion engines, and larger batteries to achieve longer electric range.
This is precisely what happened with the Mitsubishi Outlander PHEV, at different times and places the leading PHEV in Europe. To achieve a sub-50g/km result under WLTP the manufacturer fitted a 2.4 litre petrol engine, replacing a 2.0 litre unit, and increased battery size from 12kWh to 13.8kWh. EV range fell from 33 miles under the NEDC to 28 miles under the WLTP, but crucially it allowed the SUV to retain a sub-50g rating (46g/km) as a category 2 Ultra Low Emission Vehicle.
The warning to policy makers is that current and future PHEVs offer most of the same strengths and weaknesses of previous models, and that car makers are optimising their products to achieve the sub-50g result under WLTP but without guaranteeing any actual reduction in emissions.
In a very recent instance one OEM, Peugeot, boasted of an SUV featuring 4WD and 300hp yet 29g/km CO2, premised on an electric range of 36 miles and a 13.2kWh battery. The 3008 SUV GT Hybrid4 qualifies in the UK for the lowest Benefit in Kind (BIK) tax rating of 10%, re-attracting a subsidy.
In another 2019 product launch, the Volvo XC40 T5 Twin Engine claims 262hp and a preliminary WLTP rating of 38g/km. In this instance some but not all variants of this model offer a ‘hybrid’ setting that tries to optimise overall efficiency, except that whether it is deployed or not sits with the owner. Such an innovation is likely to confuse regulators and consumers alike, even if it may also work well in practice.

Our position is that on reasonable assumptions PHEVs will deliver less and less certain reductions in CO2 than non-plug-in hybrids. In other words, that they are ineffective without behavioural compliance, and that such compliance is politically infeasible in most democracies where it would be considered an intrusion on privacy.
The case for future PHEVs may lie principally in the light to medium commercial fleet, where the advent of zero-emission city centres may force dual-drivetrain approaches, the pure electric drive share being saved for last mile delivery and the ICE (diesel as well as petrol) permitting long highway distances, refrigeration units and so forth.
Geo-fencing is also strongly foreshadowed in current fleet management, from public bus fleets to Uber’s app, and suggests a straightforward way to ‘enforce’ the correct use of a PHEV, thus compelling fleet operators to plug them in.
This would go a long way to addressing the ongoing weakness of the PHEV, its drivetrain sleight-of-hand that courts generous tax-payer subsidy but delivers poor real-world performance.
In the realm of private passenger cars, however, we have shown in a previous newsletter how by comparison non-plug-in, full hybrids offer much faster and more certain emissions reductions of up to 30%. Given the importance of reducing CO2 emissions agressively and quickly, the lower risk option may be preferable.
1 Patrick Plotz, Simon Arpad Funke, Patrick Jochem. ‘The impact of daily and annual driving on fuel economy and CO2 emissions of plug-in hybrid electric vehicles’ in Transportation Research Part A, 118 (2018) 331-340.
2 Ligterink, N.E., Eijk, A.R.A, 2014. ‘Update Analysis of real-world fuel consumption of business passenger cars based on Travelcard Nederland fuelpass data’, TNO Report TNO 2014 R11063.

Hybrids are 14 times better than battery electric vehicles at reducing real-world carbon dioxide emissions
Why a multi-pronged approach to electrification is needed
Battery production capacity for motor vehicles is currently scarce, expensive and suffering supply lags and challenges.
Why a multi-pronged approach to electrification is needed
Battery production capacity for motor vehicles is currently scarce, expensive and suffering supply lags and challenges. This may change over time, but for some period securing an economic supply of battery production capacity will be pivotal to the successful commercialisation of electrified vehicles, and to the relative fortunes of individual auto makers. At the same time, electrification is a proven route to tailpipe carbon dioxide (CO2) reduction, or elimination. Therefore, the efficient deployment of available battery capacity between competing applications is critical to maximising fleet CO2 reduction.

So long as this scarcity remains, a major concern is that the push to pure battery electric vehicles (BEVs) will crowd out a more effective programme of mass hybridisation. Put another way, given the urgency of the need to reduce CO2, paradoxically BEVs may not be the best way to achieve it with their supply chain, production capacity, infrastructure and customer acceptance challenges. The assertion that BEVs are required to solve air quality problems is confusing the argument – cities in Europe can be brought into compliance with conventional internal combustion engines, with technology on the market today. Electrification is first and foremost a CO2 reduction technology, but what strategy mix represents the correct path?
This newsletter is inspired by recent insightful articles by Kevin Brown: https://bit.ly/30j50Ed and https://bit.ly/30oC1yM. His insights on the efficiency of carbon reduction can be put together with the Emissions Analytics’ database of real-world testing over almost 100 hybrids vehicles to see in more detail the most efficient options for electrification and CO2 reduction.
As with tailpipe pollutant reduction, CO2 reduction comes down to how to achieve it as cost-efficiently and quickly as possible. Emissions fell during the financial crisis, but at the significant price of sharply reduced economic activity – not desirable. So, how best to deliver road transportation’s part in meeting the Paris climate change targets? The apparent consensus is to transition to pure electric vehicles as rapidly as possible. But is this singular focus better than a combined strategy employing a wide variety of hybrid electric vehicles?
The problem with the pure electric vehicle approach is that the transition will be slow, BEVs need disproportionately large batteries to give acceptable consumer utility, just as battery capacity is currently a scarce resource. As cumulative CO2 emissions are important for climate change – due to the long life of the gas in the atmosphere – a smaller reduction per vehicle now, but across many more hybrid vehicles, would eliminate a far greater volume of CO2 than applying the scarce battery resource to a smaller number of BEVs. This approach also helps mitigate naturally slow fleet turnover, with the average age of cars on the road being over twelve years.
So, what does the real-world performance data of hybrids look like?
The following analysis takes the mild, full and plug-in hybrid vehicles tested by Emissions Analytics in both Europe and the United States. Each hybrid is paired with its nearest equivalent internal-combustion-engine-only vehicle, often the same make and model with a similar engine size. The difference in average CO2 emissions over Emissions Analytics’ standard on-road cycle between the hybrid and its conventional-engined pair is then calculated.
The first table focuses on mild and full hybrids, excluding plug-ins, and shows the average tailpipe CO2 reductions that are achievable with models that are currently on the market, or that have been sold over the last seven years since Emissions Analytics started its test programme.
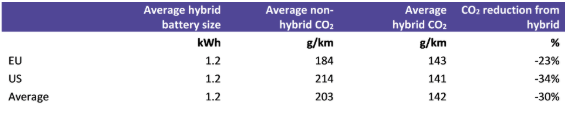
The average US reduction is larger than in Europe due to the typically higher CO2 emissions starting point of US vehicles, and often the latest hybrid technology is launched in the US market earlier. Of these 95 hybrids, five are diesels.
To put this 30% reduction in context, the EU’s post-2021 CO2 reduction target for passenger cars is 37.5% by 2030. Therefore, widespread non-plug-in hybridisation with currently available technology would achieve over three-quarters of that target. Moreover, with fourth generation hybrids now entering the market, the benefits of hybrids will improve further, as illustrated at https://bit.ly/2KhDlhh. Together with plug-in hybridisation and other design innovations, it is plausible that the target could be met without the need for full electric vehicles.
The results from the first table are then combined with results from plug-in hybrids and a representative BEV, with the difference in CO2 being divided by the battery size of the electrified vehicle. The result measures the efficiency of CO2 reduction in return for the deployment of the scarce battery resource. The results are shown below, with three different illustrative scenarios for plug-ins depending on varying battery utilisation.

* Typical battery size across models currently on the market. The CO2 reduction from BEVs is based on switching from an average internal combustion engine emissions to a zero-emissions BEV.
The table above shows that mild hybrids are clearly the most efficient method of CO2 reduction, followed by full hybrids, given scarce battery production capacity. Plug-in hybrids are the next most effective after that, but only if they are operated entirely on battery, which is hard to enforce in practice. BEVs have the lowest efficiency, primarily due to requiring disproportionately large batteries to accommodate relatively infrequent, extreme usage cases where the driver will otherwise suffer range anxiety.
This analysis ignores the upstream CO2 in fuel extraction, refining and transportation, as well as in the production and distribution of electricity. Some studies suggest the upstream CO2 of the electricity is greater than for gasoline, but the relative efficiency calculations here implicitly assume they are equal.
Showing the distribution of performance by individual model, the chart below relates the efficiency of CO2 reduction by battery size. Mild and full hybrids are the most efficient on average, but there is significant variation within the class – demonstrating that individual vehicle selection remains at least as important as generic powertrain. The same chart also demonstrates the advantage in CO2 reduction that the US currently holds.

In terms of the trajectory to total CO2 reduction, a transition from gasoline internal combustion engine to full gasoline hybrid can reduce emissions by 34%. As it will take time to increase the supply of full hybrids, there are two routes to short-term CO2 reduction that are viable more quickly. First, a switch from gasoline to diesel internal combustion engine in practice reduces CO2 emissions by 11% at the tailpipe. A second step then to a diesel mild hybrid delivers a further 6% reduction. The final swap to full hybrid delivers another 16%, making 34% in total. Alternatively, a direct switch from gasoline to gasoline mild hybrid can deliver 11%, followed by a further 23% in moving to full hybrid. Therefore, there are immediate-term options for significant CO2 reduction, involving both gasoline and diesel powertrains – the former more suitable in the European market, the latter in the US due to the current mix of fuel utilisation.
It is at any regulatory stages beyond the 37.5% fleet reduction that fuller electrification would be required, as there are limits to the total CO2 reduction that hybrids can deliver. However, by 2030 the EU and US would have had more time to develop expanded, cleaner electricity generation capacity, enhanced distribution grid, and addressed the supply chain issues around the scarce materials in batteries. Not neglecting also that consumer education and acceptance are required to remove barriers to adoption. An alternative scenario by 2030 is that the availability and price of renewable electricity may have fallen to a level at which hydrogen fuel cell vehicles become economic viable, which avoid some of the environmental and geopolitical issues created by largescale battery production.
In summary, this data strongly suggests that policy unilaterally favouring one technology solution may be deeply inefficient and perhaps even the wrong eventual solution. A better approach would be to use real-world data to allow competing technologies to flourish as they can evidence genuine CO2 reductions, delivered as soon as possible.
Electric vehicles now rated by EQUA Index – Tesla 3 result.
Electric vehicles have no tailpipe emissions – obviously. They do have indirect emissions from upstream manufacturing, and in-use emissions from tyre and brake wear, but it is range and efficiency which are of direct practical importance to owners.

Electric vehicles have no tailpipe emissions – obviously. They do have indirect emissions from upstream manufacturing, and in-use emissions from tyre and brake wear, but it is range and efficiency which are of direct practical importance to owners.
As range anxiety diminishes with larger batteries, the relative efficiency of EVs will become more important in choosing the best vehicle. More challenging, for car buyers, is weighing the advantages and disadvantages of EVs against traditional powertrains, as they decide whether to switch. As a result, Emissions Analytics has extended its EQUA Index programme to test these new powertrains in a comparable way, with our partners Motor Trend (www.motortrend.com/real-mpg).
Recently, we put the Tesla 3 through the standard EQUA Real Mpg fuel economy test in the California, which is the same test we put internal combustion engine vehicles and hybrids through. The Tesla performed well, achieving efficiency of 3.1 miles per kWh. While there is no ideal way to convert this to a miles-per-gallon equivalent, if the kWh are converted to gallons based on relative energy content, this makes 103.7 (US) mpg, 124.5 (Imperial) mpg or 2.27 litres per 100 km.
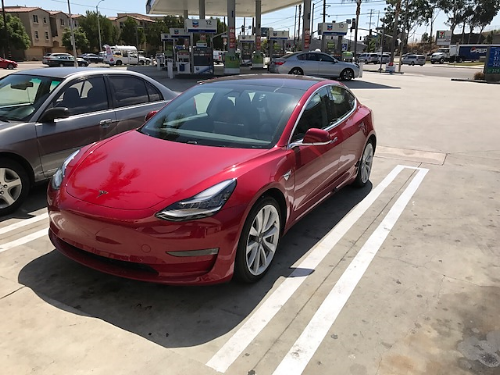
This was a good performance, but not best-in-class. The 2017 Chevrolet Bolt we tested achieved 122.2 US mpg and the 2017 Hyundai Ioniq EV reached an impressive 151.8 mpg.
This is significant because it shows that the electric vehicle market is not just dominated by one player, but there are now a number of rival vehicles, with varying performance – information the consumer should have when making a purchase decision. Emissions Analytics’ EQUA Real Mpg data for the US market can be found at usa.equaindex.com, and the equivalent European data at www.equaindex.com.
At the same time as these developments, behind the scenes, Emissions Analytics has initiated a process to formalise its methods and evolve it to be relevant for testing the latest vehicles, including European diesels under Real Driving Emissions and EVs. In November, the inaugural workshop of this "CEN" process was held in Brussels. CEN, or Comité Européen de Normalisation, is a framework for standardisation of products and techniques across the European Union. After a period of open scrutiny and discussion, the testing methodology could become an official voluntary standard, for any organisation to use.
Emissions Analytics is undertaking this as part of its commitment to the recently-launched not-for-profit global alliance called “Allow Independent Road-testing” or AIR (www.allowair.org). As part of this, we want to open up our methodology to third parties to conduct consistent tests, in order to grow the global database of comparable results.

AIR is a separate entity from Emissions Analytics and structured as an alliance allowing like-minded organisations to sign up to the principles of independent testing and labelling. Any organisation interested in finding out more about the objectives and opportunities for membership, should contact Massimo Fedeli at mdefeli@allowair.org.
The link between these two recent events is that the ever-growing complexity of car choices needs an accurate, fair, trustworthy standard for measuring efficiency and emissions. Consumer trust must be rebuilt and cities need good tools to meet the air quality goals.

Can hybrid electric vehicles beat diesels on mpg?
Hybrids have always had a miles-per-gallon advantage in urban driving but new EQUA Index data shows that they are gaining on diesels in motoway or highway driving and, if current trends persist, hybrid electric vehicles (excluding plug-in hybrid electric vehicles) are set to take the lead in 2017.
Hybrids have always had a miles-per-gallon advantage in urban driving but new EQUA Index data shows that they are gaining on diesels in motoway or highway driving and, if current trends persist, hybrid electric vehicles (excluding plug-in hybrid electric vehicles) are set to take the lead in 2017.

The dotted trend lines in the above graph, representing motorway mpg for diesel vehicles and gasoline hybrids tested by Emissions Analytics, are converging. While the downturn in diesel mpg may be due to a change in manufacturers’ focus from fuel economy to NOx emissions, what is more striking is the improvement in gasoline hybrid performance on the motorway as a result of technological advances.
The step change in technology is even more noticeable when European EQUA data is compared to North American EQUA results. The graph below shows gasoline hybrid performance in the US is particularly impressive on our combined cycles. With this level of fuel economy it seems unlikely that diesel vehicles will ever make a significant impact on market share in the US. With the mpg penalty of some NOx aftertreatment systems, perhaps it was to gain a fuel advantage over hybrids that Volkswagen resorted to using a defeat device when bringing their diesel models to the US market.

Another noticeable effect of the different product mix in the US is the level of carbon monoxide emissions. Both regular gasoline cars and gasoline hybrids have much lower CO emissions than their European equivalents, with regular gasolines 30% lower and gasoline hybrids 64% lower. This is despite the fact that the US have a less strict limit, at 2.1g/km, than the EU’s, 1.0g/km limit.
When we last wrote about hybrid vehicles back in October 2014, we concluded they were delivering “good but not best-in-class fuel economy, but [were] typically the cleanest, and if you are a light-footed, congested town driver, they are ideal.” Two years on hybrids, particularly in the US, have really upped their game. They are still a cleaner drive than a diesel and may soon offer better fuel economy wherever you drive them but heavy-footed drivers should still exercise caution.

Round up of average fuel economy for 2015
Round up of average fuel economy for 2015 - Infographic


Motor Trend: The world’s two most efficient internal combustion cars
Real-world testing of hybrids in California read more

Hybrid efficiency put to the test
Despite common perception, the advantage of hybrids over frugal diesels is often illusory, if judged solely on fuel economy. Having tested over 30 hybrids in the UK and US, Emissions Analytics is able to analyse the data to understand how they really perform.
Despite common perception, the advantage of hybrids over frugal diesels is often illusory, if judged solely on fuel economy. Having tested over 30 hybrids in the UK and US, Emissions Analytics is able to analyse the data to understand how they really perform.
To illustrate the point we have taken a sample of 10 vehicles tested since 2013 – two standard hybrids versus 8 diesels – from the real-world fuel economy testing we conduct with What Car? in the UK. Each has an engines in the 1.5 to 2.2 litre range, power up to 150bhp, two-wheel drive and with hatchback, saloon or estate body style. The table shows the sample, ranked by fuel economy with the best MPG at the top:
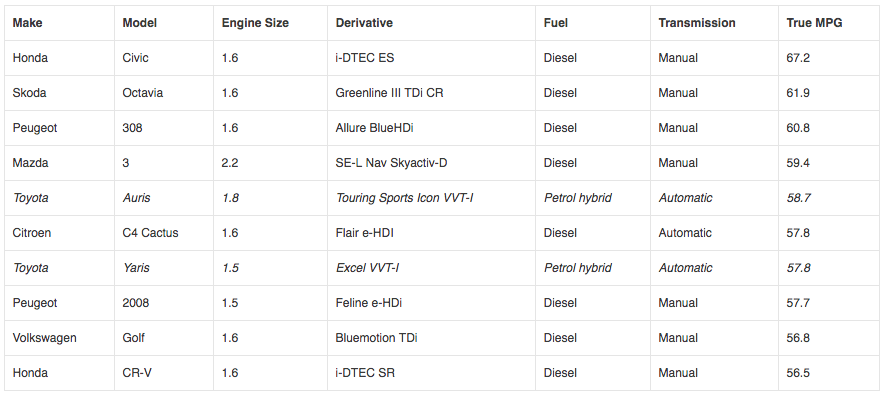
While hybrids deliver good fuel economy in real driving, they can be eclipsed by up to 10mpg by some non-hybrid diesels. And that is after having taken into account any net changes in battery charge levels, to ensure that the hybrids are not penalised over our cycle. For certain driving patterns however, hybrids may still be the better option. Over our complete dataset of more than 500 vehicles in the UK, we can quantify how average MPG changes under congestion and aggressive and fast driving.

What this data shows is that hybrids suffer much less than their ICE equivalents under congested urban driving: on average a 3% penalty compared to 7%. In contrast, by doubling the average rate of acceleration the MPG falls by more for hybrids, especially diesel hybrids.
Comparing motorway driving to town driving, all types of vehicle show better MPG on the former, but the difference between hybrids and ICE vehicles is dramatic – typically because the downsized engines found in the hybrids are less suited for high speed motorway cruising.
Even more than their tolerance of congestion, the value of hybrids may be in their pollutant emissions, as even the cleanest diesels typically exceed the regulated values of NOx. In a recent report by the International Council on Clean Transportation, which analysed data from Emissions Analytics, the average exceedance was seven times for the latest Euro 6 diesel cars.
This compares to petrols, which generally meet the regulated NOx standards, even in real-world driving. Carbon monoxide is higher for the petrols, but again within the regulated values. Therefore, petrol hybrids have the benefit over ICE diesels in their effect on air quality, made even better as a proportion of urban driving will be on battery, with zero emissions. Although not included here, plug-in hybrids can show this pattern even more strongly.
In summary, hybrids deliver good but not best-in-class fuel economy, but they are typically the cleanest, and if you are a light-footed, congested town driver, they are ideal.
Archive
- AIR Alliance 3
- Air Quality 38
- Audio 3
- Climate Change 14
- EQUA Index 21
- Electrified Vehicles 28
- Euro 7 3
- Fuel Consumption/Economy 20
- Fuels 4
- Infographic 18
- Media 4
- NRMM/Off-road 3
- Newsletter 103
- Podcast 7
- Presentation/Webinar 18
- Press Release 19
- Regulation 16
- Reports 4
- Tailpipe Emissions 49
- Tyre Consortium 2
- Tyre Emissions 26
- Vehicle Interior 6