

Euro 8: Rethinking Vehicle Emissions Fundamentally
Just as European regulators are consumed by finalising the touted 'Euro 7' regulation, it is perhaps the right time to consider the longer-term trajectory for vehicle regulation. There is a tension in the narrative around Euro 7.
Just as European regulators are consumed by finalising the touted 'Euro 7' regulation, it is perhaps the right time to consider the longer-term trajectory for vehicle regulation. There is a tension in the narrative around Euro 7. At points it has been talked about as the “final” set of emissions regulations, but now the message is being put out that the intention is not to “kill” the internal combustion engine (ICE). Unless foreshadowing the end of the ICE, it would be bold and presumptuous to call Euro 7 the final regulation.
In reality, Euro 7 is unlikely to be the final regulation, not because of the end of ICEs, but because vehicles of all types, including battery electric vehicles (BEVs) emit lots of substances from sources other than the exhaust. This newsletter set out those additional sources, and what shape a subsequent Euro 8 regulation might conceptually take. This is consistent with Emissions Analytics’ mission to establish the true, real-world environmental impact of vehicles. BEVs, it should be kept in mind, exist only for their greenhouse gas reduction potential, not for meeting air quality laws, as the regulated pollutant emissions out of the current generation of ICEs are low.

Why are BEVs not required to meet air quality laws in Europe? Since the introduction of the Real Driving Emissions (RDE) on-road validation of certification values introduced mid-way through Euro 6,gaseous tailpipe pollutant levels are now confirmed as low in average driving. For some, they were low even before RDE. The average nitrogen oxide (NOx) emissions from RDE diesel vehicles are 45mg/km and falling, compared to the regulatory limit of 80mg/km. Mean carbon monoxide from RDE gasoline vehicles is 157mg/km compared to the limit of 500mg/km. Total hydrocarbons (THC) from RDE gasoline vehicles are now typically below 10mg/km compared to the limit of 100mg/km. Particle mass emissions are now very close to zero on current diesel and direct injection gasoline vehicles, with a limit of 4.5mg/km on the PMP procedure.
Of the regulated pollutants, therefore, all seem well controlled, except for ultrafine particle emissions – measured through the particle number (PN) standard – and potentially particles more generally from port fuel injection gasoline cars. The widening of the size range of particles measured, down to 10nm, likely to be proposed in Euro 7, will offer a valuable tightening of this part of the regulatory regime.
For the Euro regulations themselves, greenhouse gases are not regulated – except indirectly for methane (CH4) through THC – as the fleet average carbon dioxide (CO²) targets act separately. Whether promoting BEVs is the optimal way to achieve these targets was the subject of a previous newsletter: www.emissionsanalytics.com/news/hybrids-are-better. Relevant here is the potential addition of methane and nitrous oxide (N2O) under Euro 7, even though they are primarily greenhouse gases rather than air quality pollutants. They are both more potent greenhouse gases than CO², although survive for a shorter time in the atmosphere: 28 and 265 times higher potency respectively on a hundred-year time horizon1. Therefore, only small amounts of N2O emissions could nullify much of the hard-won CO² reduction.
So, on the surface of it, Euro 7 could be the last regulation for pollutant emissions, while greenhouse gases are actively addressed through the CO² targets. What may be neglected, however, is volatile organic compounds (VOCs) from the exhaust. These compounds are numerous, small in volume but potentially highly toxic in their human health effects. Therefore, their current regulation in the laboratory as non-methane hydrocarbons (NMHC) may be insufficient: not only that the limit is high at 68mg/km, but also that it does not apply to diesel vehicles. Furthermore, by only considering the total, there is no visibility on whether that total is made up of toxic or innocuous compounds.
The University of York in the UK has been at the forefront of studying this area, highlighting particularly the role of these compounds in the atmospheric chemistry that leads to ground-level ozone and secondary organic aerosol particle formation². Therefore, these compounds do not just have direct effects on human health, but indirectly lead to poor air quality. While oxidation catalysts in the exhaust of gasoline vehicles may be highly effective in converting VOCs, their effectiveness against the heavier, semi-volatile organic compounds (SVOCs) such as the carcinogenic polycyclic aromatic hydrocarbons (PAHs) is less clear. Generally, also, these ICE vehicles suffer from relatively high VOC and SVOC emissions when the engine is cold.
From this, we can conclude that Euro 7 perhaps should not be the final regulatory stage, so long as ICEs are still sold, which is likely to be through to at least 2035 in Europe. While Euro 7 is looking at regulating a small number of highly volatile compounds such as formaldehyde, the broader spectrum of organic compounds is not currently being actively considered. This is important when you put it in the broader picture of the environmental impact of vehicles. Specifically, there are instructive parallels with the emissions from tyres and from materials inside the vehicle cabin – both of which are very lightly regulated currently. Tyres will be a topic of a later newsletter, so here we will focus on the vehicle interior.
In our last newsletter (From performance to experience), we reviewed the evidence for concentrations of particles and CO² in the cabin during on-road driving. It concluded that the quality of air inside the cabin is highly dependent on the quality of the ventilation system and its filter. For some vehicles, in-cabin particle concentrations were many times higher than outside on average, and the use of the recirculation mode led to steep rises in CO² concentrations to the point of potentially having cognitive effects on the driver.
But that is not everything. The single biggest complaint from new car buyers in China is about the ‘new car smell’, which is caused by a mix of VOCs. These VOCs may have health effects that go well beyond simply causing malodours. The source of the new car smell is VOCs being released from interior materials and glues used to put the vehicle together. Sources of VOCs go beyond that too, including those that enter the cabin from outside (which in turn come from other vehicles, home heating, industrial sources and so on), fuel evaporating from the tank and emissions from the body and clothing of human occupants. What is important is to be able to differentiate the toxic from the harmless VOCs – the toxic ones being more likely to come from combustion of fossil fuels or materials derived from fossil fuels, such as plastics and adhesives.
To study this, Emissions Analytics has recently opened a testing laboratory with two-dimensional gas chromatography and time-of-flight mass spectrometry from Markes International and Sepsolve. This allows us to test for tailpipe and in-cabin VOCs with excellent separation, identification and quantification. Taking one of the early car tests, a sample of air was taken and 617 different compounds were identified, with 25 being particularly being abundant. These compounds can be illustrated on a two-dimensional chromatogram, as shown below. The horizontal dimensions are the two axes of separation and each peak represents one compound, with the area under the peak broadly reflecting the amount present.

Looking in more detail at the most abundant compounds, it is possible to relate each to the risks to human health, as shown in the table below, with a colour classification reflecting the toxicity.

In addition to these, formaldehyde was identified through a separate process using high-performance liquid chromatography. Formaldehyde is another respiratory irritant and a contributory factor in asthma and some cancers.
The vehicle was a recent model year mid-range European gasoline passenger car. These effects are a combination of irritants that would lead to various degrees of discomfort while in the vehicle. A longer time spent in the car would correlate with a greater health or comfort effect. The 617 compounds identified can be put into the following generic groups, corresponding to the coloured areas on the chromatogram for ease of interpretation (with the axes being the two dimensions of separation and the colour corresponding to the intensity of the peak). These groupings give an area percentage which can be used for the characterisation of compounds. This is a simple interpretation, while more detailed analysis can quantify the amount of each compound.

Therefore, this vehicle contained a large number of compounds that are respiratory irritants and cause organ damage, together with a material number of carcinogens.
China is planning to regulate eight targeted compounds in the vehicle interior, although the timetable for implementation has slipped. Emissions Analytics identified six of the eight target compounds in its test, particularly formaldehyde and toluene. Moderate concentrations of benzene and ethylbenzene were present, with lower amounts of acetaldehyde and styrene. Japan, Korea and Russia also regulate similarly limited repertoires of these VOCs.
The main control in Europe for these VOCs is through the ‘REACH’³ restrictions on substances that can be use in product manufacturing. Currently only eight PAH compounds are restricted – according to their concentration in the final product – primarily as carcinogens: benzo(a)pyrene, benzo(e)pyrene, benzo(a)anthracene, chrysene, benzo(b)fluoranthene, benzo(j)fluoranthene, benzo(k)fluoranthene and dibenzo(a,h)anthracene. These restrictions apply to products including tyres and plastic components than come in contact with the human skin, including some parts of the vehicle interior.

The most progressive approach to measuring vehicle interior VOCs, focusing on materials, is the Vehicle Interior Air Quality group at the UNECE. In 2020, it finalised a revision to Mutual Resolution 3 that standardises measurement of these compounds and offers a platform for future regulation by national governments. Substances tested under this protocol are VOCs ranging in volatility from n-C⁶ to n-C¹⁶ together with carbonyl compounds formaldehyde, acetaldehyde and acrolein.
In summary, both the tailpipe and vehicle cabin are likely to contain a wide range of volatile and semi-volatile organic compounds, some of which can have high toxic effects on humans, as well as other effects on animals, aquatic life and biodiversity. This is an important and urgent topic for future study, especially at a time when the levels of traditionally regulated tailpipe pollutants are getting so low. In short, the focus should be on particles, VOCs and greenhouse gases, whether they come from the tailpipe, cabin materials or tyres

Unless this wider view of vehicle emissions is taken, and the structure of the Euro regulations fundamentally reframed, they could hold as much currency as a 7 Euro coin.
Footnotes:
- https://www.ghgprotocol.org/sites/default/files/ghgp/Global-Warming-Potential-Values%20%28Feb%2016%202016%29_1.pdfof-air-pollutants/emissions-of-air-pollutants-in-the-uk-particulate-matter-pm10-and-pm25,
PM2.5
- http://www.envchemgroup.com/jacqui-hamilton.html
- https://echa.europa.eu/regulations/reach/legislation

From performance to experience
Could vehicle interior air quality become the differentiator of the future?
Cars used to be about speed, power, performance and freedom. Different models often used to offer dramatically different performance and looks.
Could vehicle interior air quality become the differentiator of the future?
Cars used to be about speed, power, performance and freedom. Different models often used to offer dramatically different performance and looks. But, not so any more. We are currently in an era of the generic sports utility vehicle (SUV) and identikit low emission vehicles. Electric vehicles “all look alike”, as suggested by the head of BMW recently¹.
But can this last? Will consumers want to buy such seemingly bland offerings, and can manufacturers profit from the undifferentiated? Perhaps we are already beginning to see early signs of a shift. Electrification may turn out to be less about emissions reduction, but rather emblematic of the change in the fundamental proposition of the car away from performance and towards experience. Performance is increasingly constrained through traffic and emissions policy, so consumers may want to make the increasingly dull experience of driving at least more comfortable.
Historically, operating a car delivered ample private benefit and enjoyment, at the expense of an alarming array of environment and health impacts: climate effects through carbon dioxide (CO²) emissions; air quality from tailpipe nitrogen oxides (NOx), particulates and carbon monoxide (CO); air and marine pollution from tyre and brake wear; ozone formation from evaporation of volatile organic compounds (VOCs) from fuel in the tank and construction materials; and noise and many others.
Battery electric vehicles (BEVs) are perceived to be the antidote to this: quiet and pollution free. This is of course not quite true: BEVs create CO² emissions in their manufacture, some noise and perhaps higher tyre wear emissions. Nevertheless, we could get to the point where the environment affects the BEV driver more than the BEV affects the environment.
How could this be true? Road transport collectively is only a minority contributor to air quality problems in 2019 – perhaps only 12% of particles² and 33% for NOx³. The majority of pollution comes from domestic heating, industrial sources and agriculture. This polluted air can enter the vehicle cabin through its ventilation system, exposing the driver to the resulting health risks and discomfort. Therefore, it may well become increasingly the case that the car driver is more a victim of pollution than the cause.

Even without BEVs, there are already some aspects of the internal combustion engine (ICE) which foreshadow this trend. First, due to the efficacy of exhaust after-treatment systems, the levels of CO and NOx are so low in real-world operation that the impact on the environment is negligible. For example, under the latest European Real Driving Emissions (RDE) regulation, the average real-world emissions are 157mg/km from gasoline vehicles and 36mg/km from diesels for CO; and 9mg/km from gasolines and 45mg/km from diesels for NOx. Second, as demonstrated previously by Emissions Analytics, diesel particulate filters (DPFs) are so efficient that there are often fewer particles coming out of the tailpipe than there are in the air of a polluted city such as London⁴.
With this background, consider the scenario where the powertrain element ceases to be a major differentiator between mainstream BEVs. Power may be limited to maximise range, torque could be capped to reduce tyre wear emissions, and tyres may become skinnier to reduce rolling resistance but at the cost of handling. As and when connected and autonomous vehicles hit the road, this pattern may become even more pronounced. Furthermore, the cost of electricity – as low as three cents per kilometre – could mean the operating costs become almost irrelevant. Mainstream cars cease to have a performance dimension. Add to this the relatively few standardised manufacturing platforms and you have vehicles of increasingly similar performance. In this world, how will manufacturers differentiate their products and make decent profits?
Design undoubtedly will remain a key element, both for aesthetics, build quality and cost. Beyond that, with the background of historical air pollution problems and now Covid-19, it may well become the vehicle interior air quality that becomes a major differentiator. What once were major sources of pollution, could now become protective automotive bubbles.
Tesla’s launch of its ‘Bioweapon Defense Mode’ in 2016 was perhaps early evidence of this trend. The data presented by the company for its efficacy involved exposing a vehicle to high levels of particle pollution in an emissions chamber and showed that concentrations of particles by mass⁵ in the vehicle cabin fell from 1,000ug/m3 to undetectably low levels within two minutes, from which they concluded it could protect the vehicle occupant from biological attack⁶.
Grand claims need verifying, especially as to whether laboratory test results carry over into real-world conditions, so Emissions Analytics tested this model on a 2019 Tesla X in the UK. The test followed the protocol set out in an SAE paper published in 2019⁷.
The Tesla X is now equipped with a High-Efficiency Particulate Air (HEPA) filter as standard. In simple terms, the ventilation system has the typical ‘fresh air’ and ‘recirculation’ modes, but also the bioweapon mode too. This HEPA filter is enormous, as shown in the picture below – the installation requiring most of the width of the ‘frunk’. It is approximately 100cm long, 30cm tall and 3cm deep – a volume of over 9,000cm³. This compares to filter volumes on typical mass market cars of 1,000-2,000cm³.

The filter may be large, but it certainly works. In our test, interior concentrations were 94% lower than externally on fresh air mode, and 92% lower on the bioweapon mode during an on-road test – statistically indistinguishable from one another. This is the best performing vehicle we have tested so far. The principal difference between Tesla’s test and ours was that we measured ultrafine particles down to 15nm rather than particle mass. Together, the data suggests excellent protection from both bigger and smaller particles.
To put these results in context, Emissions Analytics tested 97 recent model year light-duty vehicles in the US in partnership with Edmunds⁸. Of all these, the best performing was a 2019 Honda Civic, which reduced particle concentration by 73%. Emphasising the significant differences, the worst performing vehicle was a 2019 Lexus ES, for which particles inside the vehicle were 254% higher than outside. Of the 97 vehicles, 44 had higher concentrations inside than out. This is an unregulated area at the moment, so there is no compliance issue, but there certainly is a potential health issue from chronic particle exposure.
A common driver strategy for protection from exterior pollution – often initiated when the driver senses a malodour – is to engage the recirculation mode on the ventilation system, which wholly or largely circulates, with varying degrees of filtration, existing interior air. This is effective in protecting from pollution ingress from outside, but has the side-effect of allowing CO² to build up in the cabin from the respiration of occupants. Although research is scarce in driving situations, the effects of elevated CO² on cognition have been shown, which leads to the reasonable belief that above 1,000ppm – compared to a background of just over 400ppm – there may be effects on driver safety as well as comfort⁹.
Returning to the Tesla, on fresh air mode, CO² increased by just 8%, while on recirculation the increase was 97%. Impressively, the bioweapon mode saw just a 17% increase. The average increase across the 97-vehicle test on recirculation mode was 15% on fresh air and 79% on recirculation.
From this, it is clear that there is a trade-off between protecting the vehicle occupant from particle ingress into the vehicle on fresh air mode and CO² build-up if recirculation is engaged. While this holds true at the level of the individual vehicle, it is not true at the market level. In other words, there are some models that are good at both, and some bad at both. The chart below plots each of the 97 models tested, plus the Tesla X, for particle infiltration on fresh air mode against CO² build-up on recirculation.

For particle number, the values are the ratio between concentrations in the interior and exterior air, so a value of one means they are the same on average. For CO², a value of zero means there is no increase in interior concentrations compared to the baseline. On this latter measure the Subaru Impreza showed the worst performance, in contrast with the best from the Chevrolet Suburban – as indicated on the chart.
In short, there is a wide diversity of results and no obvious pattern, whether it be by manufacturer, vehicle size or powertrain. The most conspicuous activity currently is from premium manufacturers, whose buyers perhaps have the greatest awareness or appreciation of clear cabin air. Beyond that, there appears to be little understanding of the issue in the absence of any useful consumer information.
To help address this, Emissions Analytics is actively involved in a group aiming to standardise the measurement methodology for in-cabin pollution¹⁰. The group was initiated by the AIR Alliance, which already publishes ratings for tailpipe pollution¹¹. Along with Emissions Analytics, the group includes a number of vehicle manufacturers, academics, and filter and ventilation suppliers. Once completed, recognised and repeatable testing should enable ratings to be published that will both inform car buyers and, indirectly, incentivise manufacturers to improve interior air quality.

The Covid-19 pandemic brings these issues to the fore, as the virus is a particle of approximately 100nm in size. While ingress of live virus particles from outside into the vehicle is unlikely, reducing the chance of one infected occupant transmitting the virus to another is more relevant. Therefore, the rate at which air is recirculated and re-filtered matters. In this context many initiatives have appeared from vehicle manufacturers, suppliers and after-market companies. One example has been trailed by Jaguar Land Rover, using hydroxyl radicals to ‘purify’ cabin air¹². While this may be true in terms of neutralising a coronavirus, surplus hydroxyl radicals can also react to form toxic secondary oxygenated gases and aerosols¹³, and so it is vital to perform a broader, perhaps untargeted, assessment of the effects of such systems. Systems should be compared to the efficiency of filter-based systems such as on the Tesla X, to judge what value the hydroxyl radicals are adding – a judgement that will be allowed once there is a standardised method through CEN Workshop 103.
Thus, perhaps the future market for vehicles will be one of the quality of the experience rather than the magnitude of the performance. BEV range anxiety may be quelled and the charge-up infrastructure made omnipresent. Cheap, renewable energy will make efficiency almost irrelevant. The gradual strangulation of the road space for cars, combined with connectively between vehicles and automation thereof, may leave occupants stripped of the joy of the driving experience, but consequently more demanding in terms of the quality and healthiness of the experience. And this differentiation in experience, comfort, quality and design may be the route to profitability for manufacturers.
Footnotes:
https://www.emissionsanalytics.com/news/2020/1/28/tyres-not-tailpipe
PM2.5, i.e. all particles up to a diameter of 2.5μm
https://www.tesla.com/en_GB/blog/putting-tesla-hepa-filter-and-bioweapon-defense-mode-to-the-test
DPham, L., Molden, N., Boyle, S., Johnson, K. et al., “Development of a Standard Testing Method for Vehicle Cabin Air Quality Index,” SAE Int. J. Commer. Veh. 12(2):2019, doi:10.4271/02-12-02-0012

Video: CRC Oral Presentation March 2021
Our CEO & Founder, Nick Molden recently spoke at the annual CRC Real World Emissions Workshop.
Our CEO & Founder, Nick Molden recently spoke at the annual CRC Real World Emissions Workshop.
In this presentation, Nick discusses: ‘Are gasoline vehicles being promoted over diesels as an artifact of the pollutants measured?’

Video: The Situation with Air Quality in Europe
Following our successful We have forty million reasons for failure, but not a single excuse newsletter, our Founder & CEO, Nick Molden delves deeper into the situation with air quality in Europe.
Following our successful We have forty million reasons for failure, but not a single excuse newsletter, our Founder & CEO, Nick Molden delves deeper into the situation with air quality in Europe.


We have forty million reasons for failure, but not a single excuse
Rudyard Kipling’s description of Great Britain’s painful experience in the Boer War could easily have been written for Europe’s troubled recent experience in vehicle emissions control, air quality and associated public health.
Rudyard Kipling’s description of Great Britain’s painful experience in the Boer War could easily have been written for Europe’s troubled recent experience in vehicle emissions control, air quality and associated public health.
The forty million reasons are the forty million diesels still circulating on the roads of the UK and Europe, emitting more than treble the regulatory limit for nitrogen oxides (NOx) in real-world operation1. Of these, an estimated eight million are Euro 6 diesels. None of these are restricted from a single city in Europe, or taxed in a penal way. In Germany, rather than legislating to clean them up, the government has legislated to prevent them being targeted2. The original source of the problem – the European Union regulatory framework – has been directed not at cleaning up this lasting problem, but only at new cars. NOx emissions from this latest generation of vehicles – certified under the Real Driving Emissions (RDE) regulation – account for just 1% of the total, which leaves the 99% coming from previously sold vehicles. The centrally directed, improved, regulation has hardly touched the problem.

Unless these older vehicles are cleaned up, poor air quality will persist. With the average lifespan of a vehicle in Europe being 14 years, and high-emitting vehicles having been sold through to at least 2018, the problem is not about to disappear automatically through fleet turnover. A particularly egregious example is the Mercedes Citan 1.5-litre diesel van from 2019, which emitted 902mg/km of NOx in real-world driving – 8.6 times the regulatory limit – and which may remain on the road long after the UK’s 2030 ban on new internal combustion engines.
Nevertheless, it is not every single pre-RDE vehicle that is problematic. Contrast the Citan with the 2.0-litre Volkswagen Crafter from the same year, which emitted 53mg/km or 58% below the limit, to see that not all vehicles need restricting to address air quality today. Just over a third – 36% – of all vehicles on the UK roads, for example, create an estimated 87% of all NOx emissions, according to our modelling. A third of all emissions are accounted for by the 12% of dirtiest vehicles. In principle, the most efficient, fairest and least distorting way to bring air quality into compliance is to target those vehicles first.
Rather than focusing on making cleaner vehicles even cleaner, Emissions Analytics has been involved in a project for the last three years to test and rate all vehicles currently on the road, to get to the truly dirty vehicles. The project has been led by the AIR Alliance, and has brought together many parties in the spirit of co-operation. Emphasising the important, urgent and persistent nature of the problem was the landmark legal ruling in the UK in 2020 that the death of Ella Kissi-Debrah can be partially attributed to road pollution4.
Contrary to reports, the arrival of battery electric vehicles has not cured urban air quality problems. Perhaps they will, but market penetration of these vehicles will probably not be high enough until the next decade to make a measurable difference. In the meantime, legal contraventions of air quality standards will continue and can only realistically be addressed by cleaning up the existing fleet of internal combustion engines. Add to this the Covid-19 effect, which has seen a robustness in the used car market5 and early evidence of a switch away from public transport. As a result, older, high-emitting diesel vehicles could become more valuable and be kept on the road longer than expected.
Emissions Analytics is one partner of many in the AIR Alliance. Its first act was to bring together top experts and academics, including Dr Norbert Ligterink from TNO in the Netherlands, Professor Helen ApSimon from Imperial College London, Dan Carder from West Virginia University Institute of Technology in the US – who was responsible for uncovering Dieselgate – and Dr Xavier Querol from IDAEA-CSIC in Spain. The group is chaired by Dr Marc Stettler from Imperial College London.
In contrast to many one-off or time-limited initiatives researching this area, Emissions Analytics and AIR Alliance decided to create an on-going programme of testing and rating vehicles. Furthermore, they wanted to create a legal basis for independently rating urban NOx emissions. This was achieved through the publication of a standardised method – CWA17379 – as the result of almost eighteen months work through the Comité Européen de Normalisation (CEN) together with the automotive industry, cities, academics and lobby groups. From this, the AIR Index (www.airindex.com) was born.

How is all this different from the regulations? It is a voluntary movement bringing together a wide range of parties from different points of view interested in genuinely solving the urban air quality problem. Where the rules of multinational organisations have failed, on-the-ground co-operation has created a real-world ratings system with a legal basis.
With the standardised method coined, data was gathered from multiple sources. All data was subjected to strict quality criteria and tested against dynamic boundary conditions – including the speed and acceleration of driving – to test for validity under the method. Data flowed not just from Emissions Analytics, but from authorities and even manufacturers themselves. Results fully compliant with this method are live and free to access on the AIR Index website. In total, well over a thousand models have been tested and four thousand hours of data collected, to the value of over $16 million.
Despite all this data, the challenge with any system that is not by government fiat is achieving coverage of the whole vehicle parc. It is easy to test a representative sample of vehicles, but not to cover the long tail of models. The AIR Index has not achieved that yet, but is now close. In fact, ratings are already being published for 34,575 model variants.
With such a large repository of data, it has been possible to model and predict the emissions of vehicles similar to those already tested. Using machine learning techniques it is possible to predict with an impressive degree of accuracy the missing results. The model is trained on all the PEMS data drawn from the multiple sources. The validation set is then the fully compliant CWA17379 results, which are of course excluded from the training set. Using this approach, the average error between compliant and modelled values for distance-specific NOx is just 2.6%3. As a result, a large majority of predicted ratings can be validated through blind testing to deliver the correct AIR Index rating on its ‘A’ to ‘E’ scale. For clarity, fully compliant tests and modelled results are always clearly labelled and disclosed as such. If manufacturers, or others, disagree with their predicted ratings, conducting a full test to CWA17379 would lead to the result over-riding the predicted value.
By combining the fully compliant and predicted ratings, it has been possible to create coverage of at least 90% of Euro 5 and Euro 6 models, as shown broken down by powertrain in the table below. These figures include all manufacturers except very low volume niche producers.

Further testing planned may move total coverage to 95% soon.
The result of this work is that there is now a parallel system to the official, centrally directed, certification system that can be adopted by cities across Europe. As a result, cities now have a live, practical tool that can be put immediately to the task of managing the existing fleet to bring NO2 concentrations into compliance.
Analysing the results, we can identify the greatest sources of NOx emissions on UK roads, segmented by Euro stage and AIR Index, as shown in the table below.

Therefore, there is a group of Euro 5 vehicles, with an ‘E’ rating on the AIR Index, that accounts for a third of total emissions, while only representing 12% of vehicles on the road. London’s Ultra Low Emission Zone (ULEZ) has been relatively successful because it has applied an access charge for Euro 5 diesels and earlier, but this is not the most efficient solution as some clean cars are restricted. Were the ULEZ to be based on restricting only vehicles with ‘D’ and ‘E’ ratings on the AIR Index, NOx could be reduced by a further 6% points, while charging 2% fewer cars.
The group of pre-RDE Euro 6 diesels with ‘D’ or ‘E’ AIR Index ratings is smaller than the Euro 5 group, but still important at 9% of total emissions. What is even more significant about these vehicles is that they form the ‘swing group’ that can make the difference between air quality non-compliance and compliance.

In a research report from January 2020 from Imperial College London6, the AIR Index emissions values were combined with standard dispersion models to show the impact of different ULEZ strategies on ambient NO2 concentrations and the number of legal excedances. If the current strategy were applied to the enlarged ULEZ it was shown to bring most but not all locations into compliance with the 40μg/m3 limit, compared to a majority being non-compliant prior to the ULEZ. Switching to ULEZ restrictions based on ‘D’ and ‘E’ on the AIR Index scale, irrespective of Euro stage, was shown to be sufficient to bring all areas into compliance. In other words, the pre-RDE Euro 6 diesels make the difference.
Emissions Analytics is pleased to be involved in this practical, decentralised, collaborative, ground-up attempt to resolve one important element of air quality. On-going testing will move the project closer to complete coverage, and it is set up to welcome an increasing number of data partners. As the supply of data increases, so the accuracy of the database improves.
The only element missing is an honest reckoning by the authorities as to the systemic weaknesses that led to these problems. Without that, the weaknesses may resurface. For the sake of Ella, heed perhaps should be taken of Kipling:
Let us admit it fairly, as a business people should,
We have had no end of a lesson: it will do us no end of good.
Footnotes:
Transport & Environment, Cars with engines: can they ever be clean?, September 2018
Efficient control of NOx from diesel cars and ULEZ reduction of NO2 concentration, ApSimon, H., Oxley, T., Mehlig, D., Woodward, H., Stettler, M., Molden, N.

Video: Testing Plug-In Hybrids and Battery Electric Vehicles
Following the success of our recent newsletter ‘Letting the cat out of the bag: The great plug-in hybrid subsidy’ our Founder and CEO, Nick Molden has showcased our thorough testing process.
Following the success of our recent newsletter ‘Letting the cat out of the bag: The great plug-in hybrid subsidy’ our Founder and CEO, Nick Molden has showcased our thorough testing process.
Our independent testing tests for electric range and fuel economy separately. This gives us the necessary resolution on the vehicles we test and provides invaluable insights into the economic impact of these vehicles too. Find out more about our process.
Watch our video to learn more:
Letting the cat out of the bag: The great plug-in hybrid subsidy
In a recent newsletter, we set out Schrödinger’s Car, drawing a parallel with the famous Schrödinger’s Cat thought experiment, where a cat in a box is both dead and alive until the box is opened.
In a recent newsletter, we set out Schrödinger’s Car, drawing a parallel with the famous Schrödinger’s Cat thought experiment, where a cat in a box is both dead and alive until the box is opened. Schrödinger’s Car is a vehicle that has high and low carbon dioxide (CO2) emissions until the occasion that it is driven, which describes the current situation with plug-in hybrid vehicles (PHEVs). In the best case, they could be cleaner than pure battery electric vehicles (BEVs), in the worst case higher emitting than standard internal combustion engines (ICEs), and on current behaviour no better than non-plug-in full hybrids (FHEVs) – all on a lifecycle analysis basis.
The conclusion was that PHEVs are too risky to allow into the market in any volumes, unless strong incentive mechanisms are put in place for drivers to charge them up regularly and employ them only on duty cycles that can be conducted mostly on battery. In some European countries, there are in fact positive incentives not to charge PHEVs, for example for company car drivers that get reimbursed for fuel spending but not additional domestic electricity consumption.
Emissions Analytics has tested 37 PHEVs in Europe and US using its standardised EQUA Index test protocol. The average CO2 emissions on the European PHEV vehicles tested are 115g/km, based on the typical proportion of miles driven on battery discussed below. This compares to an average on the official ratings of 58g/km, based on the Worldwide Harmonised Light Vehicle Test Procedure (WLTP) – so, real-world emissions are almost exactly double.

If these excessive CO2 emissions were not problematic enough in themselves, this situation is creating significant, but somewhat covert, subsidies of PHEVs in Europe and the UK through the fleet average CO2 target system and consumer incentives. As set out below, the annual subsidy across Europe may well be above €6bn already. However, this could rise steeply in a particular scenario that BEV take-up is slower than expected and manufacturers need to sell PHEVs in volume as they struggle to meet their ever-tightening fleet average CO2 targets through to 2030 and beyond. In contrast, if BEV penetration rises rapidly, the scenario set out below will not hold, as CO2 targets will easily be met, and PHEVs will be a brief transitional technology. In the more pessimistic scenario, where manufacturers rely heavily on PHEVs to meet CO2 targets, cumulative subsidy could add up to €475bn by 2035 – more than all motor-vehicle-related taxes paid each year in Europe1.
To illustrate this, a selection of three European PHEVs were taken, and each were paired with the nearest equivalent ICE vehicle. The official details are shown in the table below.

In a recent report, the International Council on Clean Transportation (ICCT) estimated the proportion of miles travelled on battery by PHEVs in Europe currently at around 37%2. This factor can be used to weight zero-CO2 battery operation with engine-only CO2 approximated by the WLTP of the equivalent ICE vehicle to yield a 'simulated' WLTP for the PHEV, as shown in the following table. This can be compared to the actual test values from the EQUA Index tests, weighted in the same way. Conversely, it is possible to estimate what proportion of driving would need to be on the battery for the NEDC and WLTP official test values to accord with actual practice.
Overall, EQUA Index CO2 results were only 4% higher than the simulated WLTP values. Whether considering the NEDC or WLTP, approximately 80% of driving must be on battery for the official CO2 values to be a meaningful representation of current driving, which is more than double the current reality.
This matters because of how it interacts with the Europe-wide fleet average CO2 targets. Averaging the emissions of new vehicles sold, each manufacturer must not exceed a threshold which is currently around 95g/km (the exact figure being tailored to each company, based on their mix of vehicle types), but which reduces over time. For each g/km above the limit, the manufacturer is fined £85 (€95) multiplied by the number of units sold. Below the limit, the manufacturer can effectively sell its surplus to a rival that is above the limit, thereby reducing the fine paid by that latter manufacturer by the same £85.
Taking the sample of three vehicles above, the simulated WLTP average is 114g/km compared to the official values of 35g/km, a difference of 79g/km. Alongside this, until 2022, the fleet average targets include ‘supercredits’, which allow each vehicle with official CO2 below 50g/km to count as 1.67 vehicles sold in the manufacturer’s overall fleet calculation. Therefore, the value of the difference in CO2 emissions is currently magnified, as shown in the table below.
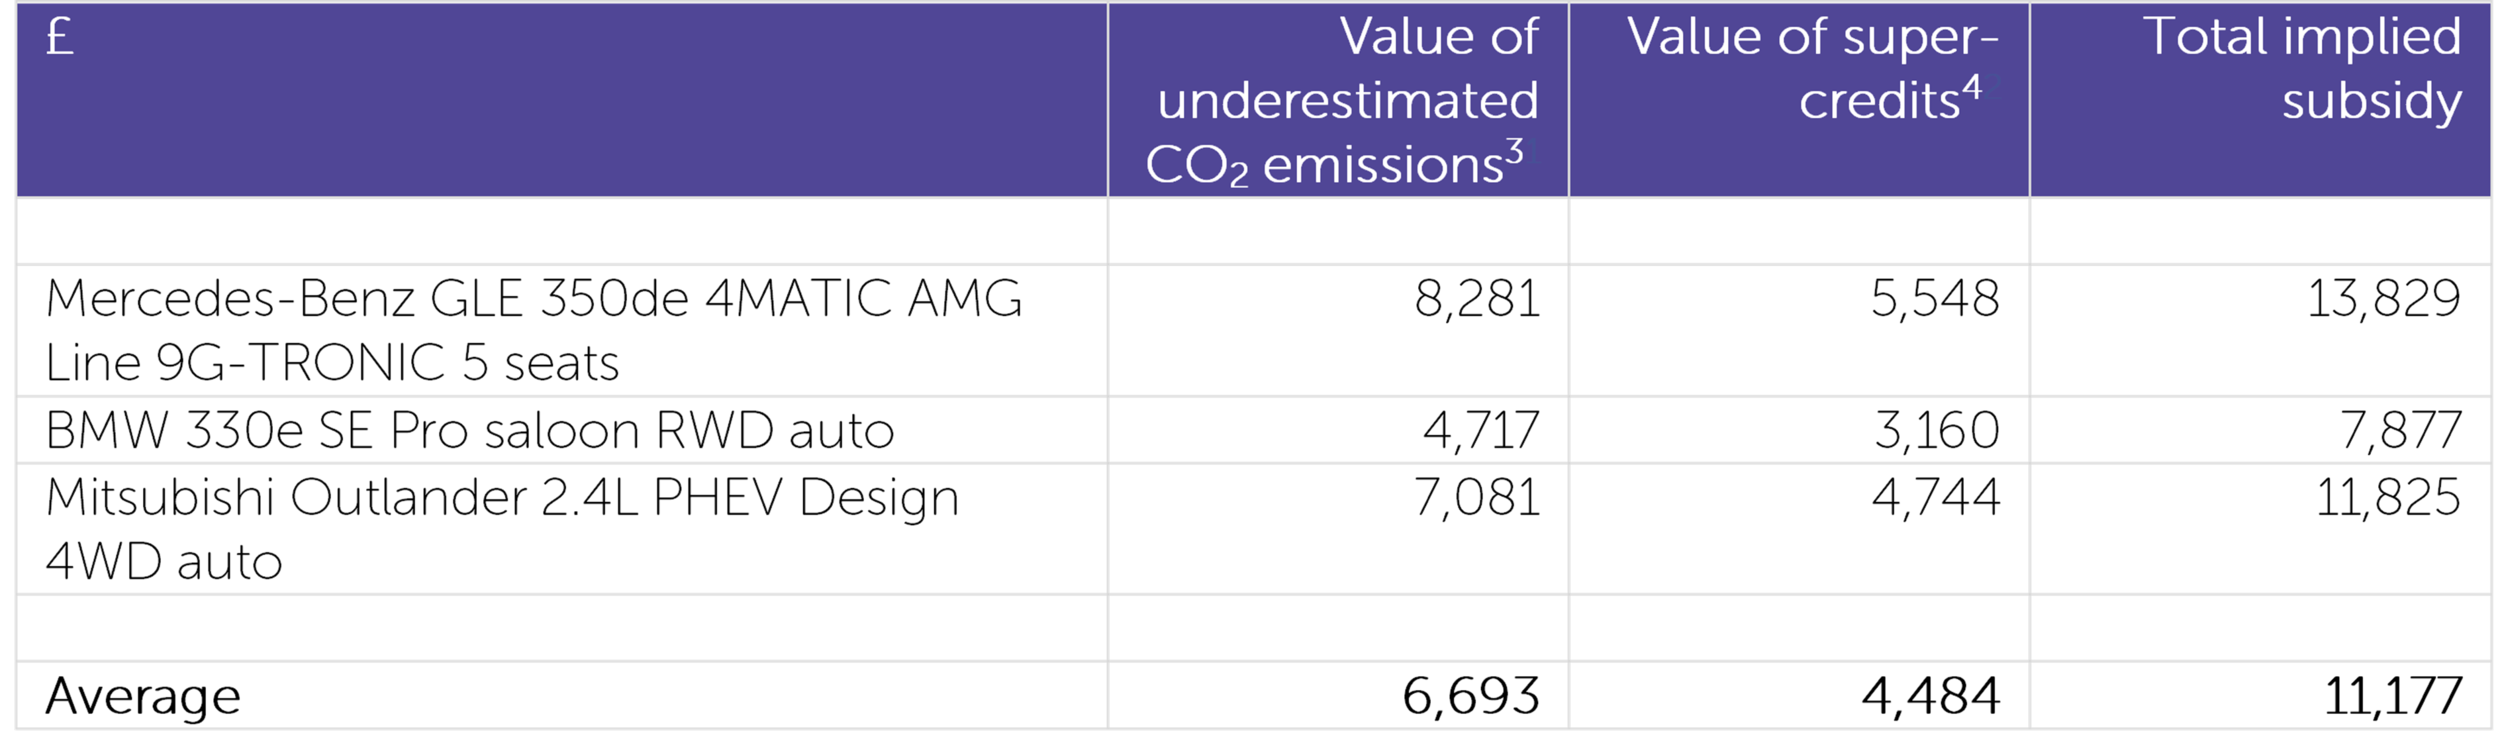
In other words, by having artificially low CO2 values, manufacturers enjoy a significant subsidy from the European taxpayer of over £11,000 (€12,100) per unit. This is equivalent to 24% of the list price. As these vehicles are typically profitable to make, unlike most pure battery electric vehicles, it is not surprising that a large number of new models are being brought to market.
In 2020, around half a million PHEVs were sold in Europe. This would imply a total subsidy of over £5.5bn (€6.1bn). Projections for PHEV sales in 2030 vary widely, from below 10% by Deloitte to as much as 50%. Assuming total sales of all powertrains of 15m vehicles in 2030, this implies a total potential subsidy in that year of between £10bn (€11bn) and £50bn (€55bn), factoring in the phase out of supercredits.
If we take the mid-point of these 2030 scenarios, PHEV market share grows in a linear way up until then, and is constant after that until 2035, the cumulative subsidy would be a not inconsiderable one-third of a trillion Euros. This is more than half the annual gross domestic product of Bavaria.
But this is does not cover all the subsidies available for PHEVs. Many European countries incentivise their purchase, through a combination of retail subsidies, annual car tax reduction and benefit-in-kind income tax reduction for cars provided to employees by their company. The type and magnitude of these subsidies vary significantly between countries, but we can take the UK as an example.
The source of the subsidy is the same as with the fleet average CO2 targets: artificially low official CO2 figures. It is the prerogative of governments to offer subsidies to consumers, but this is being done in a covert manner, and does not align with the true environmental effects of these vehicles. In the UK, the subsidy is channelled through company car benefit-in-kind tax and annual road duty. While the latter applies across the market, company cars – including schemes such as ‘salary sacrifice’ – account for only around 15% of the market5.
The table below shows the implied value of the underestimation of CO2 emissions – how much less consumers pay than they 'should'. The final column weights the company car subsidy by the 15% market share to get a representative value for the whole market.
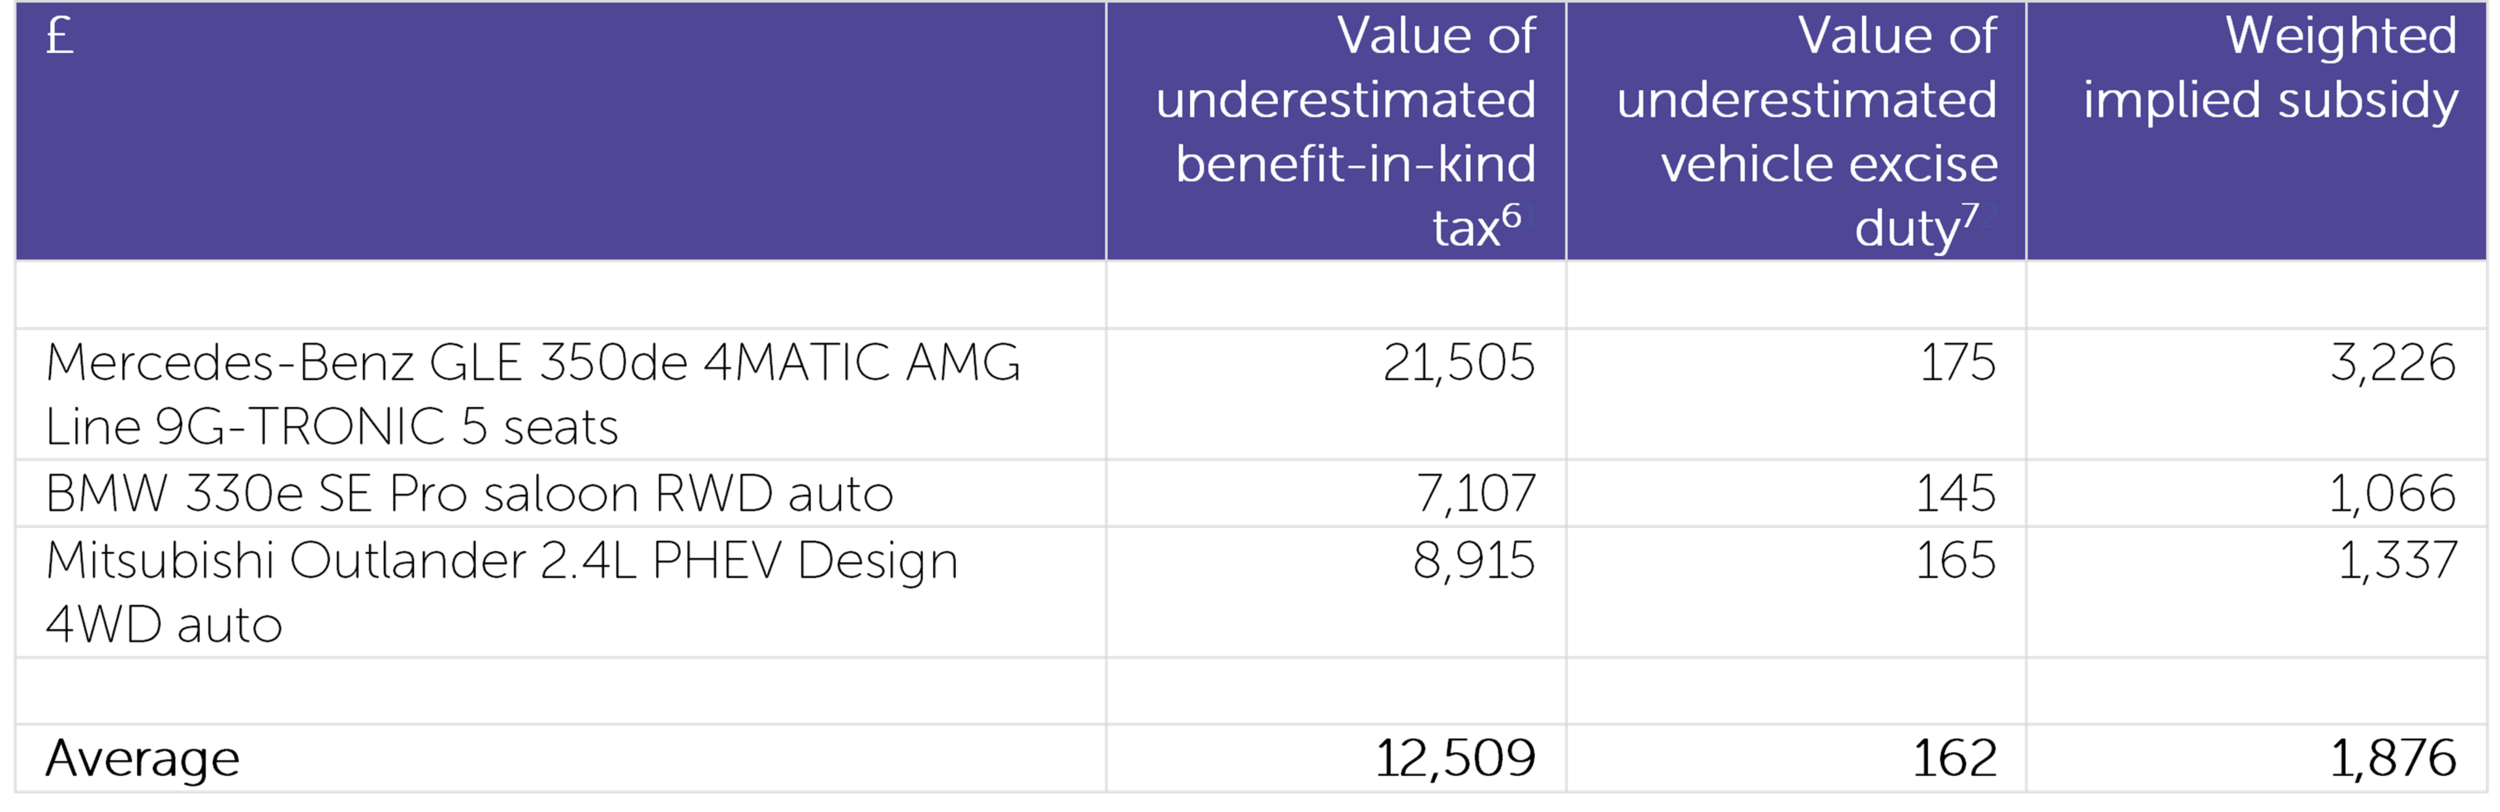
The subsidy to a company car driver over a three-year period is £12,671 (€13,938). On top of the manufacturer subsidy, this is 52% of the average vehicle list price. Across the whole UK market, weighting the company cars at 15% of the total market, the average consumer subsidy is over £1,800 (€1,980). Combining this with the manufacturer subsidy, the total subsidy is £13,053 (€14,358) per unit, or 28% of list price.
Taking this value, together with the same market share projections through to 2035 as above, the total subsidy would be €475bn – almost the same as the gross domestic product of Baden-Württemberg. Of course, this relies on the scenario that PHEVs are the swing factor for manufacturers in meeting or not meeting their future CO2 targets, which may not be the case if BEV penetration accelerates.
It should also be noted that the levels and terms of these taxes and duties are subject to change by governments at relatively short notice, and they differ between each country in Europe. Whether the overall level of support from governments is increased or decreased is unpredictable. In contrast, there is greater future visibility on the fleet average CO2 system.
Ultimately, the amount of taxpayers’ money dispensed, the trajectory of climate change and the structure of the automotive industry rides on whether Schrödinger’s Car, like the Cat, lives. Unless the right incentives are put in place around both original purchase for the right use cases, and after purchase to encourage charging the vehicles, PHEVs should have all subsidy removed immediately. With the current propensity for owners to charge their PHEVs, the CO2 emissions are no better than traditional hybrids, which do not attract the same subsidies, and which put much less pressure on the battery material supply chain.
Footnotes:
ACEA (European Automobile Manufacturers’ Association), https://www.acea.be/press-releases/article/motor-vehicle-taxation-brings-in-440.4-billion-for-governments-in-major-eur
Real-world usage of plug-in hybrid electric vehicles, International Council on Clean Transportation/Fraunhofer Institute for Systems and Innovation Research ISI, September 2020
Difference between simulated CO2 and NEDC, multiplied by £85 (€95) as the market price of carbon, applied only in year of purchase
Supercredits as defined under fleet average CO2 system – assuming x1.67 for a sale in 2021
According to HMRC, there are 870,000 company car drivers in total (https://www.fleetnews.co.uk/news/fleet-industry-news/2020/09/30/hmrc-data-shows-30-000-fewer-company-cars) and a vehicle may be held for an average of three years, yielding 290,000 purchases per year, which is approximately 15% of the 2m annual UK car market
Assuming 40% higher-rate tax payer, multiplied by 10% company car share of market over three-year period and 13.8% employer National Insurance
Annual vehicle road tax, based on CO2 emissions over three years

Side effects may include...
Beware the secondary effects of decarbonisation
Beware the secondary effects of decarbonisation
No vehicle yet designed generates zero emissions. Despite much variation geographically, and much argument, battery electric vehicles probably, on average, halve lifecycle carbon dioxide (CO2) emissions when considering first-round effects such as manufacturing and operation. But are the advantages as clear if secondary effects – the side effects – of electrification are considered?

In a previous newsletter, we set out our Eight Principles of Decarbonisation required to meet a real net-zero target, as shown below. By "real net-zero" we mean actually net-zero in a similar way to the "absolute zero" set down in UK FIRES by Allwood et al in 2019.
Vehicle manufacturers are performing increasingly sophisticated lifecycle analyses of their products. However, most do not consider the secondary, or knock-on, consequences of these electrified vehicles. This is our Sixth Principle of Decarbonisation.

These side effects may include the knock-on consequences on energy infrastructure, vehicle design, driver behaviour and traffic patterns. Most immediately, electric vehicles are likely to increase demand on the electricity grid. To meet net-zero, this additional demand will need to be fulfilled with zero-carbon electricity. Cleaning existing electricity will not be sufficient. For any net-zero scenario it is a pre-requisite that the whole future grid is clean, but we will not look at this further here as it is outside the scope of this newsletter despite being foundational to any meaningful solution.
The most frequent concern with battery electric vehicles (BEVs) is that the additional weight compared to equivalent internal combustion engines (ICEs) leads to higher non-exhaust emissions, which may equal or exceed the eliminated exhaust emissions. These non-exhaust emissions from the vehicle come from its brakes and tyres. Road abrasion and resuspension are often included in non-exhaust emissions, but will be set aside here as they do not originate directly from the vehicle.
Emissions Analytics conducted a long-term study on the wear from Continental Contisport 6 tyres on a 2012 Mercedes C-Class driven on the public highway in consistent, normal conditions. For the first 1,200km, with no added payload, the average wear rate was 161mg/km, but over 31,000km the average wear rate fell to 76mg/km. Even this lower value is 15 times higher than the maximum permission exhaust particle mass emissions under current European regulations. Running the same 1,200km test but with 570kg of payload in addition to the driver, the wear rate increased to 194mg/km, an uplift of 21%. In other words, the average uplift was almost 6mg/km for every additional 100kg of payload. For example, on this basis the Jaguar I-Pace would emit 16% more tyre particle wear than the nearest equivalent Jaguar F-Pace, due to the 443kg additional overall weight.
As a reference, the maximum exhaust particle mass emissions permitted in the EU since 2009 is 5mg/km1. Often, real-world emissions on vehicles with a particle filter are well below 1mg/km. Therefore, for every 100kg of extra payload, the added tyre wear emissions may be as much as the maximum allowed out of the tailpipe in total, and more like five times more than the tailpipe emissions in practice.
However, this analysis may overstate the increase. The extensive regenerative braking of the BEV may well reduce brake emissions and the calibration of the electric motors may smooth driving dynamics to reduce tyre wear. On the other hand, ICEs are increasingly incorporating regenerative braking using 48V systems, and the higher torque of the BEVs (27% in the case of the Jaguars) may encourage more aggressive driving. While data is too limited to draw firm conclusions on these mitigating factors, the underlying upwards pressure on tyre wear remains.
Vehicle weight is clearly a crucial factor in vehicle performance and profitability. The Chinese-built Tesla 3 contains a lithium-iron phosphate (LFP) battery, whereas the US-built versions have the nickel-manganese-cobalt (NMC) version. For similar range, the LFP battery is 200kg heavier, but cheaper in construction. That additional 200kg leads to approximately 8% extra energy to propel the vehicle due to increased inertia and rolling resistance of a typical on-road driving cycle. This leads to greater CO2 emissions in the electricity generation, distribution and usage. At the same time, that extra weight may cause 12mg/km of tyre wear, other things being equal. These downsides could be offset by material light-weighting, power and torque limitations and advanced tyre materials – but all come at either added cost or reduced driver utility.

Switching to inside the vehicle, the preoccupation with maximising the range of electrified vehicles – to be competitive with ICEs – may lead to worse vehicle interior air quality. Incoming air to the vehicle’s ventilation system is usually filtered to remove first-and-foremost particles, but this process consumes energy due to the back pressure created by the filter. While this may be insignificant proportionately on an energy-consumptive ICE, it can be material on more efficient vehicles.
Emissions Analytics conducted a test programme across 97 recent model year cars in the US market and found that many hybrids had relatively poor filtration. Tests were conducted on a standardised urban route around Los Angeles. Real-time particle number concentrations, with a lower size cut-off of 15nm, were measured simultaneously inside and outside of the vehicle and the integrated values ratioed over the test. Condensing Particle Counters from National Air Quality Testing Services (NAQTS)2 were used. The testing followed the methodology set down in a Society of Automotive Engineers (SAE) paper authored by Emissions Analytics and the University of California Riverside3.
Not all electrified vehicles performed poorly, but the majority did. The average cabin air quality index from hybrids was 55% worse than the other vehicles in the group, and the particle ingress on the worst was 3.6 times higher than the average of standard vehicles. In contrast, the Jaguar I-Pace BEV was one of the best performers. Although not part of this testing, Tesla’s ‘biohazard’ high efficient particulate air (HEPA) filter, which is now standard on the Models S and X, has excellent reported particle ingress performance, although it will still come at the cost of increased energy consumption.
To quantify this energy consumption, we can look at the mechanics of the ventilation system. A typical vehicle heating, ventilation and air conditioning system consumes from around 140W to 1.4kW depending on the setting4. The lower value is an approximation of the power requirement of the fan and the energy required to overcome the back pressure from the filter. At an average speed of 40km/h, the energy consumption would be between 0.28kWh and 2.8kWh per 100km driven. A typical BEV would consume 25kWh per 100km, so the ventilation system may add between 1.1% and 11% to overall energy consumption. For this reason, there is an incentive to reduce the amount of air filtered, the filtration efficiency or air conditioning activity on electrified vehicles, which would lead to higher particle exposures – and the resulting adverse health effects – of the occupants.
Thinking more widely at the transportation system level, a problem that may start to emerge is added congestion, caused by extra vehicle miles from electric vehicles, which then may adversely affect total emissions from the fleet. This would apply during the transition, while BEV penetration remains relatively low.
A BEV costs approximately 5 pence (5.5 Euro cents) per kilometre in energy costs, compared to 12 pence (13.2 cents) for a reasonably frugal ICE5. Other things being equal, this is likely to lead to more and longer journeys, and a switch to cars from other forms of transport: the income and substitution effects. Setting aside the effects on the economics of public transport, the additional traffic volume will lead to greater congestion, other things being equal. As the fleet will remain predominantly powered by ICEs for decades – due to the legacy light-duty fleet and diesel remaining prevalent for heavy-duty vehicles – this added congestion caused by BEVs is likely to cause increased emissions from these legacy ICEs.
Analysing Emissions Analytics’ database of over 2,000 light-duty vehicles, we can quantify the effect of this added congestion. To travel the same distance at the same speed (65km/h), a driving profile with stopping and starting between 30km/h and 90km/h can create higher emissions than steady-state driving. On average, CO2 emissions are 24% higher, NOx emissions 89% higher and particle number emissions 75% higher. For a period, a relatively small number of BEVs may adversely affect the emissions of the majority ICEs, increasing emissions and worsening air quality. This does not mean the push to BEVs is wrong, but the secondary effect in the short- to medium-term must be considered. One mitigation would be to push faster for BEV penetration.
As congestion leads to longer journey times, the rational response would be for some distance-based or road-access pricing. At least, this would need to compensate for the naturally lower marginal costs of operation of BEVs. More widely, there is a strong argument that motoring generally is under-priced. The pollution produced by an ICE is a negative externality not internalised, which leads to over-consumption.

In summary, these are just three of the potential side effects of electrification. This does not mean that electrification is bad, but that these secondary effects must be understood and controlled. With the large amounts of taxpayers’ money being requested to build the electric infrastructure, there should at least be a responsibility that this is well spent and not just the catalyst for swapping one problem for another.
Footnotes:
- Or 4.5mg/km under the PMP protocol
- NAQTS
- Researchgate Publication 333500744 Development of a Standard Testing Method for Vehicle Cabin Air Quality Index
- Impact of the Air-Conditioning System on the Power Consumption of an Electric Vehicle Powered by Lithium-Ion Battery, Modelling and Simulation in Engineering, 2013
- Assuming 2.5 miles per kWh and 12.5 pence per kWh for the BEV; 45mpg (6.3l/100km) and £1.20 per litre (€1.33) for the ICE

Schrödinger’s Car
Are they good or are they bad? Like the feline thought experiment, where the cat is both dead and alive simultaneously until observed, the answer is that plug-in hybrid vehicles (PHEVs) are both good and bad until they are used.
Resolving the enigma of plug-in hybrid vehicles
Are they good or are they bad? Like the feline thought experiment, where the cat is both dead and alive simultaneously until observed, the answer is that plug-in hybrid vehicles (PHEVs) are both good and bad until they are used. It matters because this particular powertrain lies at the epicentre of the battleground for carbon dioxide (CO2) reduction and, therefore, the prospects for containing climate change.
An earlier newsletter (Plugin hybrids without behavioral compliance risk failure) considered the variability in emissions and fuel consumption of PHEVs, and the dangers for policy. Now that PHEV sales are accelerating, the topic has become more urgent: how to ensure that a valid bridging technology to an electrified future does not become the next emissions crisis. How can we head off a collision between unpredictable consumer behaviour and misleading official emissions ratings?
Car labelling (whether for CO2, fuel economy or noxious emissions) has historically been about the car, with the view that ultimately its performance can be characterised fairly in a single “combined” number. This figure is used variously for regulation, taxation, urban access policy and consumer information. Now we face the situation where vehicle performance is arguably secondary to driver behaviour. The corollary of this is, perhaps: label the driver, not the car.

In traditional vehicle emissions labelling, it has been possible to “get away” with the single combined number because the difference between the worse case (urban driving) and better case (motorway driving) was around a one-third increase in CO2 emissions and fuel consumption. In other words, the combined number would not be far away from reality for most drivers over time.
Emissions Analytics has tested 37 PHEVs for its independent emissions programme. The method uses the EQUA Index test route – which is significantly longer than official cycles, combining urban, rural and motorway driving – and tests separately for electric-only range and engine-only efficiency, both in real-world, on-road conditions.
The table below summarises the results, split between European and US tests1. Comparing the engine-only mode to official certification values, real-world CO2 emissions are between double and treble. In this case, though, the real-world combined number appears to be a good characterisation of the performance of the vehicle, whether it is used in urban or extra-urban driving.

However, once you introduce real-world driver behaviour in terms of trip mixes and charging up of the battery between trips, it becomes clear that there is a significant problem. From the same test data, real-world CO2 emissions are as high as 299g/km in average urban driving if you never charge the battery up. At the other extreme, if you always charge up the battery and only ever take short journeys, CO2 emissions will be almost zero. In other words, there are orders of magnitude of difference between the best and worse cases. In certain use cases, real-world CO2 may be substantially better than the official figures.
For comparison, at the height of the divergence between the old New European Driving Cycle (NEDC) and real-world values for internal combustion engines (ICEs) – before it was replaced by the Worldwide Harmonised Light Vehicle Test Procedure (WLTP) – the spread was only around 50%. The result of the NEDC official labelling system diverging from reality artificially led to the sales of downsized engines in large cars and the dieselisation of city cars. The damage in terms of both CO2 emissions and air quality will remain for more than another decade as those ‘artefact vehicles’ remain on the fleet.
The US test procedure is different from the WLTP, but achieves similar test results, but then applies a reduction of up to 30% to the fuel economy values and thereby a similar increase to the CO2 values. While this approach can work well for ICEs to align official values for real-world consumer labelling, it does not solve the problem of the divergence in performance possible for each PHEV.
The variance in performance between best and worst cases is more than a point of statistical interest. It has the strong potential to undermine the whole system of fleet average CO2 targets. If, for example, these vehicles travel only 10% of their distance on battery, they would be greater generators of CO2 emissions that full hybrids (FHEV) and mildly hybridised diesel ICE vehicles.
This proportion of miles travelled on the battery is called the “utility factor” (UF). If we compare the average European real-world tailpipe emissions of 182g/km from a PHEV with the crucial 50g/km threshold, this implies a UF of 72%. The 50g/km is important because it is a widely recognised benchmark for “ultra low emission vehicles”, below which manufacturers receive supercredits towards their fleet average CO2 targets and many consumers receive significant tax benefits. However, according to a recent report from the International Council on Clean Transportation (ICCT)3, the UF may currently be around 37% – this would imply real-world CO2 emissions of around 115g/km, worse than the best FHEVs.
On this 37% UF scenario, real-world emissions would be 130% higher than the 50g/km threshold. This means that labelling of PHEVs presents a much greater danger than ICEs did under the NEDC, the latter being a major contributor to the Dieselgate scandal. The combination of low CO2 values the WLTP permits and the current supercredits system is leading manufacturers to launch a large number of new PHEV models. For example, Jaguar Land Rover will have seven models by the end of 2020, and Daimler will have 20 by 2021, rising to 25 by 2025. In the UK, sales of PHEVs rose from 4,788 in January 2020 to 12,400 by September. According to the Fraunhofer Institute, there were approximately two million such vehicles on the roads worldwide by the end of 2019. Therefore, the next scandal is already brewing, as manufacturers react to the incentive structure provided by regulations, which is creating the next generation of artefact vehicles.
The system as currently constructed means that the manufacturer is bearing no direct risk of this UF being less than required for real-world emissions to align with official values. Instead, society bears the risk. In fact, manufacturers have a positive incentive to produce these vehicles due to the supercredits system that runs for the coming three years. This is a dysfunctional situation.
To illustrate the degree of the challenge, we can consider what proportion of miles must be driven on battery by a PHEV to be better than alternative powertrains. To make the comparison as fair as possible, including against BEVs, lifecycle emissions are used in the table below.

These values are based on Emissions Analytics’ testing of Euro 6 vehicles, and its proprietary lifecycle model. ‘Cleaning grid’ refers to the CO2 intensity of the electricity used to power a new BEV over its lifetime as the grid decarbonises, as forecast by the Eindhoven University of Technology5.
Although even modest charging-up renders PHEVs superior to unhybridised ICEs, a mildly hybridised diesel – with a ~6% efficiency advantage over a standard diesel ICE – would be comparable if around a fifth of miles were on the battery. The current utility factor of 37% described above leaves PHEVs performing the same as non-plug-in full hybrids, but with the extra consumer hassle and resource requirements. However, PHEVs can be superior to BEVs if they are used on the battery for just over seven out of every ten miles, using a reasonably optimistic view on grid decarbonisation, due to the extra CO2 from manufacture of the larger BEV battery.
The final line in the table shows that the official 50g/km threshold implicitly assumes that consumers charge up at least 73% of the time, which is double the reality. This is another way of quantifying the artefact of the WLTP and fleet average CO2 target systems.
This shows that it is possible to argue that PHEVs are the best of all worlds, rendering all other powertrains obsolete. Customers could have the smooth, low-end torque, high-end power boost and no range anxiety at an acceptable price. At the same time, you could argue that they are no better than non-plug-in hybrids and should not exist. Thence this enigmatic feline?
One option would be for manufacturers to assume this UF risk, through a system of post hoc reweighting of their official figures for the purposes of the fleet average CO2 targets, according to the real-world UF. Consumer labels could also be reviewed annually, without vehicles needing to be retested or certified. This would incentivise manufacturers to market these vehicles only to consumers likely to operate them with a high UF.
Under European regulations, vehicles will have to report their real-world fuel consumption from 2021. This could give a good estimate of the real-world UF, which could be used for this reweighting, applied retrospectively to all PHEVs on the road. It would not be a sufficient solution just to wait and see from this data whether there is a problem. There is a problem, and this data can be used to implement a solution today. In vehicle and product safely law, manufacturers are generally responsible for the foreseeable misuse of their products – not charging up a PHEV is arguably foreseeable misuse.
Putting risk onto the manufacturer could be coupled with more sophisticated charging mechanisms for consumers. In the UK, the Renewable Heat Incentive (RHI) for domestic heating offers a subsidy to homeowners based on the amount of ‘renewable’ heating generated, e.g. from an air-source heat pump. Translating this onto vehicles, a telematics system could provide a subsidy for every mile driven on battery and tax on every minute the engine is running. Through a solution like this, the risk could be shared between the manufacturer and the car owner, while delivering society’s goal.

Unless this challenge is resolved, it could lead to – if PHEVs gain high market share – a subversion of the policy for reducing CO2, but equally – if PHEVs are banned – the removal of a potentially powerful low-carbon technology. If you already believe the endgame is BEVs and we just need to get there as soon as possible, then banning PHEVs will seem the obvious and comfortable option. If you believe that the world’s light duty fleet should not be controlled by an oligopoly through its access to battery raw materials and that a competitive market of rival powertrains should be fostered, then the PHEV conundrum needs to be solved.
There are ways in which the official testing regime could be improved. For example, the EQUA Index test methodology for PHEVs developed back in 2014 acknowledged these vehicles could not be characterised in a single number. Therefore, each vehicle has both an electric-only range and an engine-only fuel economy. The official system in the EU already has similarly granular information from certification tests, but then falls into the trap of producing a single number. More recently, Emissions Analytics has measured electricity consumption independently of the vehicle’s systems in real-world conditions through a portable meter, coupled with a measurement of charging losses. Overall, this is the most condensed yet representative way of labelling this type of powertrain.
Nevertheless, better labelling does not answer the policy question of how these vehicles should be represented in the fleet CO2 targets, which still comes back to actual consumer behaviour and that utility factor. Get it wrong, and we may miss our CO2 targets by a significant margin, or dispose of an attractive technology. We may, through neglect, cede a major global market to the owners of certain strategic raw materials.
In the European Commission’s own words: “The stakes are high.”6
Footnotes:
- It is worth noting that the products are clearly very similar in performance between the two territories, and also in technology, as average engine size is 2.0 litres and average battery capacity 11.5 kWh in both regions. The average electric-only range across both markets is 41km. Average prices in Europe are around £41,000 compared to typical average ICE vehicles at £25,000-30,000.
- CO2 conversion from the US Environmental Protection Agency’s MPG-equivalent value
- Real-world usage of plug-in hybrid electric vehicles, International Council on Clean Transportation/Fraunhofer Institute for Systems and Innovation Research ISI, September 2020
- Applying estimated manufacture CO2 emissions to tailpipe threshold for supercredits
- Comparing the lifetime green house gas emissions of electric cars with the emissions of cars using gasoline or diesel, Eindhoven University of Technology, 2020
- Critical Raw Material Resilience: Charting a Path towards greater Security and Sustainability, European Commission, COM(2020) 474 final, 3 September 2020

Press Release
Appointment of Nick Molden as Honorary Research Fellow at Imperial College London
Oxford 9 October 2020
Appointment of Nick Molden as Honorary Research Fellow at Imperial College London
Emissions Analytics and Imperial College London are pleased to announce the appointment from 14 September 2020 of Nick Molden as an Honorary Research Fellow in the Department of Civil and Environmental Engineering, Faculty of Engineering.

Nick Molden is the founder of Emissions Analytics (www.emissionsanalytics.com), a company that pioneered the use of real-world, on-road testing of vehicles to understand their actual levels of pollutant and carbon dioxide emissions. Through the largest programme of independent testing so far conducted, it became possible to understand the true background to and consequences of the ‘Dieselgate’ scandal.
This appointment to Honorary Research Fellow will lead to an increased number of research studies utilising Emissions Analytics’ extensive emissions database. In parallel, new innovative test methodologies will be developed in collaboration, in particular around the study of non-exhaust emissions, which has become a policy priority as vehicles become ever heavier.
Professor Washington Ochieng, Head of the Centre for Transport Studies at Imperial College London, says: “Nick has been collaborating with Imperial for many years on research and teaching around real-world emissions from transport, and this appointment reflects a commitment on both sides to expand and deepen that work.”
Nick Molden says: “Transportation and its emissions is at a crucial juncture with the new challenges being thrown up by electrification, while almost all vehicles on the road remain traditional internal combustion engines. Understanding real-world performance of both is crucial to developing the best solutions and most effective policy.”
Nick Molden is also co-founder of the not-for-profit AIR Alliance (www.airindex), which has a mission to put real-world ratings into the hands of vehicle buyers and to influence policy that can bring about cleaner air and lower greenhouse gas emissions. As chairman of two European CEN Workshops (www.cen.eu), Nick has been instrumental in developing new standards for real-world emissions and air quality.
Nick Molden is a graduate of Christ Church, University of Oxford, with a Masters in Philosophy, Politics and Economics.
Press contacts
Dr Richard Lofthouse, Emissions Analytics
richard.lofthouse@emissionsanalytics.com
+44 (0)7790 902982
Caroline Brogan, Imperial College London
caroline.brogan@imperial.ac.uk
+44(0)20 7594 3415

Eight principles of decarbonisation
Elimination of carbon dioxide from transport must be real not artefact
Elimination of carbon dioxide from transport must be real not artefact
The United Kingdom has enacted a law for net-zero carbon dioxide (CO2) emissions across the economy from 2050, and other countries will likely follow. This has spawned a policy of targeting zero emissions from transportation, which is often spoken about interchangeably with the idea of replacing the vehicle fleet with battery electric vehicles (BEVs). A further benefit of this change is claimed to be improvement in air quality, due to the absence of a tailpipe, and the resulting health benefits. But is this apparent panacea as simple as it sounds?

Slowing climate change is now widely regarded to be of such importance that all ideas need to be robustly tested not just for the glamour of their ambition, but whether they can deliver. Admitting the existence of risk, a mix of approaches may be more robust than gambling all on red. Unintended consequences must also be considered for fear of achieving the goal but at an unacceptable price. As The Economist said in August 2020, “…Mr Xi is shifting to a sharp focus on supply-chain choke-points where China is either vulnerable to foreign coercion or where it can exert influence abroad. That means building up self-sufficiency in key technologies, including semiconductors and batteries.” The reality is that there is already, and will continue to be, a widely predicted global supply constraint on batteries for the rest of this decade if take-up of BEVs is as healthy as it needs to be to fulfil zero carbon transportation.
For transport, then, the right policy could be expressed as delivering zero carbon dioxide (including other gases with equivalent greenhouse gas effects) emissions with no worsening in other pollutants and no vexatious secondary effects. At least, any trade-offs should be understood scientifically and communicated politically. This newsletter will consider what would be necessary and sufficient to achieve this, and the implications.
So, let us set out Emissions Analytics’ Eight Principles of Decarbonisation – the material things that need to be delivered to achieve the stated policy:

Principles 1 and 2 are a significant enough challenge in themselves, but progress is being made in that direction by many countries. There remains a significant issue in the intermittency of many renewable energy sources, especially where there is no nuclear baseload. This newsletter will not go into these further, but unless they are achieved, the advantages of BEVs will be seriously compromised, whatever else is achieved in respect of the other principles.
Principle 3 arises from carbon being a global problem: the total matters, not the source. Reducing upstream CO2 emissions is a very serious challenge given the lack of control that governments can apply to foreign mining and manufacturing operations. It is also material, due to the higher CO2 emissions currently from BEV compared to ICE manufacture, like-for-like. Efforts are being made by manufacturers, including recent reports from BMW and others, to assert some control and transparency, but it remains a significant challenge. Even the transportation of vehicles by sea would need to be completely decarbonised to achieve this, which may conceivably be achieved with alternative fuels such as ammonia produced with zero carbon electricity.
Principle 4 is a growing challenge, with the need to recycle various rare earth metals from drive motors and batteries, or give them a second life before eventual recycling. This is a business opportunity that is already attracting entrants, yet achieving this with zero-carbon energy remains a stretching goal.
Principle 5, means that other emissions that have a global warming effect – often expressed in CO2-equivalence – should be included in analysis, to ensure one climate-charge-relevant emission is not swapped for another, through singular focus on CO2. This could include, for example, methane emissions from gas vehicles or nitrous oxide (N2O) from certain after-treatment systems.
Principle 6 is an important but complex one. This could mean that vehicles should not ‘crowd out’ the use of batteries from existing non-transportation uses. For example, where batteries may be used as static power sources or for powering handheld tools, if demand from transportation made battery prices too high, these uses may switch back to combustion engines. It could also mean that old ICEs that are replaced with BEVs in developed countries are exported to expand fleets in developing countries as their values fall.
Recalling the Dieselgate crisis, where nitrogen oxide (NOx) emissions were found to be insufficiently regulated in a way that led to damagingly high emissions in the real world, there is a big risk from the non-exhaust emissions from BEVs, especially in regard to tyre wear. Due to the weight of batteries, BEV vehicles are significantly heavier that like-for-like ICE vehicles. As a result, for the same grade of tyre and driving patterns, non-exhaust emissions from wear on those tyres will be higher for the BEV. The regenerative braking for BEVs may lead to lower brake wear emissions compared to ICEs, but this is unlikely to counterbalance the increased tyre wear emissions. Therefore, the risk is that the CO2 reduction from BEVs is traded for a degradation in air quality and other microplastic pollution.
Through our work on measuring pollution inside the vehicle cabin, we have observed that hybrid vehicles often have worse interior particle concentrations, which may lead to worse exposures and health effects for occupants. The hypothesis is that, due to the energy requirements, filtration is minimised as these vehicles are sold for their fuel efficiency. Therefore, CO2 may be traded off against human health in this additional dimension.
While carbon credits, Principle 7, may act as a positive incentive mechanism for carbon reduction, inherent in the system is their trading effectively permits the continued use of combustion engines by the purchasers. Therefore, while they may be expedient in the short run, they must be phased out permanently.
Principle 8 is simple: to achieve zero carbon, the whole ICE and hybrid fleet on the road must be replaced. It is likely that the last few percent of vehicles will be hard to shift due to stubborn owners, and therefore the incentives needed may be high. In conjunction with Principle 6, old ICE vehicles should be responsibly recycled, not exported to developing economies, to avoid the scandals associated with the scrappage scheme following the financial crash of 2008, when dirty diesels were ‘scrapped’ at the expense of taxpayers only to be found to have been exported to Eastern Europe and beyond.

Last year, we published this newsletter which showed that hybrids were the best way to reduce CO2 in a world of limited battery capacity. Full hybrids deliver around 30% CO2 reduction compared to the nearest equivalent ICE, compared to the 100% tailpipe reduction of BEVs; but 14 times more hybrids can be built for the same battery capacity, meaning hybrids could actually deliver four times more CO2 reduction than BEVs while the battery constraint remains.
While limited battery capacity remains true for now, let us project forward to a hypothetical world of unconstrained and cost-competitive battery supply. In addition, we also make the critical assumption that all electricity will be zero carbon (Principles 1 and 2). We assume that complete grid decarbonisation will be achieved. We also assume that manufacturing CO2 emissions (Principle 3) remains the same as currently, but also that there is no improvement in ICE efficiency. Further, we are putting no negative value on the utility limitation of the reduced range of BEVs compared to ICEs, which may well persist even when batteries are plentiful in supply and cost competitive due to the weight they add to the vehicle.
To assess these effects, Emissions Analytics has created its own model of the CO2 effects of electrification. Three scenarios were modelled: complete switched to BEVs and full hybrids compared to the ICE baseline.
The manufacture emissions of ICEs, full hybrids (FHEVs; for clarity these exclude mild hybrids and plug-in hybrids, but sit between them in terms of battery size, and rely only on on-board gasoline or diesel for energy) and BEVs are 5.8, 6.2 and 11.4 tonnes per unit1. In use, the average CO2 emissions are 111, 78 and 0 g/km. Assumed annual usage of all three are 16,000km over a lifetime of 200,000km. On the switch-to-BEV strategy, the new car sales mix is assumed to be 100% BEV by 2040, and the whole fleet by early 2050s.
Crucially, as CO2 is cumulative in the atmosphere – it lasts between 300 and 1,000 years once emitted – we must consider cumulative emissions in our analysis. This is the basis of the Paris agreement and countries’ carbon budgets.
On this BEV scenario, cumulative total CO2 emissions emitted are higher for over a decade due to the front-loaded emissions in the manufacture of the BEVs. From 2034, the cumulative CO2 is lower than the benchmark ICE strategy as the benefits of zero in-use emissions begin to outweigh the higher embedded emissions from manufacturing and batteries. By 2070, cumulative emissions are 811m tonnes lower from BEVs. However, this is only 47% down on the ICE strategy; in 2050 it is only 23% down. So, unless you can eliminate manufacture emissions, we are not even close to zero emissions – even ignoring Principles 5 to 8.
If you double average battery size, and therefore double the CO2 in their manufacture, to compensate for the bounded utility of BEVs and bring range more in line with ICEs, then the reduction by 2070 is just 11%, and it is 1% worse still in 2050.
Revisiting the potential for hybrids set out last year, the BEV strategy can also be compared in this model to a FHEV strategy of switching the whole vehicle fleet to FHEVs by the earlier 2050s, and it yields dramatic results.
The BEV strategy is still superior, but the total CO2 reduction by 2050 is just 11% and by 2070 it is 26%. Good, but far from zero. Less good is if you double average battery size, when cumulative CO2 emissions are 5% worse from BEVs than FHEVs.
These results stem from the higher manufacturing emissions of BEVs, which are true not just in the initial switch to BEVs but on subsequent future vehicle replacement, together with the lower in-use CO2 from hybrids. This will only change if Principle 3 is delivered – hence its vital importance. The cynic may think that net vehicle importing countries may be quite content to ‘off-shore’ rather than genuinely reduce the emissions.

Although the legal position is that net zero must be achieved by 2050, from the point of view of climate change, what happens in the next twenty years is just as important. Carbon dioxide has no discount rate. Every gram of CO2 that is reduced now makes the challenge post-2050 easier. Therefore, inaction today on the promise of a miracle solution tomorrow is not a robust policy.
Unless a more robust policy is developed, delivering real and measurable CO2 reduction soon, it is likely around 2035 that BEVgate will break, where much of the promised reduction will have proved illusory and air quality may be worse. As it took 15 years from the introduction of explicit NOx reduction under the ill-fated Euro regulations until Dieselgate, it may be 15 years from now that the folly of dogma rather than facts becomes clear. And our carbon budgets will by then be spent.
Footnotes:
- Derived from https://www.volkswagen-newsroom.com/en/press-releases/electric-vehicles-with-lowest-co2-emissions-4886; in-use emissions for FHEVs applies 30% efficiency estimated by Emissions Analytics

What's the problem with biofuels?
Why is the use of biofuels, promising environmentally friendly reductions in emissions especially for heavy-duty vehicles, not taking off faster and attracting only limited policy focus?
One of the many conundra in transportation emissions is why the use of biofuels, promising environmentally friendly reductions in emissions especially for heavy-duty vehicles, is not taking off faster and attracting only limited policy focus. Compare that to the excited talk around battery electrification of trucks, which generously could be described as a challenging solution.
Across the range of biofuels that Emissions Analytics has tested, some patterns become clear. The first observation is that, on average, they tend to lead to very little change in emissions at the tailpipe. Second, within that average, there tends to be significant variability between vehicle models on the same fuel. Therefore, if comparing tailpipe performance, it is difficult to generalise about the benefits of a particular biofuel, and the expected benefit in any case may be small.

A corollary of the first point is that the proposed benefit of these fuels relies on emissions reduction – often but not always focusing on carbon dioxide (CO2) – located upstream in the fuel production and distribution. This part of the supply chain is often opaque, and not easily subject to independent verification or regulation, as is possible with tailpipe measurement. Therefore, even if the benefits of a biofuel sound attractive, but cannot be verified, it would be right to take a sceptical position. On top of that, there may be secondary, unintended consequences due to competition for scarce resources as biofuel production is scaled, for example by the earlier effects on food supply and prices where raw materials were crops.
Rightly, therefore, many governments have been cautious in incentivising biofuels too categorically. For example, E10 – gasoline containing up to 10% ethanol – has been long proposed in the United Kingdom (UK) and other European countries, yet its adoption has been slow. Natural (fossil) gas, familiar at the pump as either Liquefied Petroleum Gas (LPG) or Autogas, attracts a significant tax advantage in the UK and other countries, yet there is limited forward visibility because the tax advantage is always at risk of withdrawal. Fleets, consequently, have been cautious in converting to natural gas.
To illustrate the dilemma, we can consider test results from two programmes Emissions Analytics has conducted, one covering E10 gasoline, the other compressed natural gas (CNG) and liquefied natural gas (LNG).
Switching from E5 to the higher ethanol E10 gasoline in Europe is often held out as a quick way to deliver large aggregate CO2 reductions as it can be distributed at scale through the existing refuelling infrastructure, to be used both in light- and heavy-duty applications.
To investigate this, we tested E10 on 17 gasoline vehicles in Europe from a wide range of manufacturers. On average, CO2 emissions fell by 0.5%, but this varied at the model level from an increase of 7.1% to a decrease of 6.3%. All were relatively new Euro 5 or Euro 6 vehicles, tested on our standardised on-road cycle made up of urban, rural and motorway elements. Due to the lower energy content of E10, the fuel economy worsened on average by 1.2%, with a similarly wide variation. Perhaps unexpectedly, emissions of nitrogen oxides (NOx) increased by 16.6% on average, from an initial level of 59 mg/km. Carbon monoxide (CO) fell on average by 4.5%.
Therefore, at the tailpipe, the reduction in CO2 was negligible overall. The value of the reduction in CO did not outweigh the effects of the increased NOx emissions, as non-compliant urban air quality is generally caused by excessive NO2 concentrations. For the introduction of E10 to be valuable, the upstream CO2 reduction would need to be large enough to outweigh that increase in NOx emissions. Sufficient transparency around those upstream emissions and any secondary consequences, is not offered by the supply chain and therefore the overall benefit of E10 should rightly be treated with scepticism.
Turning to natural gas, we were invited to be part of the first extensive UK study to assess real-world performance of heavy freight vehicles fuelled by this alternative. The two-year test ending in 2019 was led by biomethane supplier Air Liquide, with three transport operators (Howard Tenens, Asda and Kuehne + Nagel) and three technical partners: Cenex (data monitoring), Microlise (telematics) and Emissions Analytics (real-world testing). The project was supported by Innovate UK.
The goal was to consider the overall performance of gas as a fuel for heavy freight, compared to diesel. A secondary aim was to only use 100% biomethane, which in this case was derived from food waste and supplied by Air Liquide.

Biomethane is chemically similar to its fossil gas counterpart, although the product of a different refining process that starts with biogas that is then improved to increase the methane content and purge it of impurities. Biogas is the raw product of anaerobic decomposition of waste ranging from human and livestock excreta to food waste. Whether from a renewable feedstock or not, gas can be packaged in compressed but gaseous form, or as liquid; it can also be combusted in both spark ignition and compression ignition engines.
Heavy freight vehicles have been produced by different manufacturers to run off both CNG and LNG derivatives. Why the industry has both variants reflects sector immaturity, but also different strengths and weaknesses. For example, when liquefied at minus 160 degrees Celsius, LNG has a higher calorific value for its volume and thereby requires less space for its storage, an important consideration for road freight; but refuelling with LNG requires more safety procedures.
The broader primary energy market is now over 20% gas, following a big rise in recent years, but is dominated by fossil gas drawn from deposits of natural and shale gas, or syngas and coal gas from industrial processes. Of the overall gas market, biomethane, which is renewable as it is made from waste, constitutes just 0.1%, but is growing rapidly1.
In our consortium test, three different models of gas-fuelled heavy goods vehicle were pitted against their nearest diesel counterparts: rigid/CNG/spark ignition, articulated/LNG/spark ignition and articulated/LNG/compression ignition. The vehicles were drawn from three different fleets and three different manufacturers. The test covered urban, rural and motorway driving to reflect typical duty cycles. While different payloads were tested, we will focus on the 60% payload results here.
On average the gas vehicles emitted 8% less tailpipe CO2 than their diesel pairs, but this disguises variation from a 15% reduction to a 4% increase. It was only the switch to biomethane that delivered consistent, material reductions in well-wheel (WTW) greenhouse gas (GHG) savings: of around 80%, and not less than 76% compared to the diesels. The missing 20% reflects various inefficiencies, losses and a small amount of measured methane slippage, while the CO2 benefits rest heavily on the upstream, energy grid benefits of the fuel itself.
Turning now to air quality, particle number emissions were on average 5.4 x 10¹⁰ #/km (23%) lower on the gas vehicles compared to the diesel counterparts. However, the results were sensitive to payload and duty cycle, variable between vehicles as shown in the chart below.

In contrast, NOx emissions were on average 0.02 g/km (59%) higher on the gas vehicles compared to the diesels. Yet again, however the results were variable between vehicles and conditions, as shown below.

Therefore, there is no consistent pattern in the tailpipe emissions between vehicles and fuels and, consequently, the advantage of gas-powered vehicles rests heavily on the upstream CO2 benefits. With a supplier such as Air Liquide, those characteristics are more open to scrutiny and verification, but scaling and diversification of the supply of biomethane would need to adhere to the same standards to ensure those benefits were delivered.
Recently, UK retailer the John Lewis Partnership announced that it will replace 600 of its heaviest freight trucks with biomethane-powered gas alternatives, prioritising overall GHG emissions while retaining a wide array of options for the rest of its 4,800-strong fleet where electrification may begin to play a serious role for vehicles with a gross vehicle weight (GVW) below 10 tonnes.
In this instance the retailer plans to install its own fuelling infrastructure to guarantee that the gas used is 100% renewable, whereas more broadly it is more typical that governments incentivise the addition of renewable gas to the existing gas supply, highly efficient in that it takes advantage of existing infrastructure, but also subject then to confusion about what proportion of the gas is actually renewable, the fossil and non-fossil components comingling.
The John Lewis example appears to show that the climate-advantage of 100% biogas is now strong enough for management to overcome other drawbacks associated with an immature sector where fuelling infrastructure remains patchy, and where the true business case rests on the need for long-term tax incentives that are by nature uncertain.
Another broader question with no clear answer yet is the exact scalability of renewable gas feedstocks, the typical candidates being food, municipal and sewage waste. As soon as the feedstock becomes biomass from crops or wood products there is the risk of unintended consequence, if those feedstocks might have been put to better use – the subject is hugely complex but supply-chain transparency is an imperative where the climate-benefitting value of the fuel is its primary attraction.
All in all, these complexities may lead to greater focus on synthetic liquid fuels rather than biofuels, as proposed by some academics and industry representatives, and which may have application beyond road transportation such as in aviation. This approach may prove to be more transparent and scalable, and the greater control of the manufacturing process may deliver reductions in air pollutant emissions. In both cases, the results from these test programmes show the essential need for independent real-world testing at the vehicle model level, to avoid policy being based on generalities, hunches and good marketing.
Footnotes:
- See: IEA, Outlook for biogas and biomethane: Prospects for organic growth
World Energy Outlook special report
Fuel report — March 2020

Could vehicle automation make carbon dioxide emissions and air quality worse?
Declarations by the European Union (EU), United Nations, vehicle manufacturers and others, have left the widespread impression that connected and autonomous vehicles will reduce the environmental footprint of vehicles. But is this true?
This newsletter is jointly authored by representatives of Emissions Analytics and RDW, the Netherlands Vehicle Authority, bringing together work from each body on this topic of significant ongoing policy and investment interest.
Autonomous driving holds out the promise of improved road safety and mobility, and a cleaner environment. In fact, the European Commission in 2018 asserted that transport “…will be safer, cleaner, cheaper…” as a result of fully automated and connected mobility systems1. Other declarations by the European Union (EU), United Nations, vehicle manufacturers and others, have left the widespread impression that connected and autonomous vehicles will reduce the environmental footprint of vehicles. But is this true?
The claim is based upon more efficient operation, primarily as the result of smoother driving in the widest sense, including less aggressive accelerations and decelerations, better traffic engineering such as intelligent traffic light phasing, and inter-vehicle communications. Emissions Analytics considered these benefits in a study conducted with the Centre for Transport Studies at Imperial College London in 2017, called ‘Optimised Vehicle Autonomy for Ride and Emissions (OVARE)’ and part funded by Innovate UK.
But this study omitted consideration of the internal and external devices required to power the automation, and their energy consumption. Could it be that the benefits of automation are reduced or even eliminated when the whole system is considered? This newsletter will review the OVARE findings, and puts them together with analysis of the latest research on the energy requirement to determine what the net benefit is.
The OVARE project involved creating a traffic micro-simulation using the PTV-VISSIM software, coupled with instantaneous emissions factors derived from data from Emissions Analytics collected using Portable Emissions Measurement Systems (PEMS). Pollutants included were carbon dioxide (CO2), carbon monoxide (CO) and nitrogen oxides (NOx), together with fuel consumption derived using the carbon balance method.
The model was configured to use traffic volumes that reflect typical real-world conditions, with vehicles introduced to the simulated zone at five different entry points. Scenarios for 0%, 20%, 50% and 100% penetration of connected and autonomous vehicles (CAVs) were modelled. The results are shown in the table below2 for peak time traffic scenarios. The reductions during off-peak times were lower – typically 5% or less.

The potential 18% reduction in fuel usage and CO2 emissions is material in the context of the cost of transportation for consumers, energy security and climate change emissions. In the EU, CO2 emissions from passenger cars must be reduced by 37.5% between 2021 and 2035 – CAVs could therefore in principle achieve half of this reduction. Reducing NOx emissions by 21% would reduce the number of cities across Europe with non-compliant concentrations of nitrogen dioxide under the Ambient Air Quality Directive – CAVs could therefore lead to health benefits and reduce the need for costly interventions such as clean air zones. But, to reiterate, these outcomes do not factor in the potential impacts of the connectivity or automation systems themselves.
Now switching to the energy consumption side of the equation, we need to consider both the consumption by the on-board electronic devices required to run the automation and data processing that might take place in the vehicle, on the infrastructure side or in the cloud. For the purposes of the following calculations it is assumed that all vehicles are fully automated at SAE Level 5.
The devices required by this may include ECUs, cameras, lidar and radar – typically over 20 devices in total. With power ranges of between 1W and 80W each, an approximate total power requirement per vehicle would be 200W3. Based on data from the Netherlands – as an advanced European economy – the average number of driving hours per passenger car per year is 440 hours4, which implies an average electricity consumption from automation of 88kWh. Based on the Netherlands’ current energy mix5, with 1kWh resulting in 400g of CO2 emissions, the average battery electric vehicle would emit 35,200g per year. Taking an average distance travelled per car per year of 13,000km, this implies CO2 emissions of 2.7g/km, just from running the on-board devices. If the power were drawn from liquid fuel in an internal combustion engine, 1kWh would result in around 780g6, implying CO2 emissions of 5.3g/km.
More significant is energy required for data processing. Volvo has stated that autonomous driving requires “…a few GB [gigabytes] per second…”7. Other estimates vary, from 1.4 to 19TB [terabytes]/hour, so let’s be cautious and assume 0.4GB/second8. This would imply 634TB/year. Taking a cautious estimate of energy consumption from that data processing rate, we use 0.1kWh per gigabyte from Pihkola et al (2018)9. This conversion factor is subject to significant uncertainty, as set out in Aslan et al (2017)10, ranging from 0.023 to 7.1kWh. Using the same conversion of grid electrical energy to CO2 and distance travelled per year, the resulting estimate of CO2 emissions from data processing is an astonishing 1,950g/km. This compares to current average tailpipe CO2 emissions in the Netherlands of 121g/km and the 95g/km EU fleet average target – automation asks for at least 16 times more. Put another way, with an implied value of €95 per g/km from the EU fines for exceeding the 95g/km target, the ‘cost’ of automation would be around €185,000 per vehicle.

For illustration, if 25% of the processing happens on the vehicle, that would reduce the range of an average European internal combustion vehicle to around 160km. A battery electric vehicle with a 100kWh battery and 400km range would only be able to travel about 70km. This may well not even be physically possible, if the engine is not powerful enough to run the electronic systems and move the vehicle adequately at the same time.
This would clearly render automation unviable from both an emissions and cost point of view. The CO2 and fuel consumption benefits forecast by the OVARE project would be wiped out, as too would the NOx benefits in all likelihood. If the global supply of energy were to increase to the point of cheap, surplus renewable (zero carbon) energy, the CO2 issue would theoretically disappear, although there may still be too little power on board to move the vehicle. Increases in data processing efficiency would reduce the energy requirement and may solve this power problem, as would reducing the amount of data transfer between vehicles and with the infrastructure. On the other hand, increasing requirements around data security and vehicle safety may lead to ever-increasing power demands.
One solution may be to develop processor chips better designed for this type of computation, and thereby more efficient. This could become a significant differentiator between producers, analogous to the differences in battery design. A further solution may be to restrict the domain of automation, accepting that autonomous driving may only be viable within certain situations or geographic locations, rather than covering every conceivable case.

This analysis does not attempt to evaluate the secondary effects of automation on traffic volumes. If automation proves to be an attractive consumer proposition, especially if it accelerates the trends away from some forms of public transport and towards private options, this could make congestion worse. Not only would this waste productive time, but would have the risk of making air quality worse due to legacy internal combustion engines being forced to drive in a more stop-start fashion, and higher tyre and brake wear emissions from all types of vehicle.
In short, the prospect offered by autonomous vehicles has been asserted by many to be “cleaner”, and this generally has been believed without in-depth scrutiny. As with tailpipe emissions, and as with battery electric vehicles, the message must be that independent, real-world data is vital to inform the debate and policy formation, to ensure that consumers and the market are not led down another avenue that in practice makes air quality or carbon emissions worse, often fertilised by large amounts of taxpayer money.
Nevertheless, we acknowledge the uncertainties in the above analysis and potential future efficiency improvements. We would welcome contributions of recent test data from OEMs or suppliers for a follow-up newsletter. However, if these findings even broadly reflect the reality, they could lead to a rapid reassessment of the realistic potential and timing of fully automated driving for passenger vehicles.
As a first step, it would be helpful to move beyond a narrative that uses ‘autonomous’ and ‘low emission’ as almost interchangeably good things. They are not. They more likely trade off against one another.
Nick Molden, Emissions Analytics, United Kingdom
Peter Striekwold, RDW, The Netherlands
Footnotes:
https://ec.europa.eu/growth/content/europe-move-commission-completes-its-agenda-safe-clean-and-connected-mobility_en
Su, K. (2017) IMPACTS OF AUTONOMOUS VEHICLES ON EMISSIONS AND FUEL CONSUMPTION IN URBAN AREAS. MSc Dissertation, Imperial College London, and Hu, S. Stettler, M.E.J., Angeloudis, P. Karamanis, R. Molden, N. (2017). Impact of vehicle automation on emissions and ride comfort. Microsimulation for Connected and Autonomous Vehicles Workshop, Loughborough UK, 2017.
https://www.osti.gov/biblio/1474470
https://hblankes.home.xs4all.nl/Oud/snelheid.htm
https://www.cbs.nl/-/media/_excel/2018/04/tabelvoorartikelrendementco2emissieelekrtriciteit2017.xls
260g of CO2 in gasoline or diesel with 1kWh of embedded energy, adjusted for 33% combustion efficiency
https://www.vpro.nl/programmas/tegenlicht/kijk/afleveringen/2018-2019/De-rijdende-robot.html
https://www.tuxera.com/blog/autonomous-cars-300-tb-of-data-per-year/
https://pdfs.semanticscholar.org/be83/e9a9a7e10a7f29a846fc54d62f08ebe9e884.pdf
https://onlinelibrary.wiley.com/doi/full/10.1111/jiec.12630

The Eclectic Highway podcast: The Fastest Route to CO2 Reduction
Listen to our Founder & CEO Nick Molden on Episode 4 of The Eclectic Highway podcast in a discussion with Kelly Senecal about the fastest route to CO2 reduction in transportation.

Our Founder & CEO Nick Molden was delighted to be invited on to Episode 4 of The Eclectic Highway podcast to take part in a discussion with Kelly Senecal about the fastest route to CO2 reduction in transportation.
Click below to hear the podcast:
You can also:
Listen on Apple
Listen on Spotify

WEBINAR REPLAY: RDE Surveillance and Compliance
Watch a replay of our recent webinar where Nick Molden explains how we can support with critical competitive benchmarking and off-cycle evaluations.

Title: RDE Surveillance and Compliance - - Independent data to enhance competitiveness and manage risk
First Shown: Tuesday 28th April - 16:30 GMT / 17:30 CET / 12:30 EST / 08:30 PST
Running time: 30 minutes + Q&A up to maximum of further 30 minutes
Content Overview:
The relentless intensity of RDE certification diverts resources away from critical competitive benchmarking and off-cycle evaluations. In a challenging market, such investigations can become a luxury.
We have a solution.
Emissions Analytics' independent EQUA database provides a cost-effective tool for certification, powertrain and emissions teams to understand their market position, the real risks of non-compliance and see which vehicles are setting new standards for emissions control.
With over 2,000 vehicles tested to date and hundreds more lined up for 2020, EQUA is the world’s largest commercially available real-world emissions database, with a unique bank of PEMS & OBD data. Over the years it has become an integral tool for vehicle manufacturers in Europe and North America to gather benchmarking intelligence and support R&D activities at the click of a button.
Join our Founder & CEO, Nick Molden, as he covers:
EQUA test process and methodology including cold-start, high load and hard acceleration
Database size, scope and detail
NEW – Technology supplier info including; engine, transmission, fuel injection, turbocharger
Ammonia (NH3) measurement data, ahead of Euro 7
European market update: WLTP, NOx and exceedance risk
US market update: emissions performance and real-world CO2 trends
Access to our data

Emissions Analytics Wins Environmental Excellence in Transportation Award
Emissions Analytics has been awarded SAE International's Environmental Excellence in Transportation Award for developing a Cabin Air Quality Index method.

We’re delighted to announce that Emissions Analytics has won an Environmental Excellence in Transportation Award.
In honour of Earth Day, SAE International announced the winners of its Environmental Excellence in Transportation Award. This award showcases the work of individuals and teams who through their ingenuity and dedication have made significant innovations in reducing the environmental impact caused by the transportation industry.
Emissions Analytics was successful in the New Methods and Tools category for the Development of Fractional Cabin Air Recirculation System, Standard Testing Method for Vehicle Cabin Air Quality, and Cabin Air Quality Index.
You can read more about the awards here.
You can find our more about our Pollution In-Cabin Measurement System (PIMS) capabilities here.

What else is coming out of our tailpipes?
Tightening tailpipe regulations is a natural impulse in a post-Dieselgate world. However, we are in danger of over-regulating familiar, easy-to-measure emissions such as CO2 and NOx while ignoring a wide range of other, potentially harmful substances that can now be measured but have previously been ignored.
Unregulated volatile organic compounds
Tightening tailpipe regulations is a natural impulse in a post-Dieselgate world. However, we are in danger of over-regulating familiar, easy-to-measure emissions such as CO2 and NOx while ignoring a wide range of other, potentially harmful substances that can now be measured but have previously been ignored.
As European legislators move beyond the Euro 6 tailpipe emissions standard, they are beginning to grapple with this, at the same time that non-tailpipe emissions are rapidly coming into focus as a major concern.
Previous newsletters focused on two types of non-exhaust emissions – tyre wear and vehicle interior air quality focusing on volatile organic compounds (VOCs) produced by the car’s own interior. Today we turn back to tailpipe emissions but with the same mindset – what substances are emitted but not regulated, and are they harmful?

For tailpipe VOCs, some laboratory regulations exist around the world, but only on a limited basis, and averaged over a test cycle. Here, we look at real-time data we gathered with Cambridge, UK-based Anatune, which show a richer picture and some unexpected results.
In the previous newsletter on VOCs (https://bit.ly/2xyzyZa) we showed that it is possible to identify different analytes in real time, measure the rate at which they are emitted and reveal unexpected spikes in some analytes that surpassed regulated limits.
Turning to tailpipe emissions, we worked with Anatune again to use the SIFT-MS to sample the tailpipes of a 2011 model-year Volkswagen Golf (diesel); a 2019 model-year Peugeot 2008 (gasoline) and a 2019 model-year Renault Captur (diesel). The cars were soaked in a controlled environment prior to testing. During the first 100 seconds the probe, positioned in the tailpipe, measured the prevailing ambient air; From 100-400 seconds ignition and idle; from 400-800 seconds at 1,500 rpm; from 800-1,100 seconds at 3,000 rpm and then back to idle for the last 100 seconds.
We conducted the analysis for hydrocarbons, sulphurs and oxygenates. Hydrocarbons are the product of combustion and include butadiene, heptane, styrene, benzene, hexane, toluene, butane, methane and xylenes + ethylbenzene.
Anatune Senior Application Chemist and SIFT-MS Specialist Dr Mark Perkins notes that they all have a degree of toxicity and are all regulated in respect of occupational exposure limits (OEL). Heptane is a marker for unburnt fuel.
The outstanding result of the test is the unanticipated initial spike in heptane and other hydro-carbons xylenes + ethylbenzene, methane, styrene and toluene, observed in the only petrol vehicle we tested, the Peugeot.

In particular, the spike in heptane in the first few seconds after ignition reached a concentration of over 6,000 micrograms per cubic metre. This was sixty times more than the highest reading for the older diesel Golf, while the Renault never produced more than 25 micrograms of heptane.
The peak heptane production occurred differently in both diesel vehicles, at the 800 second juncture when engine revolutions were doubled from 1,500 to 3,000.
The newer, diesel Renault had very low emissions of all hydrocarbons except for an initial peak of methane upon ignition, of 200 μg/m3; the older VW had a peak methane emission of 80 μg/m3, while butane emissions tracked methane emissions and styrene rose and fell proportionately to engine load.

Moving on to sulphurs, which include ammonia, carbonyl sulphide, dimethyl sulphide and hydrogen sulphide, we observed a sudden spike at 750 seconds from a baseline of nil to over 400 μg/m3 of ammonia, again for the gasoline-powered Peugeot. We can only assume here that there was a ‘burp’ from the catalytic converter which was momentarily overwhelmed, but there is no clear or definite explanation.

Once again the overwhelming thing to note is the scale of the gasoline car’s emissions compared to the diesels’. The average ammonia emissions from the Peugeot at 3,000 rpm are over 50 μg/m3, compared to a maximum of 0.6 μg/m3 in the Renault and 0.4 μg/m3 in the VW.
Moving on to oxygenates, these are volatile organic compounds such as methacrolein, acetone, butanal, butanone, ethanol, hexanal and methanol.
The important thing to remember about these VOCs is that they may not be toxic in isolation, and in tiny amounts. But they are not being emitted in isolation and have a direct impact on broader categories of pollution.
Under sunlight, VOCs react with vehicle-emitted nitrogen oxides to form ozone, which in turn helps the formation of fine particulates. The accumulation of ozone, fine particulates and other gaseous pollutants results in smog.
The VW Golf produced methacrolein at over 6 μg/m3 when the engine was stepped up to 3,000 rpm. Exposure to methacrolein is highly irritating to the eyes, nose, throat and lungs. The VW also produced just below 5 μg/m3 of acetone, less toxic than methacrolein but causing irritation to eyes and throat.

The Renault also produced noticeable amounts of acetone, peaking at almost 6 μg/m3, but never breached 3 μg/m3 for methacrolein.
The gasoline Peugeot offered a completely different map. Mirroring the hydro-carbon results, it shows a spike on first ignition in hexanal to nearly 140 μg/m3, and between 4-500 seconds two spikes in butanal of 80 and 50 μg/m3 respectively. Butanal (N-butyraldehyde) is an organic compound which is the aldehyde derivative of butane. It is judged to be of low toxicity to humans unless inhaled at high concentrations, causing chronic headaches and ataxia.

By way of summary, many of the observed measurements followed the dynamic that any vehicle engineer would anticipate. Immediately following a step-up in rpm there is a spike in emissions before a steep fall. This represents the time gap between more fuel being sent to combust and control mechanisms responding, upon which a new equilibrium is reached.
But the take-away result here is the very high emissions of some hydrocarbons and other VOCs from the gasoline-engined Peugeot upon ignition from cold. Heptane, a marker for unburned fuel, spiked momentarily to over 6,000 μg/m3, almost 60 times the highest level observed throughout the test from the older diesel, the Volkswagen.
Similar spikes are seen from methane, xylenes and ethylbenzene, hexane and styrene – all measured in quantities 10-40 times higher than the two diesels.
Using the SIFT-MS approach has shown that beneath the more familiar time-weighted average of total emissions, whether of VOCs or hydrocarbons, is a dynamic and unexpectedly ‘spiky’ reality that can result in rapid accumulations of some chemicals well above their permissible, regulated maximums.


New Porsche Taycan Turbo S electrical vehicle testing in partnership with Motor Trend
In our quest to understand the real-world emissions and efficiency of motor vehicles, we were pleased to be able to test the new Porsche Taycan Turbo S electric vehicle (EV) in California, with our partners Motor Trend.
The recurrent scourge of technology preference
and the fallacy of zero emission
In our quest to understand the real-world emissions and efficiency of motor vehicles, we were pleased to be able to test the new Porsche Taycan Turbo S electric vehicle (EV) in California, with our partners Motor Trend www.motortrend.com
The punchline was a range, on our EQUA Real Mpg test, of 254 miles, reflecting a combined efficiency of 2.2 miles per kWh or 73.4 Mpg-equivalent (converting the electricity to a gasoline equivalent based on energy content). The test route is made up a of a combination of city and highway driving over approximately 100 miles, and includes measurement of charging losses in the efficiency calculation. So, the Taycan does not have best-in-class EV efficiency, but it exceeded its official figure by an impressive 32%, and is arguably a striking looking and beautifully made vehicle.

But does efficiency in an EV matter? Is an EV always so much better, and its carbon dioxide (CO2) commensurately so much lower, than a typical internal combustion engines (ICE), that efficiency is of secondary importance?
Considering a recent paper in Nature Sustainability from March 2020 by Florian Knobloch et al entitled ‘Net emission reductions from electric cars and heat pumps in 59 world regions over time’, a typical EV in the US emits CO2 of around 354 g/mile (over an average life of around 93,000 miles), of which approximately half is accounted for by the electricity in the usage phase. So, 177 g/mile can be put down to electricity production, distribution, consumption and attendant storage and charging losses. Let’s assume for the purposes of this document that the Taycan is similar to this average vehicle.
A near equivalent pure ICE is the Porsche Panamera 4, which has tailpipe CO2 of 407 g/mile from the US Environmental Protection Agency’s (EPA) fueleconomy.gov website. According to ‘Understanding the life cycle GHG emissions for different vehicle types and powertrain technologies’ by Ricardo from August 2018, the tank-to-wheel CO2 of a typical ICE is 65% of total lifecycle CO2 (taking the middle of the 60-70% range quoted), implying total CO2 over the life of the vehicle of 626 g/mile. Therefore, the EV emits approximately 57% less during usage and 43% less total CO2 than the ICE, based on typical emissions from electricity production.
In addition to this, the EV is undoubtedly superior to the ICE on tailpipe nitrogen oxides (NOx), carbon monoxide (CO) and particulate mass (PM) for an obvious reason. Even so, from Emissions Analytics’ testing the ICE would only emit 21 mg/mile of NOx, 2.5 g/mile of CO and typically about 0.5 g/mile of PM, well below the regulated limits.

If we then factor in non-tailpipe emissions, the picture begins to change. Of these, the large majority, perhaps up to 90%, comes from tyre wear abrasion, so we will focus on these. Brake wear should not be completely ignored due to the chemical composition of the particles, but the regenerative braking advantage of EVs will decline as hybridisation makes such braking widespread among ICEs. Previous Emissions Analytics’ newsletters on tyre wear (https://bit.ly/39UHbX4 and https://bit.ly/3c36urq) have shown that this can be a combination of coarse and ultrafine particles. According to ‘Wear and Tear of Tyres: A Stealthy Source of Microplastics in the Environment’ published in the International Journal of Environmental Research and Public Health in 2017, a large car (with a mass of around 3,300 lbs) will typically emit 26 mg/mile of PM. Further, this paper suggests that PM emissions increase proportionately with vehicle weight.
Therefore, we can deduce the total (tailpipe and non-tailpipe) PM emissions for both Porsches, as show in the table below. To this, for comparison, we have also added the Porsche Panamera 4 e-Hybrid and Tesla Model S. The basis of the calculations are described in the footnote.

It is clear that non-tailpipe PM emissions exceed those from the tailpipe, which is not surprising as tyre wear increases with the weight of the vehicle, other things being equal, and EVs are heavy. Meanwhile, tailpipe PM from ICE vehicles has fallen greatly, whether they have unfiltered gasoline or filtered diesel engines.
So, if a buyer switches from the Panamera ICE to the Taycan, the 43% reduction in CO2 emissions and zero tailpipe emissions is balanced by an 19% increase in PM emissions and a doubling in purchase price ($185,000 compared to $91,800). The hybrid occupies the intermediate position, delivering a 25% reduction in CO2 for the price of 17% higher PM and an extra $12,000 purchase price. The higher efficiency and slightly lower weight of the Tesla means that it delivers a reduction in CO2 of 60% for only a 14% rise in PM emissions and a 13% reduction in purchase price, although it concedes on maximum power and torque.
This analysis does not include the effect on particle number (PN). However, the report from the UK Government’s Air Quality Expert Group (AQEG) in July 2019 suggested that PN emissions could increase by up to 1.8% points for every 10 kg increase in the vehicle weight. That would imply that the Taycan would have 50% higher PN emissions than the Panamera ICE. If true, it would have a significant air quality impact because PN highlights the ultrafine particles that mass measurement misses, and it is ultrafines that may prove to be more problematic for human health.
The trade-off between lifecycle (LCA) CO2 and PM is shown in the chart below.

In summary, we can see a clear trade-off between climate-change-related and air pollutant emissions, and cost, which is reminiscent of the historical trade-offs between different ICEs. We also can see that there are material differences between different electrified vehicles. What this means is that discrimination between vehicles should be based on total real-world emissions and fuel economy, rather than asserting blanket technology preferences. The coming battle between EVs will be on the basis of energy efficiency, vehicle weight and tyre quality, which, in combination, will allow shifts towards Pareto superior combinations of CO2 and pollutant emissions. We accept that this is only a snapshot, but chosen to illustrate what we believe is a much wider pattern.
Emissions Analytics has been considering all these different elements to give a rounded view on environmental footprint. The first point to make is that the result differs materially between different models, so working at the level of generic groups can be hazardous. Second, many of the areas suffer from limited available data, either through scarcity or it being proprietary to manufacturers or suppliers. Specifically, we are conducting more testing to quantify both the PM and PN emissions – tailpipe and non – from a range of vehicles of different weights in real-world conditions.
If the first modern internal combustion engine spluttered into a smoky existence in 1876 (Nikolaus Otto), equally it is true that the first lithium ion batteries only made it to a commercially viable form in 1991, following intensive investment by Japan’s Sony corporation over ten years, under the leadership of 2019 Nobel Laureate Dr Akira Yoshino.
The rapid rise of electric vehicles, whether battery or hydrogen fuel cell, is indisputably the most important technology change occurring since the advent of the car over a century ago, and amounts to no less than its reinvention for the coming century.
Yet the revolution remains youthful and the technologies are comparatively new in any meaningful sense (we take account of pioneering EVs over one century ago – but they were not pursued as Ford got going and liquid fuels prevailed). Exxon developed fully scaled electric cars in the 1970s in response to the oil price shock, but they never took off. This is worth remembering in 2020.
The Exxon battery programme was led by M. Stanley Whittingham (also a 2019 Nobel Laureate), but the batteries proved unstable. However, what killed the programme off wasn’t just vehicle fires but the oil price, which fell after its calamitous rise earlier in the decade.
In light of the very recent oil price collapse, governments and car makers alike are about to be tested as never before for their commitment to electrification, a timely reminder that young and comparatively expensive technologies do not succeed in a bubble protected by virtue but have to fight for their existence against incumbent technologies that are proven and comparatively cheap.
Against that, the few moving parts of EVs and the existing experience of fleet operators point to exceptionally low maintenance costs and enhanced longevity.

What makes a great car is a question that has been blown wide open with competing technologies, but you can rest assured that Emissions Analytics is committed to technology neutrality, real-world testing of the many variables that define overall vehicle performance and dispassionate assessment for consumers and industry alike. The rapidly developing EV landscape is a source of intense interest to us and we welcome it. But, please, let us once and for all agree: there is no such thing as a zero emission vehicle.
*Footnote
The calculation of LCA CO2 emissions for the Panamera ICE and the Taycan are described in the main text. The value for the Panamera hybrid is approximated by calculating an average of the construction/battery phase of the Panamera ICE and the Taycan, weighted 85%/15% reflecting the relative battery size of the hybrid compared to the EV. In other words, the hybrid is considered a mixture of ICE and EV. To this, the EPA tailpipe CO2 value is added. The LCA CO2 of the Model S is calculated by adjusting the usage phase of the Taycan according to the greater efficiency of the Model S, with unchanged construction/battery phase. The calculation of the non-tailpipe PM is also covered in the main text. The values for the four vehicles are calculated as linear and proportionate extrapolations from the benchmark 3,300 lb large car with 26 mg/mile tyre wear emissions.

Fueling the Future podcast: Tires Not Tailpipe
Our Founder & CEO Nick Molden was delighted to be invited onto the Fueling The Future podcast to take part in a discussion with Tammy Klein of Future Fuel Strategies about non-exhaust emissions in vehicles.

Our Founder & CEO Nick Molden was delighted to be invited onto the Fueling The Future podcast to take part in a discussion with Tammy Klein of Future Fuel Strategies about non-exhaust emissions in vehicles.
Click below to hear the podcast:
You can also subscribe to the Fueling The Future podcast on iTunes by clicking here.
Construction: the neglected source of urban emissions?
Emissions data on construction equipment is scarce, often out-of-date and gathered in unrealistic conditions. These machines fall within the generic category of non-road mobile machinery (NRMM), or ‘off-road’.
Real-world emissions test results from building sites
Emissions data on construction equipment is scarce, often out-of-date and gathered in unrealistic conditions. These machines fall within the generic category of non-road mobile machinery (NRMM), or ‘off-road’.
This segment of machinery is often overlooked in preference for passenger cars or heavy goods vehicles, but, like non-exhaust emissions, it is a source of growing importance to urban emissions. As wider exhaust emissions are brought down, so the share from construction sites may well rise as a proportion of the whole. Regulations in this area have lagged behind heavy-duty goods vehicles, while there remain many older engines in service – 25% of the registered London fleet in 2019.

To understand the situation better, Emissions Analytics, together with Kings College London, conducted an extensive real-world field test on 30 different construction machines, including nine different types ranging from static generators to telehandlers and excavators.
The 2016 London atmospheric emissions inventory estimates that the construction sector contributes 34% of the total PM10 (including fugitive dust), 15% of PM2.5 and 7% of the total nitrogen oxides (NOx) – the largest, third largest and fifth largest sources, respectively.
It can be seen immediately that construction sites are an important part of any regulatory effort to improve urban air quality.
The purpose of our field test mirrored the approach we have taken with other classes of vehicle, namely to compare regulatory standards with real-world emissions, premised on the possibility that real-world emissions are typically higher than their laboratory counterparts.
The results of our extensive field test can be summarised as follows:
Absolute improvements are clear from construction equipment certified to the latest regulatory stage, resulting mostly from deployment of better engine management and after-treatment technology.
Exceedances of certification values were observed, although were not as widespread as with light-duty vehicles before the introduction of Real Driving Emissions testing.
Significant variability exists between machines.
Emissions are sensitive to engine load.
Across the board we found that the highest NOx emissions were from older construction machines, typically Stage III-A and III-B, but which reduced in the newer Stage IV engines owing to more advanced engine management systems and exhaust after-treatment, as shown in the left-hand chart below. Average Stage VI emissions are down 78% on the prior stage.

However, we also found that Selective Catalytic Reduction (SCR) systems could be better. They perform poorly when an engine is left to idle for longer than ten minutes, whereupon the exhaust temperature falls below 200 degrees Celsius, which explains many of the high conformity factors among Stage IV machines shown in the right-hand chart above. However, it should be emphasised that a conformity factor above 1.0 does not necessarily entail any non-compliance as these tests were undertaken on machines performing routine work rather than according to the mandated test cycle for certification.

The issue of falling exhaust temperature can be seen in this example of a 129kW excavator operating with regular 15-minute idling periods. The instantaneous NOx emissions and exhaust temperature are shown in the graph below. During idling, the exhaust temperature falls and then on resumption of work there is a large spike in NOx emissions. Overall, the exhaust temperature is below 200 degrees Celsius for 42% of the time. This demonstrates the importance of careful thermal management of after-treatment systems to ensure low real-world emissions.

Another aspect concerns generators, which typically being ‘static’ are overlooked as NRMM. In fact they comprise 5% of the London fleet of NRMM and have a fundamental role to play on almost every construction site. While in London they only needed to be type-approved to Euro Stage III-A historically, with no exhaust after-treatment to control for NOx or particle emissions, approval to the new Stage V is required from 2020.
We also found that numerous generators exceeded their regulated limits for NOx emissions. The 80, 200, 320 and 500 kVA generators were 1.25, 1.08, 1.58 and 1.46 times their respective EU Stage III-A NOx emission standards. The 320 and 500 kVA generators emitted above their standards at all loads, while the others showed the worst performance at low and high loads.
On a positive note, the generator we tested that had been retrofitted with SCR yielded an 85% reduction in NOx emissions. While this wasn’t good enough to comply with Stage V emissions, it represented a strong reduction in emissions at all engine loads: on the ISO 8178 test cycle they fell from 6.03 g/kWh to 0.95 g/kWh. We found that the introduction of an exhaust filter reduced particle number by two orders of magnitude and to within the future Stage V particle number limit of 1 x 10¹² # per kWh.
By the nature of the ISO 8178 test, it is possible to plot the NOx emissions against the load demand on the generator, as shown in the chart below.

In all cases, there is a characteristic U-shaped relationship, with the lowest emissions per unit of work done occurring between 25% and 50% of maximum load. The lowest emissions on average were seen on the mid-size, 200kVA, generator, although it obviously had power limits at the top end. These results illustrate the benefit in choosing the best sized generator for a given task: too small and the emissions are higher as well as the lack of top-end power; too large are the emissions are also higher.

In summary, there are some echoes, but less extreme, of the issues of NOx exceedances for passenger cars in this test work on construction equipment and generators. Overly-downsized engines and poor after-treatment calibration in both cases can lead to elevated emissions. However, these results show significant progress in NOx reduction at Stage IV, and early evidence is showing further improvements at Stage V. The focus here has been on NOx as our results show few exceedances on particle emissions – again similar to passenger cars since the Euro 5 regulatory stage.
Putting this in the wider context of greenhouse gas emissions, although there are no CO2 standards for non-road machinery, cities are likely to be conscious of any trade-offs between better air quality and climate change effects. Indeed, our tests show a 9% increase in CO2 emissions from Stage III-B to Stage IV, although that comes after a 40% reduction from Stage III-A to III-B. This shows that the perennial tension and trade-offs in controlling different pollutants, and will continue to provide policy dilemmas that can only be resolved by use of real-world testing.
Archive
- AIR Alliance 3
- Air Quality 38
- Audio 3
- Climate Change 14
- EQUA Index 21
- Electrified Vehicles 28
- Euro 7 3
- Fuel Consumption/Economy 20
- Fuels 4
- Infographic 18
- Media 4
- NRMM/Off-road 3
- Newsletter 103
- Podcast 7
- Presentation/Webinar 18
- Press Release 19
- Regulation 16
- Reports 4
- Tailpipe Emissions 49
- Tyre Consortium 2
- Tyre Emissions 26
- Vehicle Interior 6